2025 HomePage News
At-Home Entertaining
Report

As they look ahead through 2025, consumers responding to the International Housewares Association’s At-Home Entertaining Survey remain concerned about the economy and geopolitical climate, but as more optimism has entered the picture, suggested by recent higher consumer confidence numbers, they also have their own moments to celebrate in the immediate future.
According to the recently published Eating Patterns in America report from Circana, consumers are entertaining more at home to reinforce personal connections and save on costs associated with social occasions.
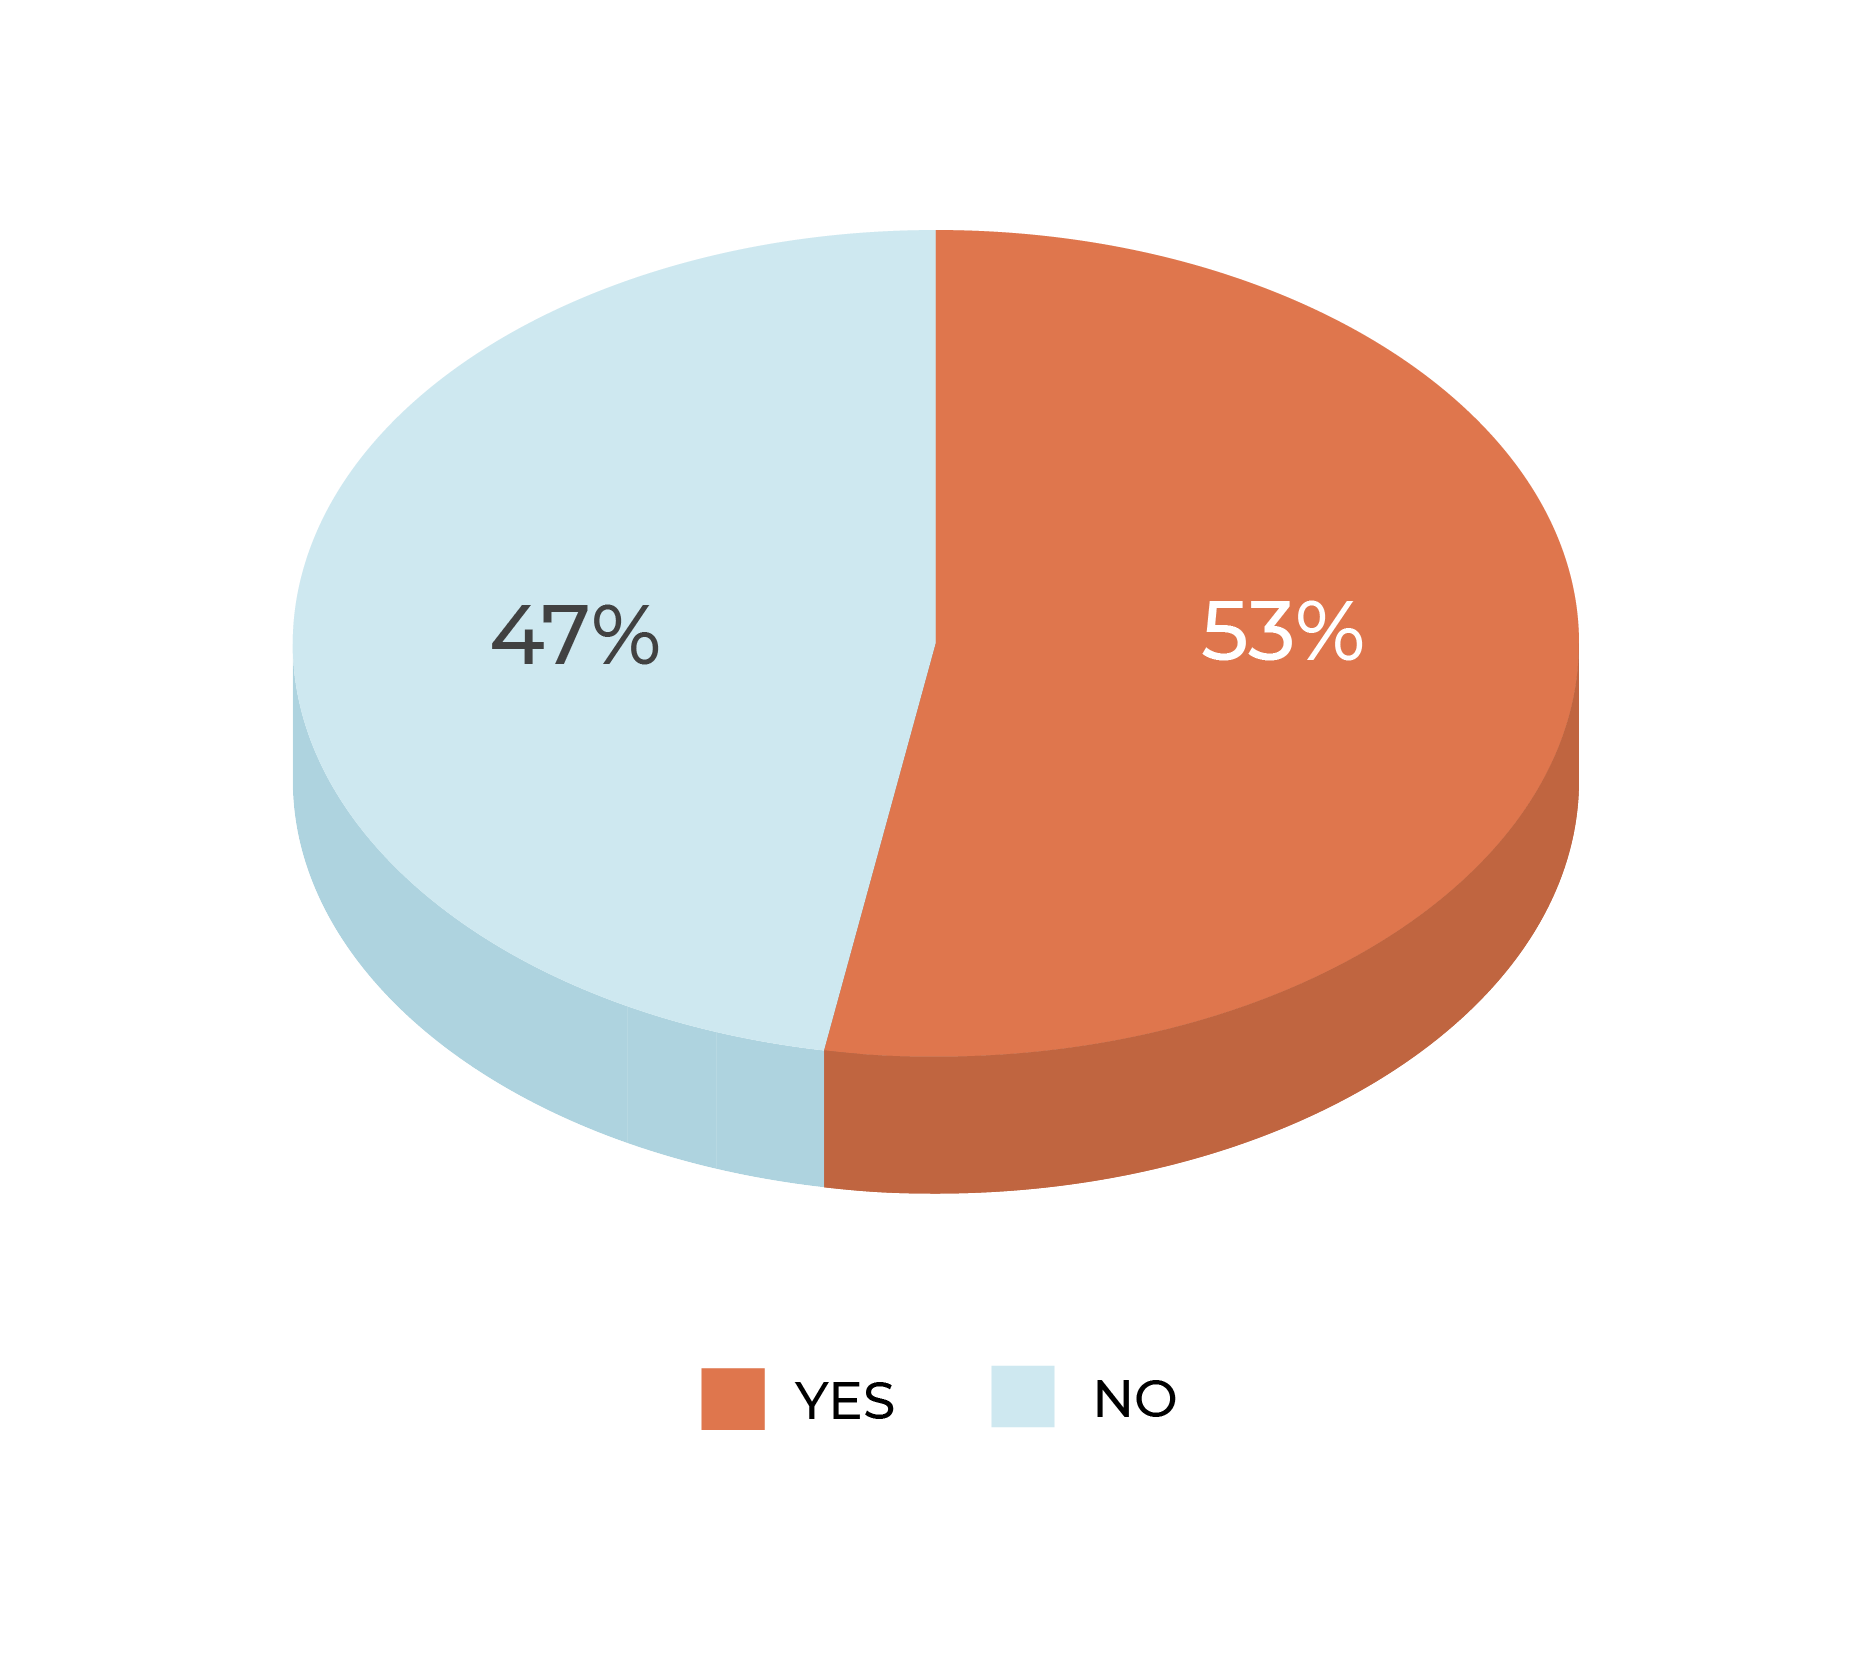
Despite uncertainty and inflation, 47% of survey respondents held casual gatherings involving food and drink—anything from informal parties to sit-down dinners—over the past year. Half of men responding to the survey had hosted a gathering compared to 45% of women. The age of respondents made little difference, although the youngest, at 18-34 years of age, and oldest, at 65+, were slightly ahead of the rest.
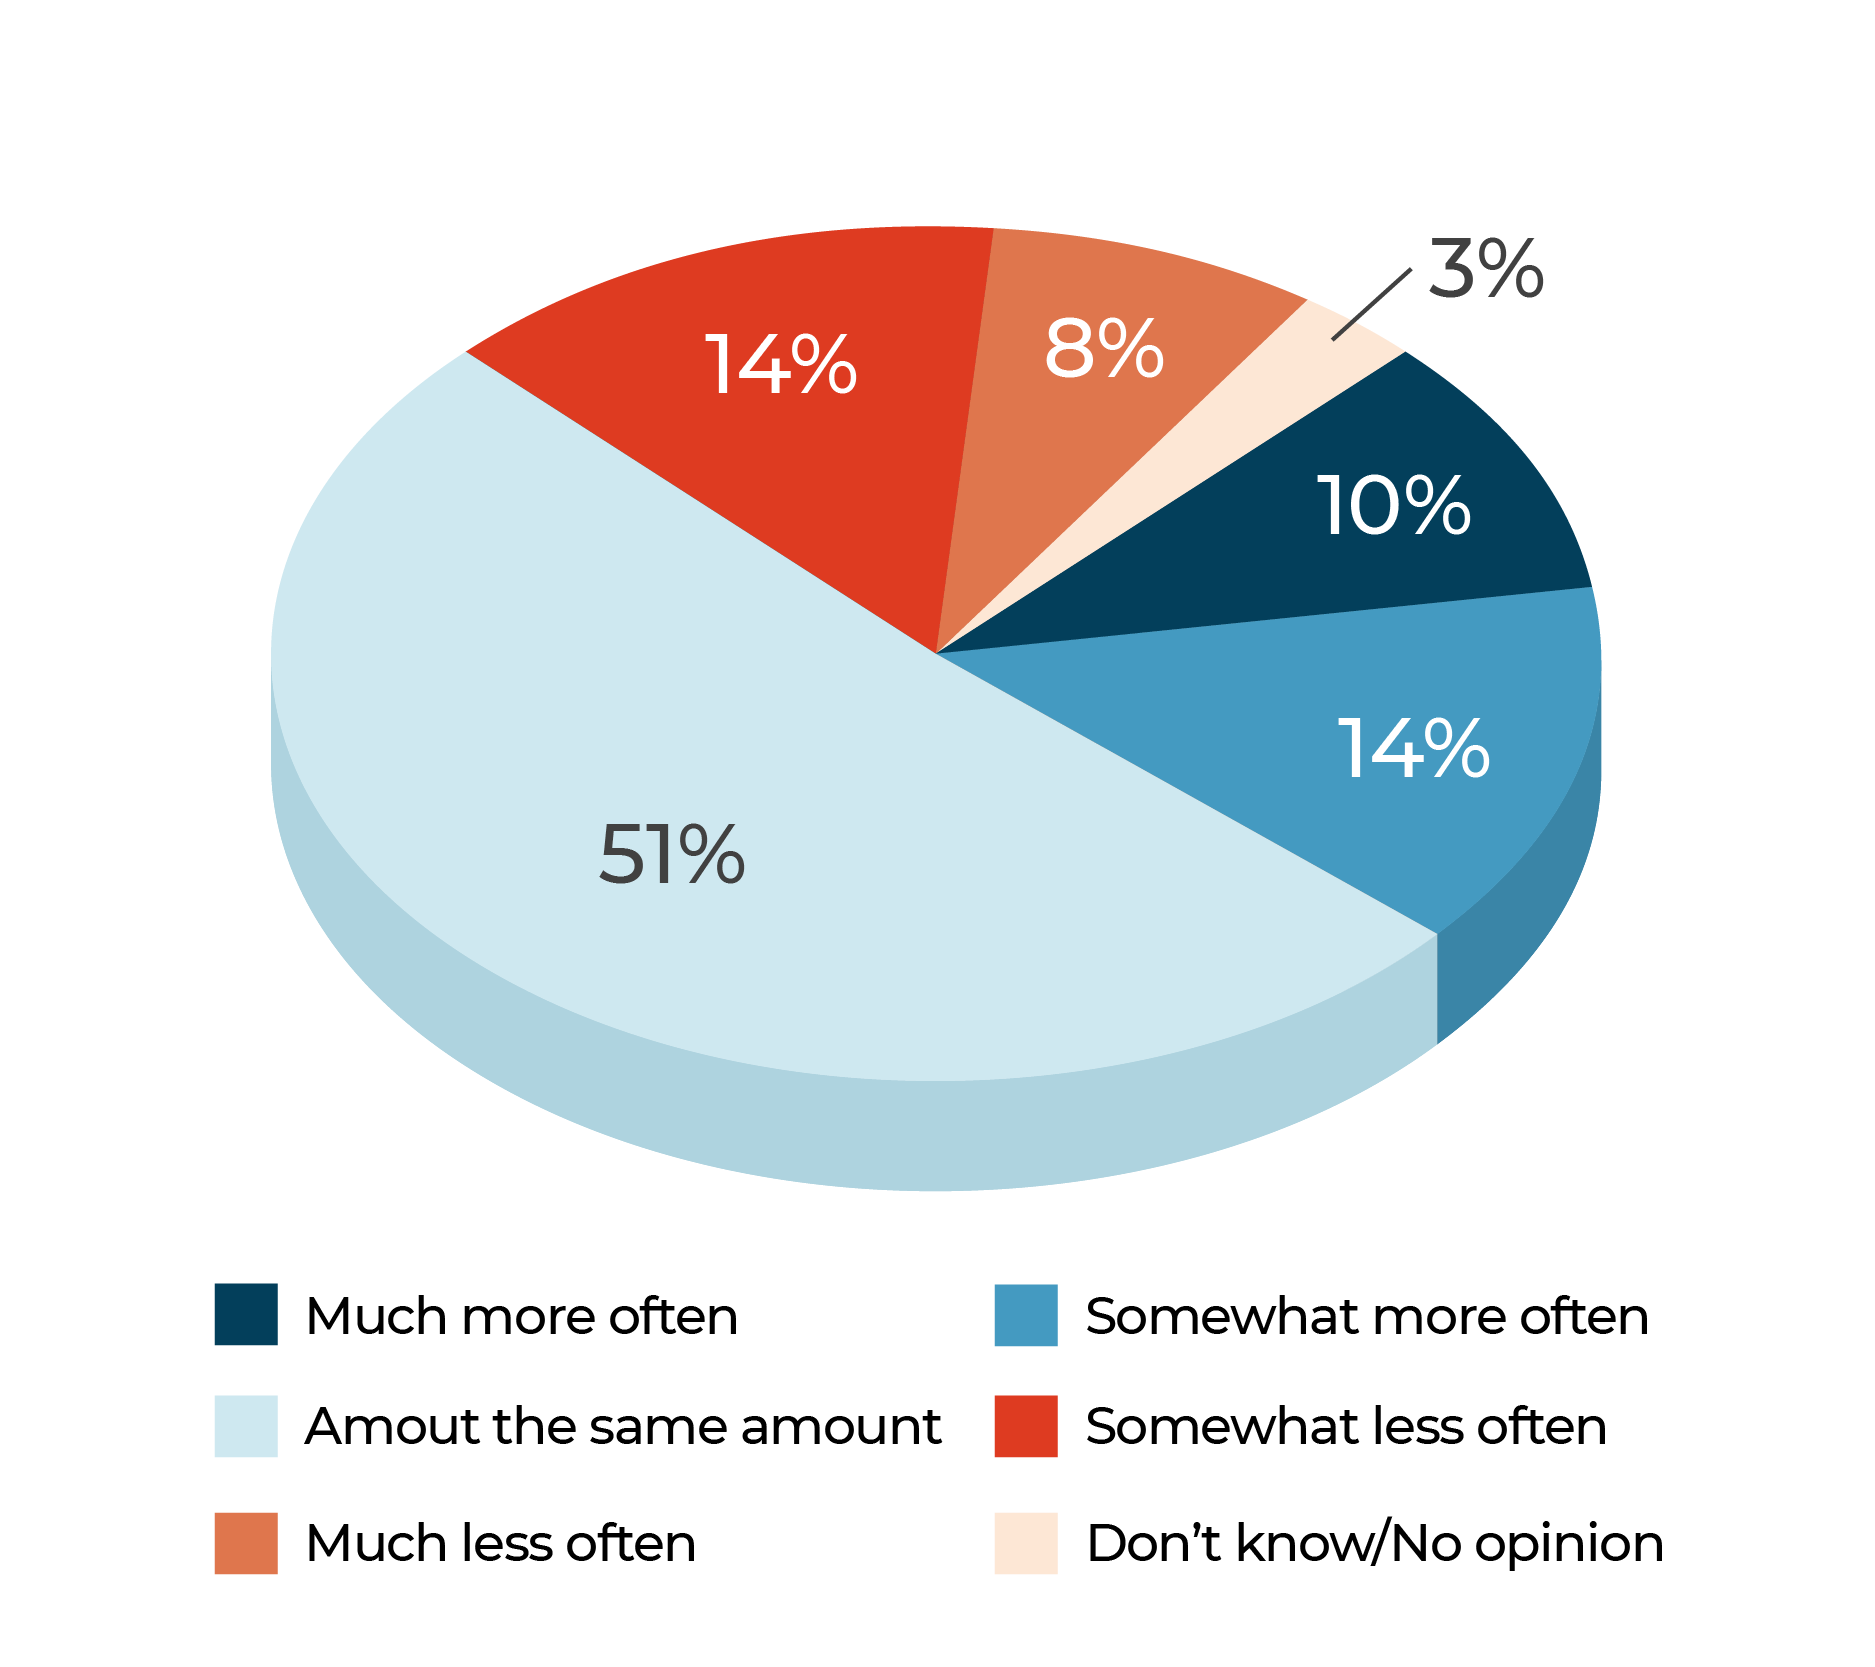
24% of consumers were more likely to host a gathering in the year ahead, and 51% said they would hold about the same number as last year, which suggests that the year ahead holds some additional opportunity.
At the same time, 49% of consumers responding to the survey said they had hosted celebratory gatherings such as birthdays at home, with men reporting more than women at 52% to 47%. Regarding respondents’ age, 18-34-year-olds led at 54%, five points ahead of the runners-up, those 45-64.
In looking ahead, 24% of consumers were more likely to host a gathering in the year ahead, and 51% said they would hold about the same number, which suggests that the year ahead holds some additional opportunity. Men, at 24%, were again slightly more likely than women, at 23%, to expect they might hold a gathering. Then, younger consumers, those under 44 years of age, were more likely to host a gathering than older consumers by several points.
Compared to the past 12 months, do you anticipate hosting more or less gatherings in your home over the next 12 months?
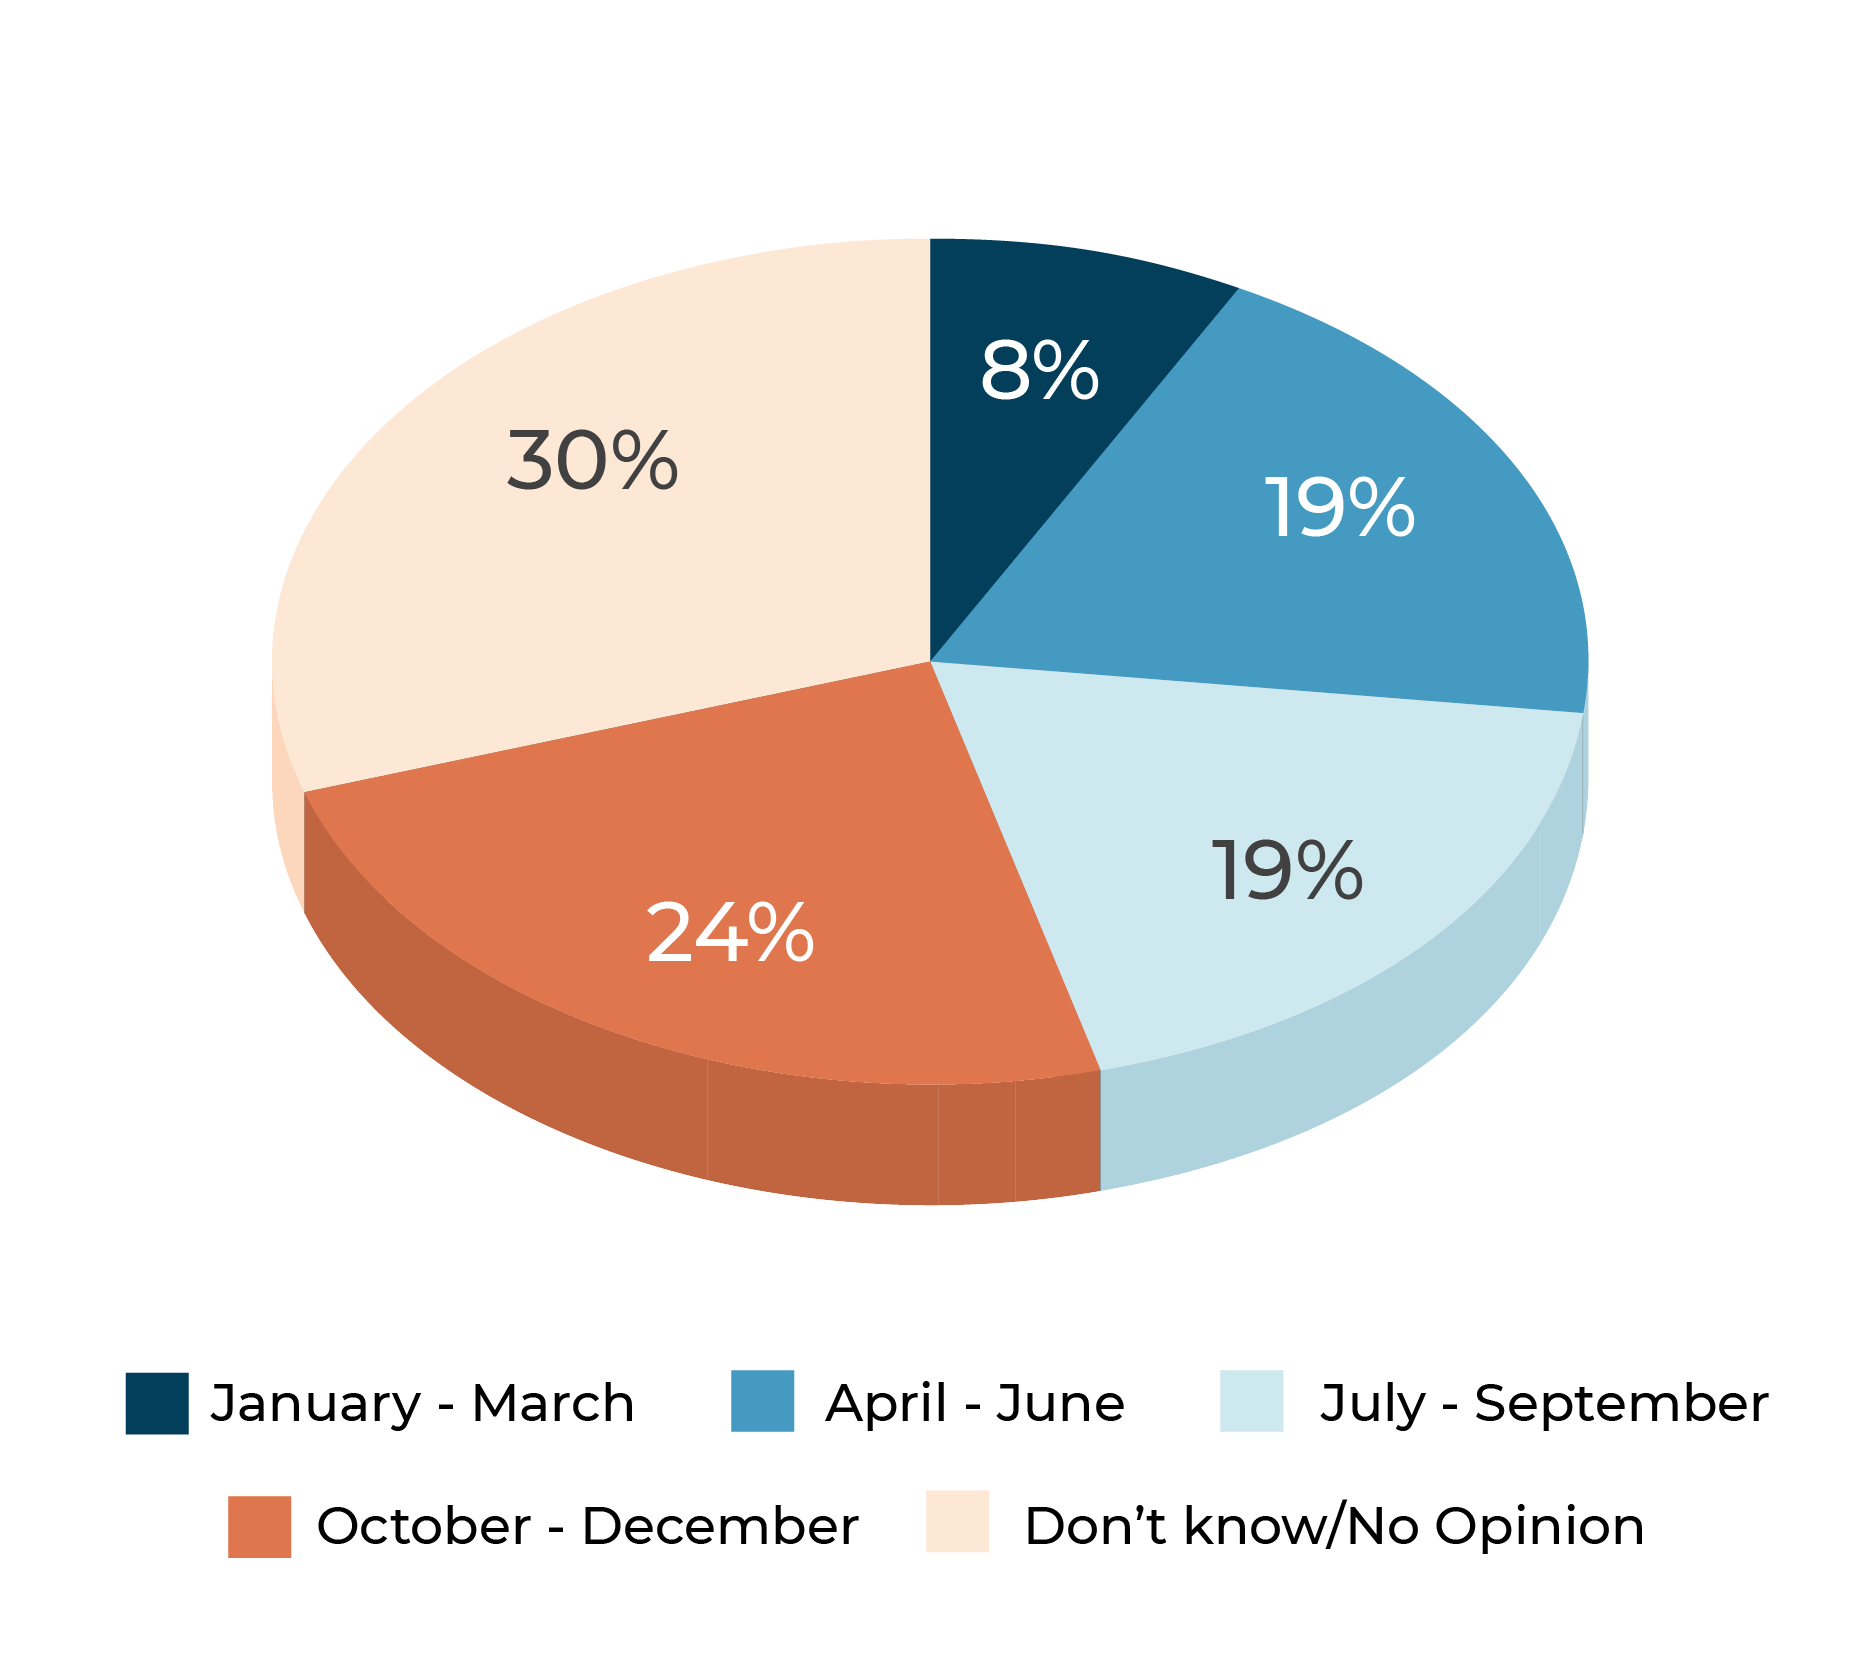
48% of consumers said they would most likely entertain at home in the October-December timeframe.
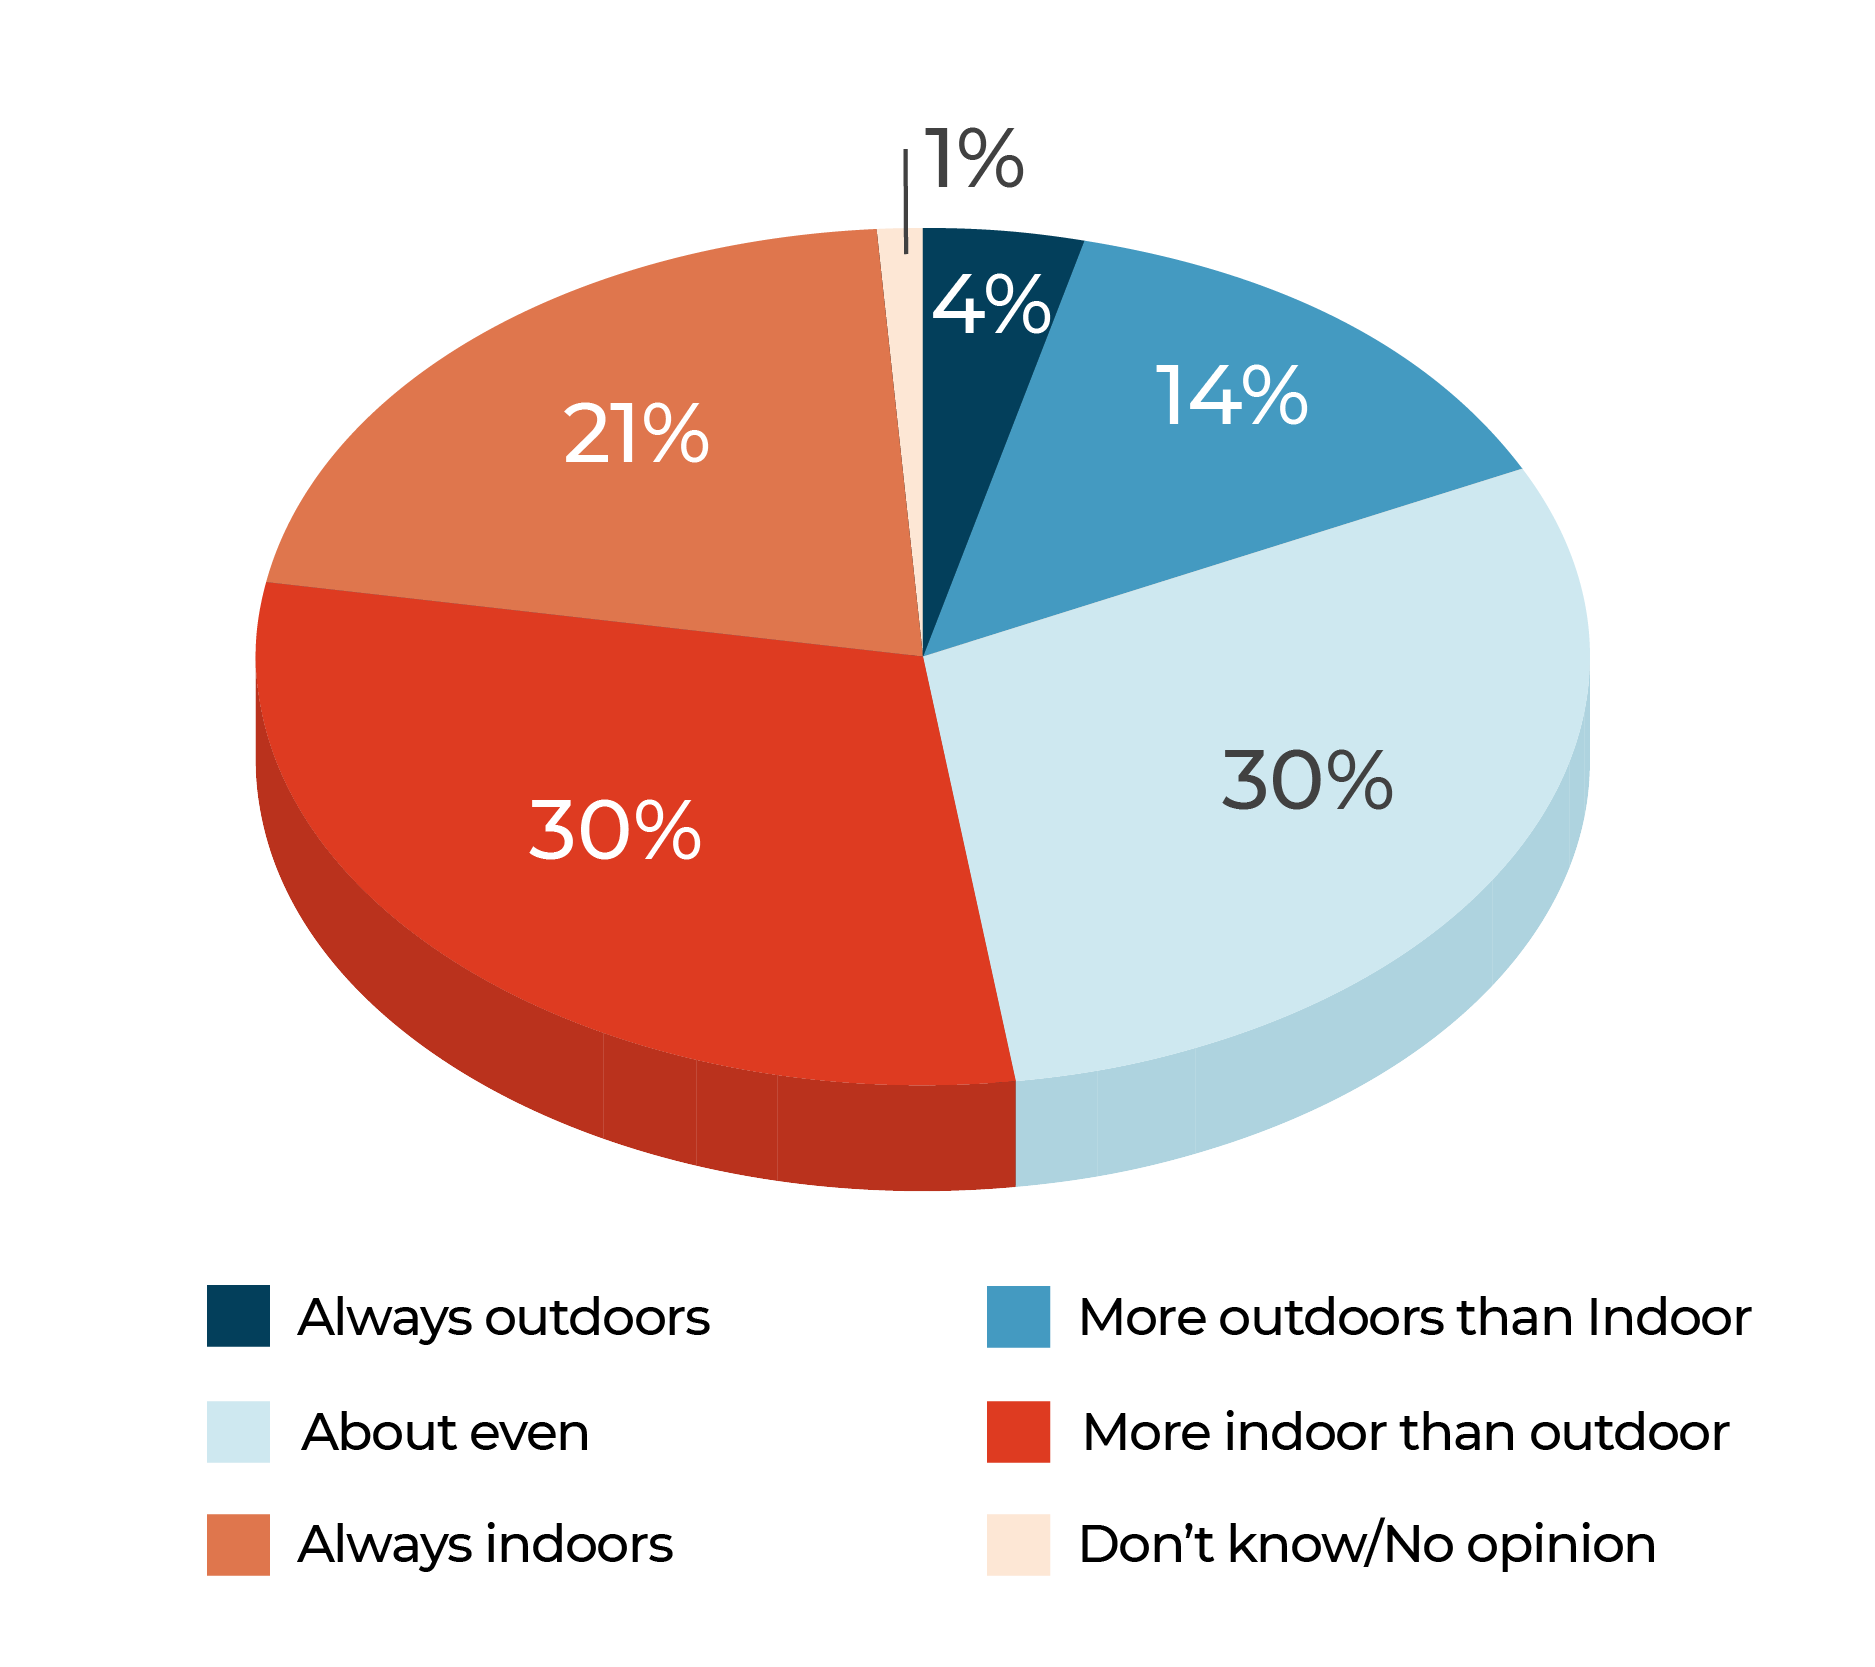
Thinking about the gatherings you host at your house, how often are the events indoors vs. outdoors?
As the year progresses, 48% of consumers said they would most likely entertain at home in the October-December timeframe, with 17% looking at July-September, 12% from April to June and 24% from January to March.
Just over half of consumers said they host more indoor gatherings than outdoor, with 18% saying they hold more outdoors than in. Still, consumers have lately invested in the leisure-time component of their outdoor spaces, and 31% of respondents split their indoor and outdoor events evenly. Respondents 18-34 are most likely to host most of their events outdoors, at 23%, followed by those 45-64 at 19%. Men, at 20%, are most likely to hold an outdoor event versus women, at 15%.
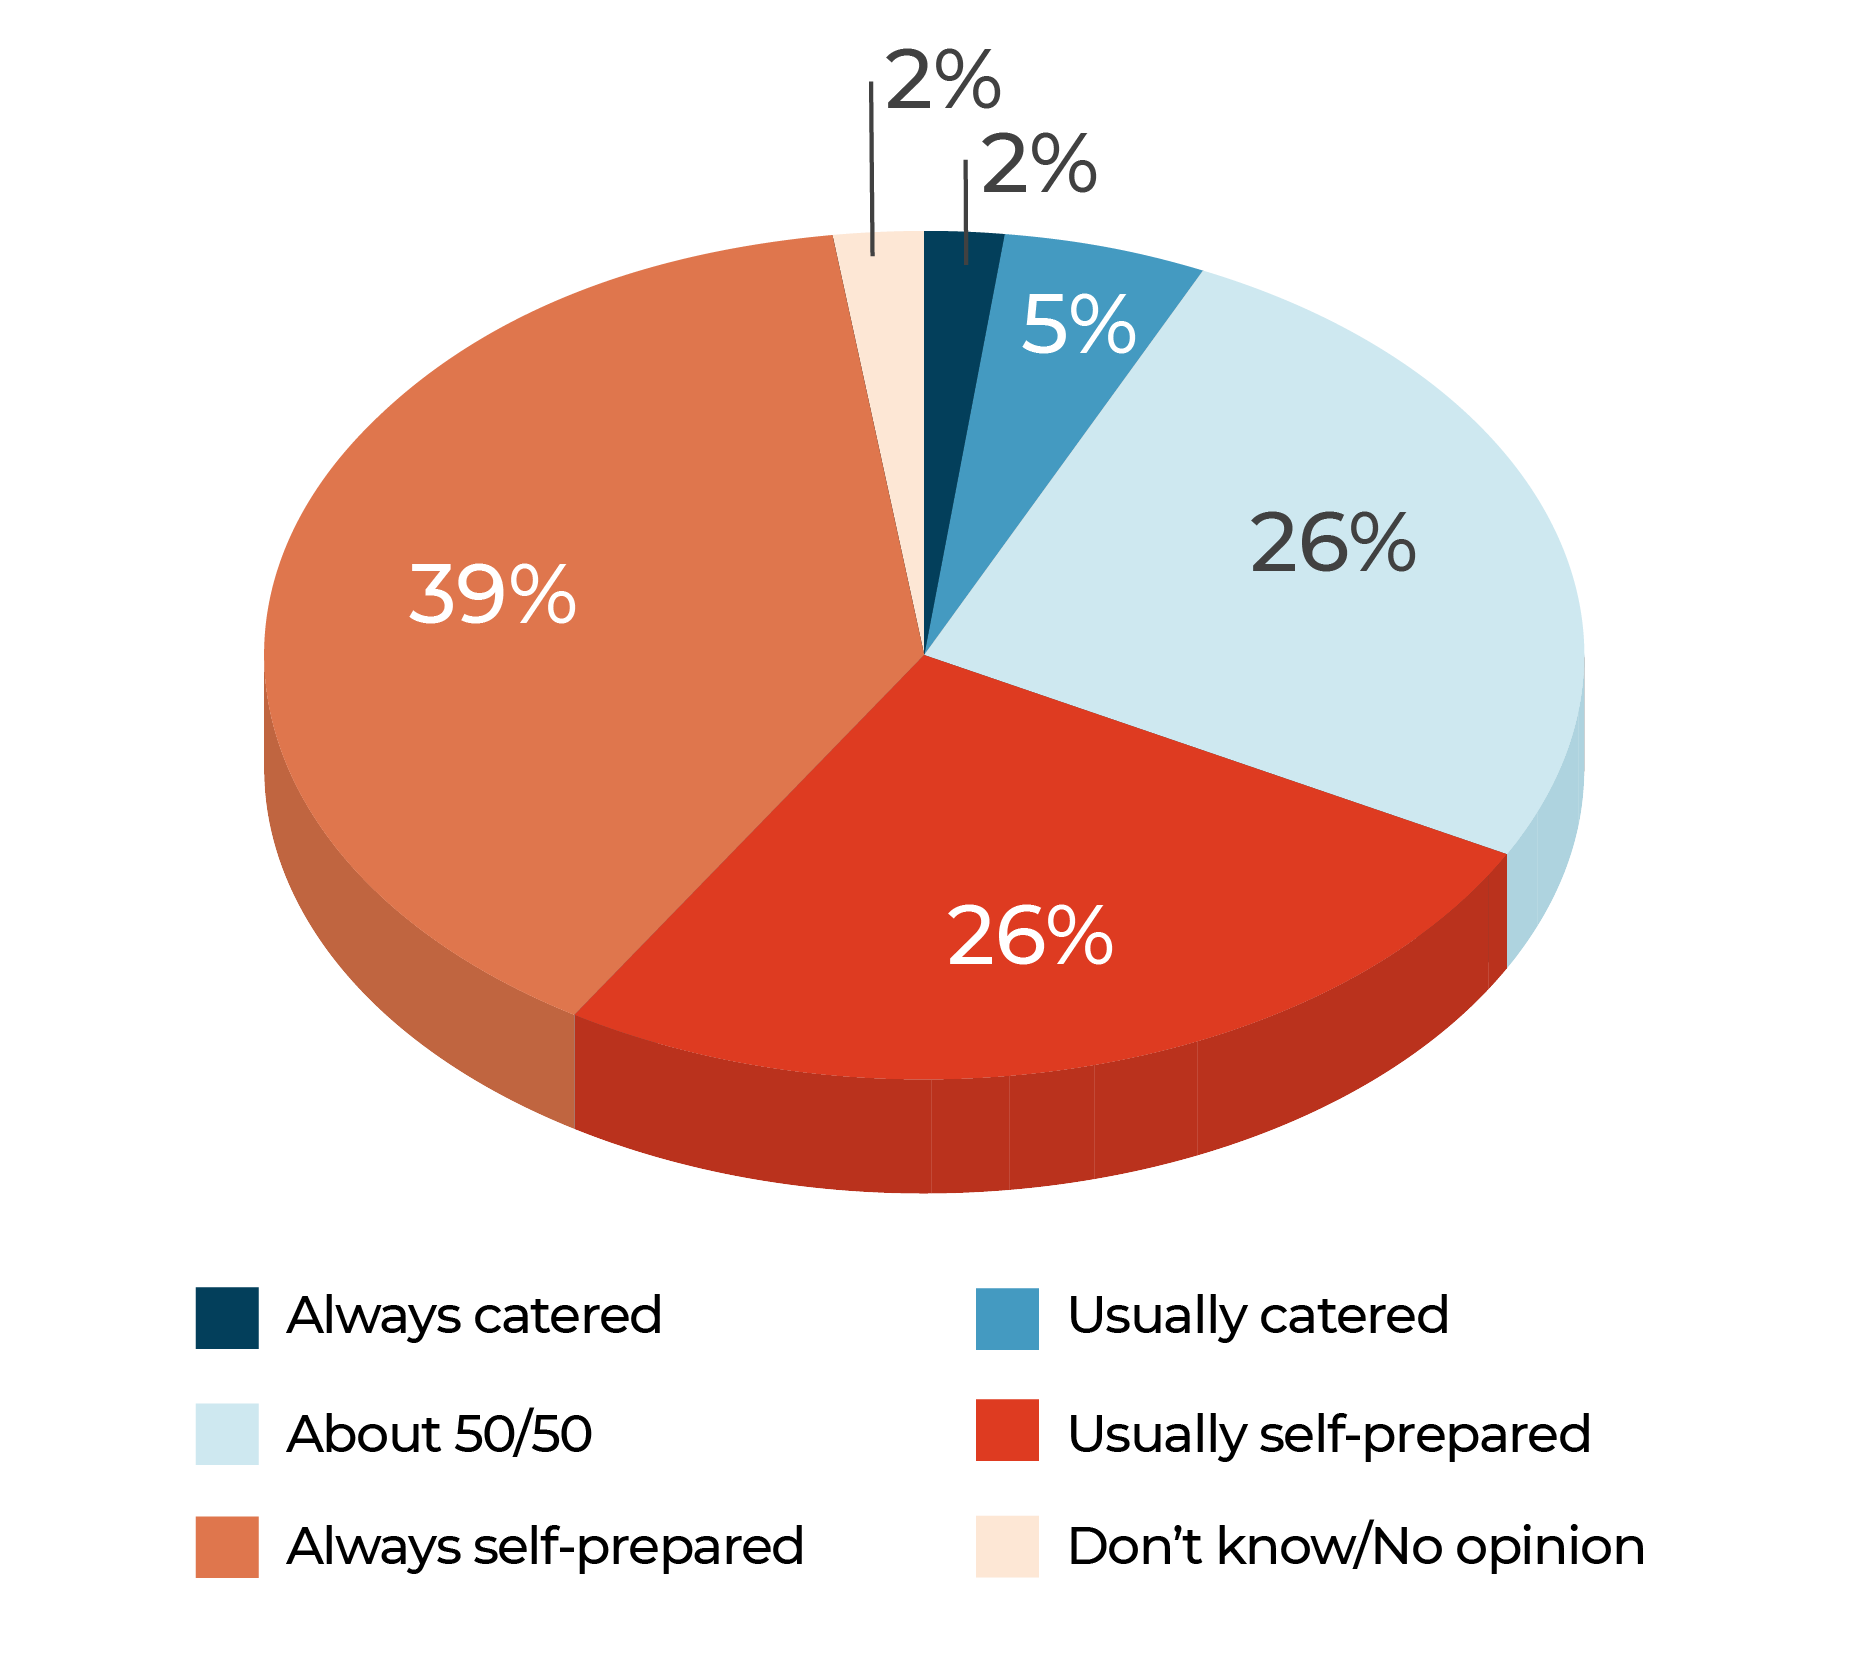
Only 2% of survey respondents said they always have events catered and just 5% usually do so, with 26% saying they split between bringing refreshments in for events and making them at home. At 10%, men are more likely to usually or always favor catered affairs versus 5% of women. Although it may seem counterintuitive, consumers earning less than $50,000 a year are most likely to have events catered at least half the time, at 36% at least splitting between refreshments contracted and made at home. Consumers making between $50,000 and $100,000 follow at 33% and the most affluent trail at 27%.
Not all food coming into a home for a gathering is professionally prepared. A lot of gatherings feature food and drink contributions by guests. More than any other party food category, respondents said guests provide desserts at their gatherings half the time or all the time at 57%, followed by side dishes at 52% and appetizers at 44%. Alcohol comes with guests 11% of the time and is divided between host and invitees 39% of the time.
Most demographics are within a few points of each other regarding who provides the refreshments, indicating that attitudes about provisions for gatherings are pretty universal among U.S. consumers. The oldest survey respondents constituted an exception, as those 65 or older are considerably less likely to expect guests to bring refreshments.
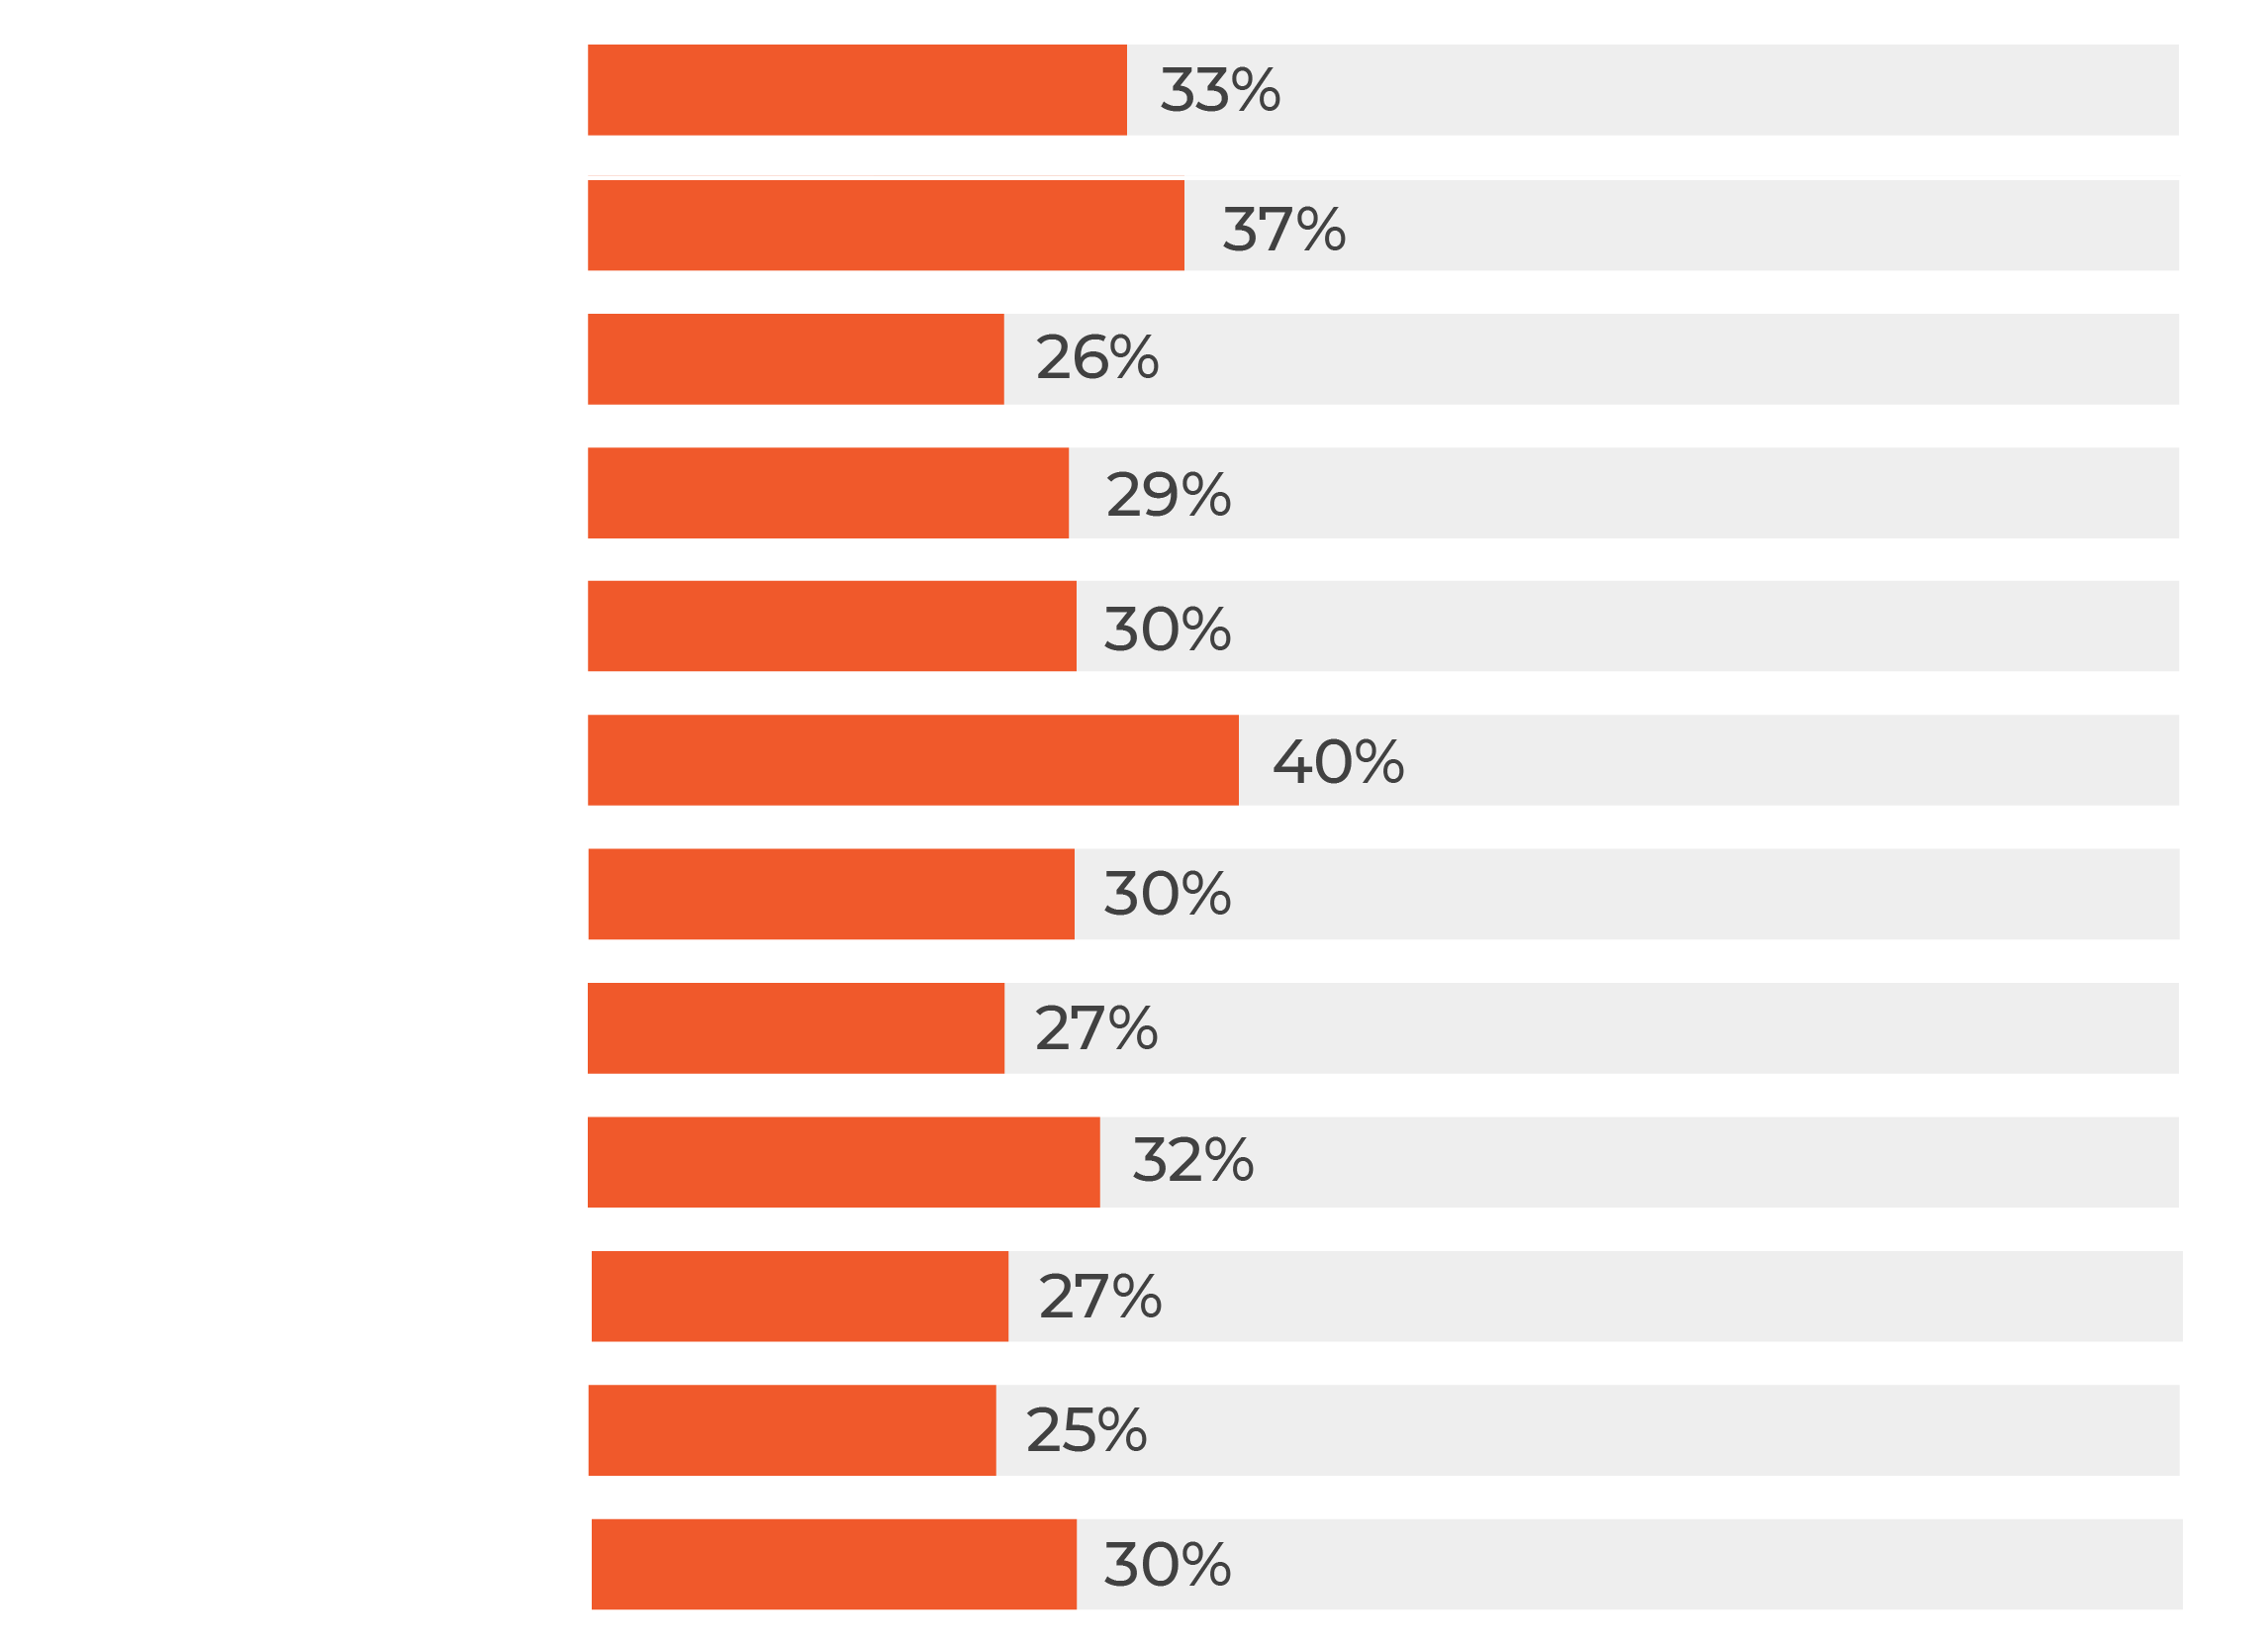
How often, if ever, do you feel the need to buy the following in preparation for a gathering at home? (Chart reflects the percentage of recipients who answered “always” or “usually.”)
Only 7% of survey respondents said they always or usually have events catered.
In the past 12 months, have you hosted casual gatherings that involve eating/drinking at your home?
In the past 12 months, have you hosted occasions-based gatherings at your home that involve eating/drinking?
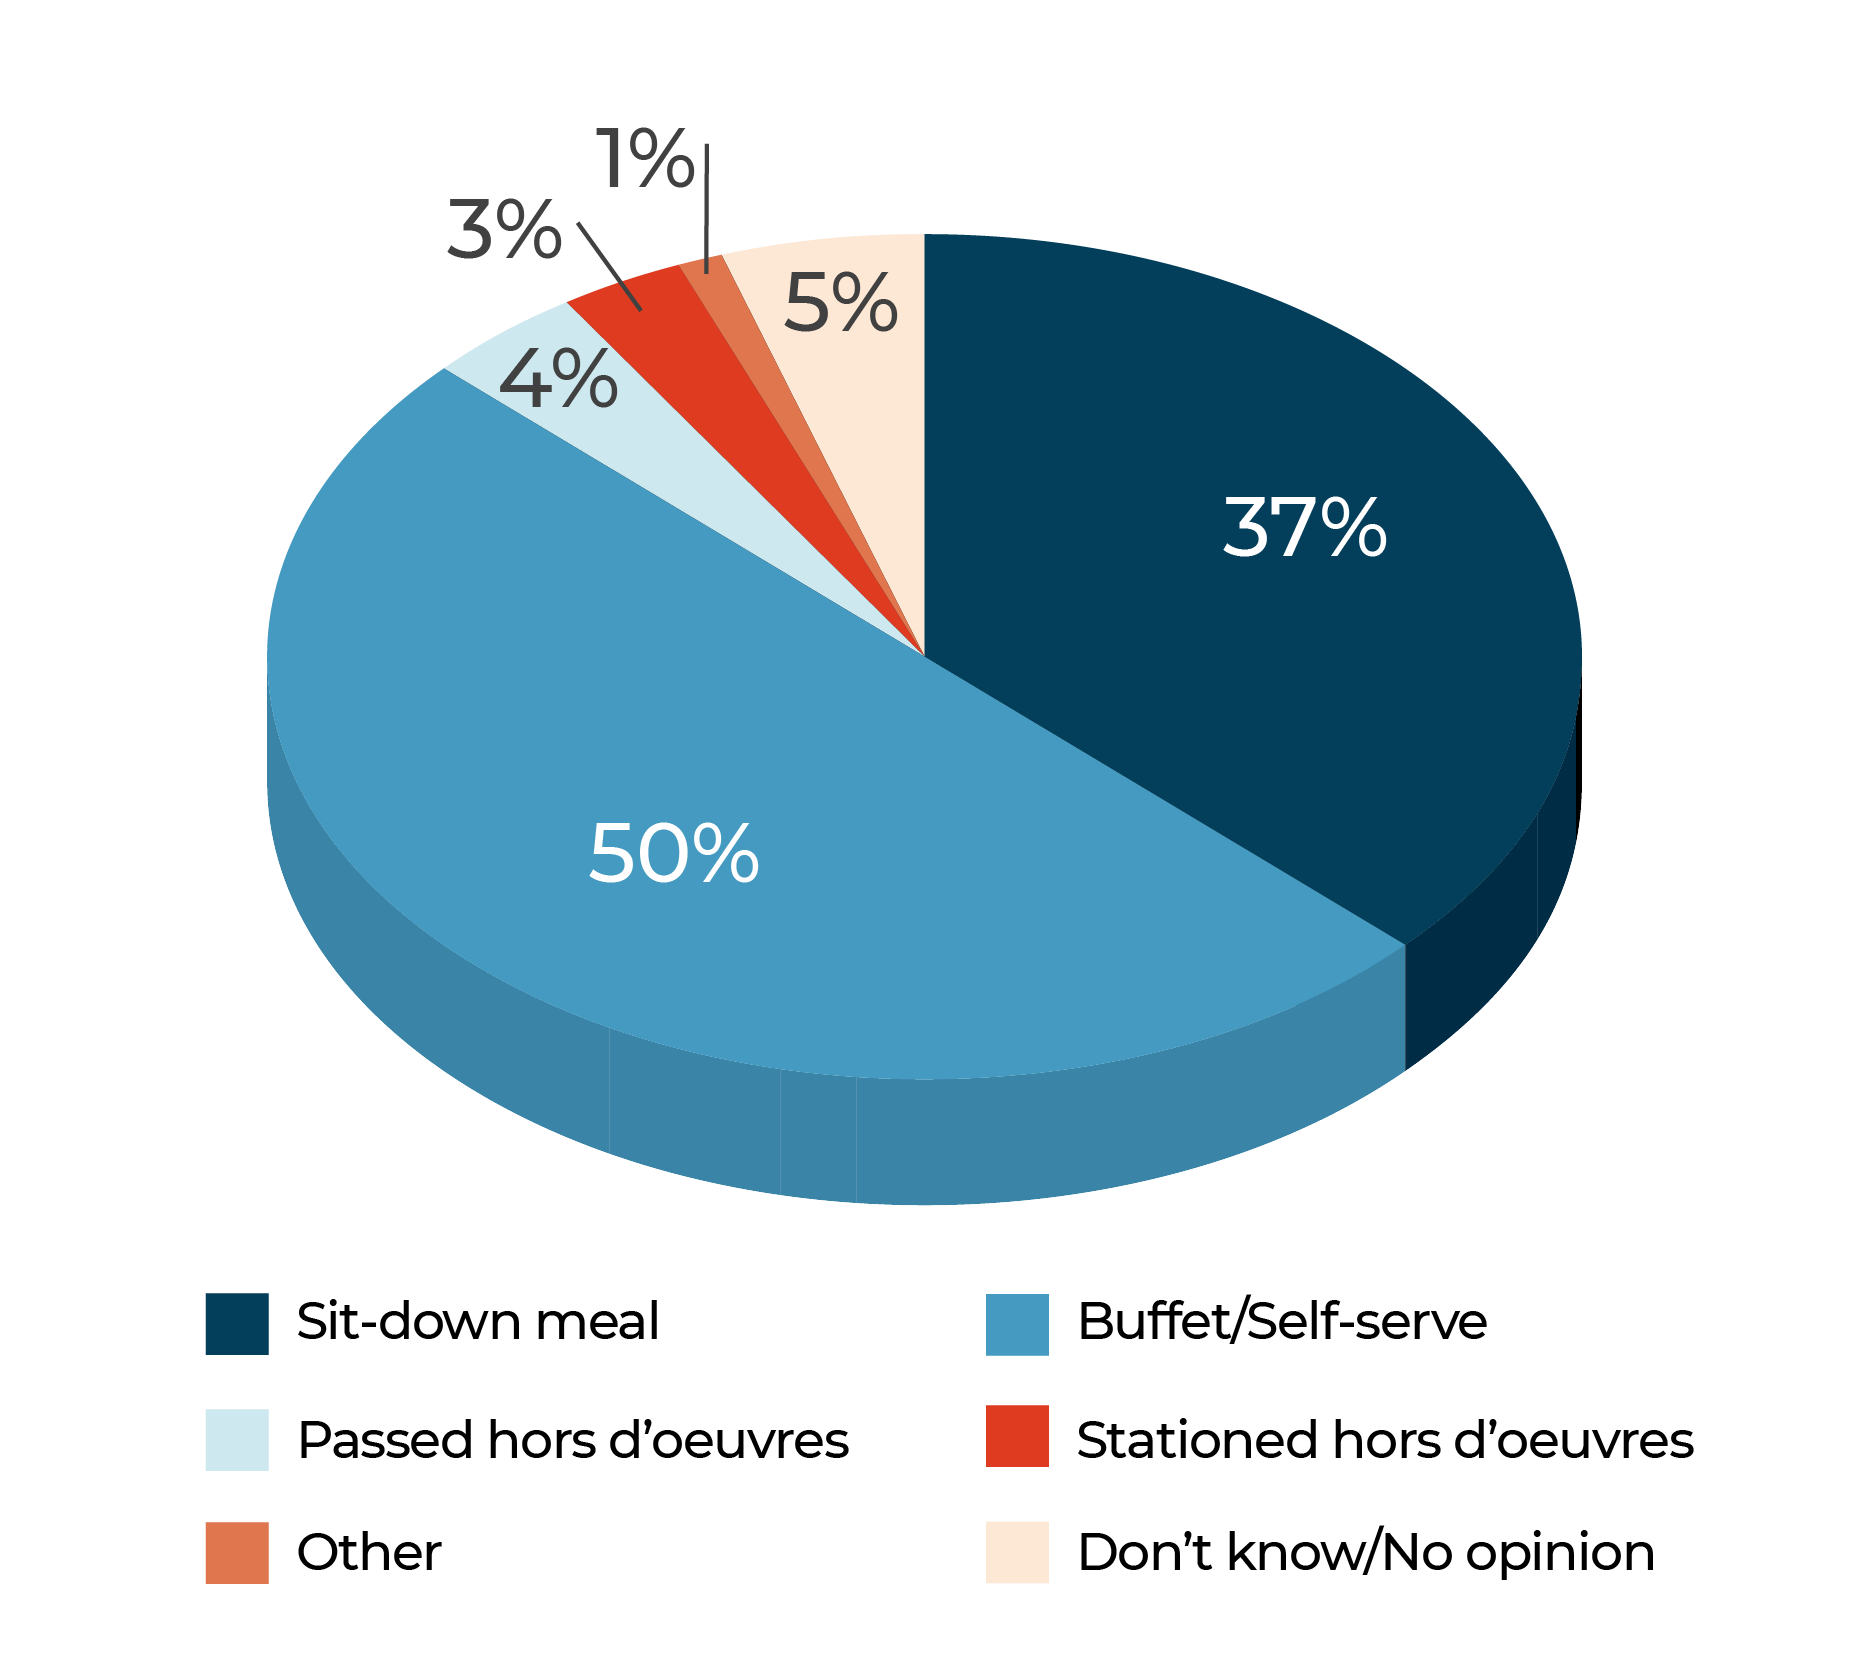
Buffet/self-serve is the most popular gathering style when serving food at 50% with sit-down meals following at 37%.
Buffet/self-serve is the most popular gathering style when serving food at 50% and sit-down meals at 37%. Hors d’oeuvres, whether passed or presented at stations, did not even crack 5% of responses in either case.
Even for those most inclined to consider them, hors d’oeuvre-style gatherings aren’t at the top of the minds of survey respondents. Interest in them only reaches or surpasses 10% in four demographic groups among the categories taken into consideration: consumers with post-graduate educations at 10%, those from households earning more than $100,000 annually at 11%, and those aged 35-44 tied with urban residents at 12%. Although relatively fond of hors d’oeuvre-based gatherings, respondents 35-44 still were most likely to prefer buffet/self-serve meals among the age brackets at 59%.
Self-service, whether from a common source, such as a refrigerator, cooler or from a bar, was by far the most popular choice when it comes to drink distribution, at 71% combined.
Which of the following formats do you use most often for gatherings you host at your house?
Younger consumers, 18-34 and 35-44, were most likely to offer a full bar at 26% each.
Respondents 18-35 were most likely to have libations passed by hand or mixed by a bartender at a combined 23%, while those 45-64 were least likely at 16%. On the flip side, consumers aged 35-44 were most likely to distribute alcoholic beverages from a common source at 76%.
Thinking about the gatherings you host at your house, do you generally have food catered or do you prepare it?
Consumers who live in households earning more than $100,000 are most inclined among income groups to pass or have mixologists make drinks for their gatherings at 22%, while those earning between $50,000 and $100,000 are most likely to use a common source at 73%.
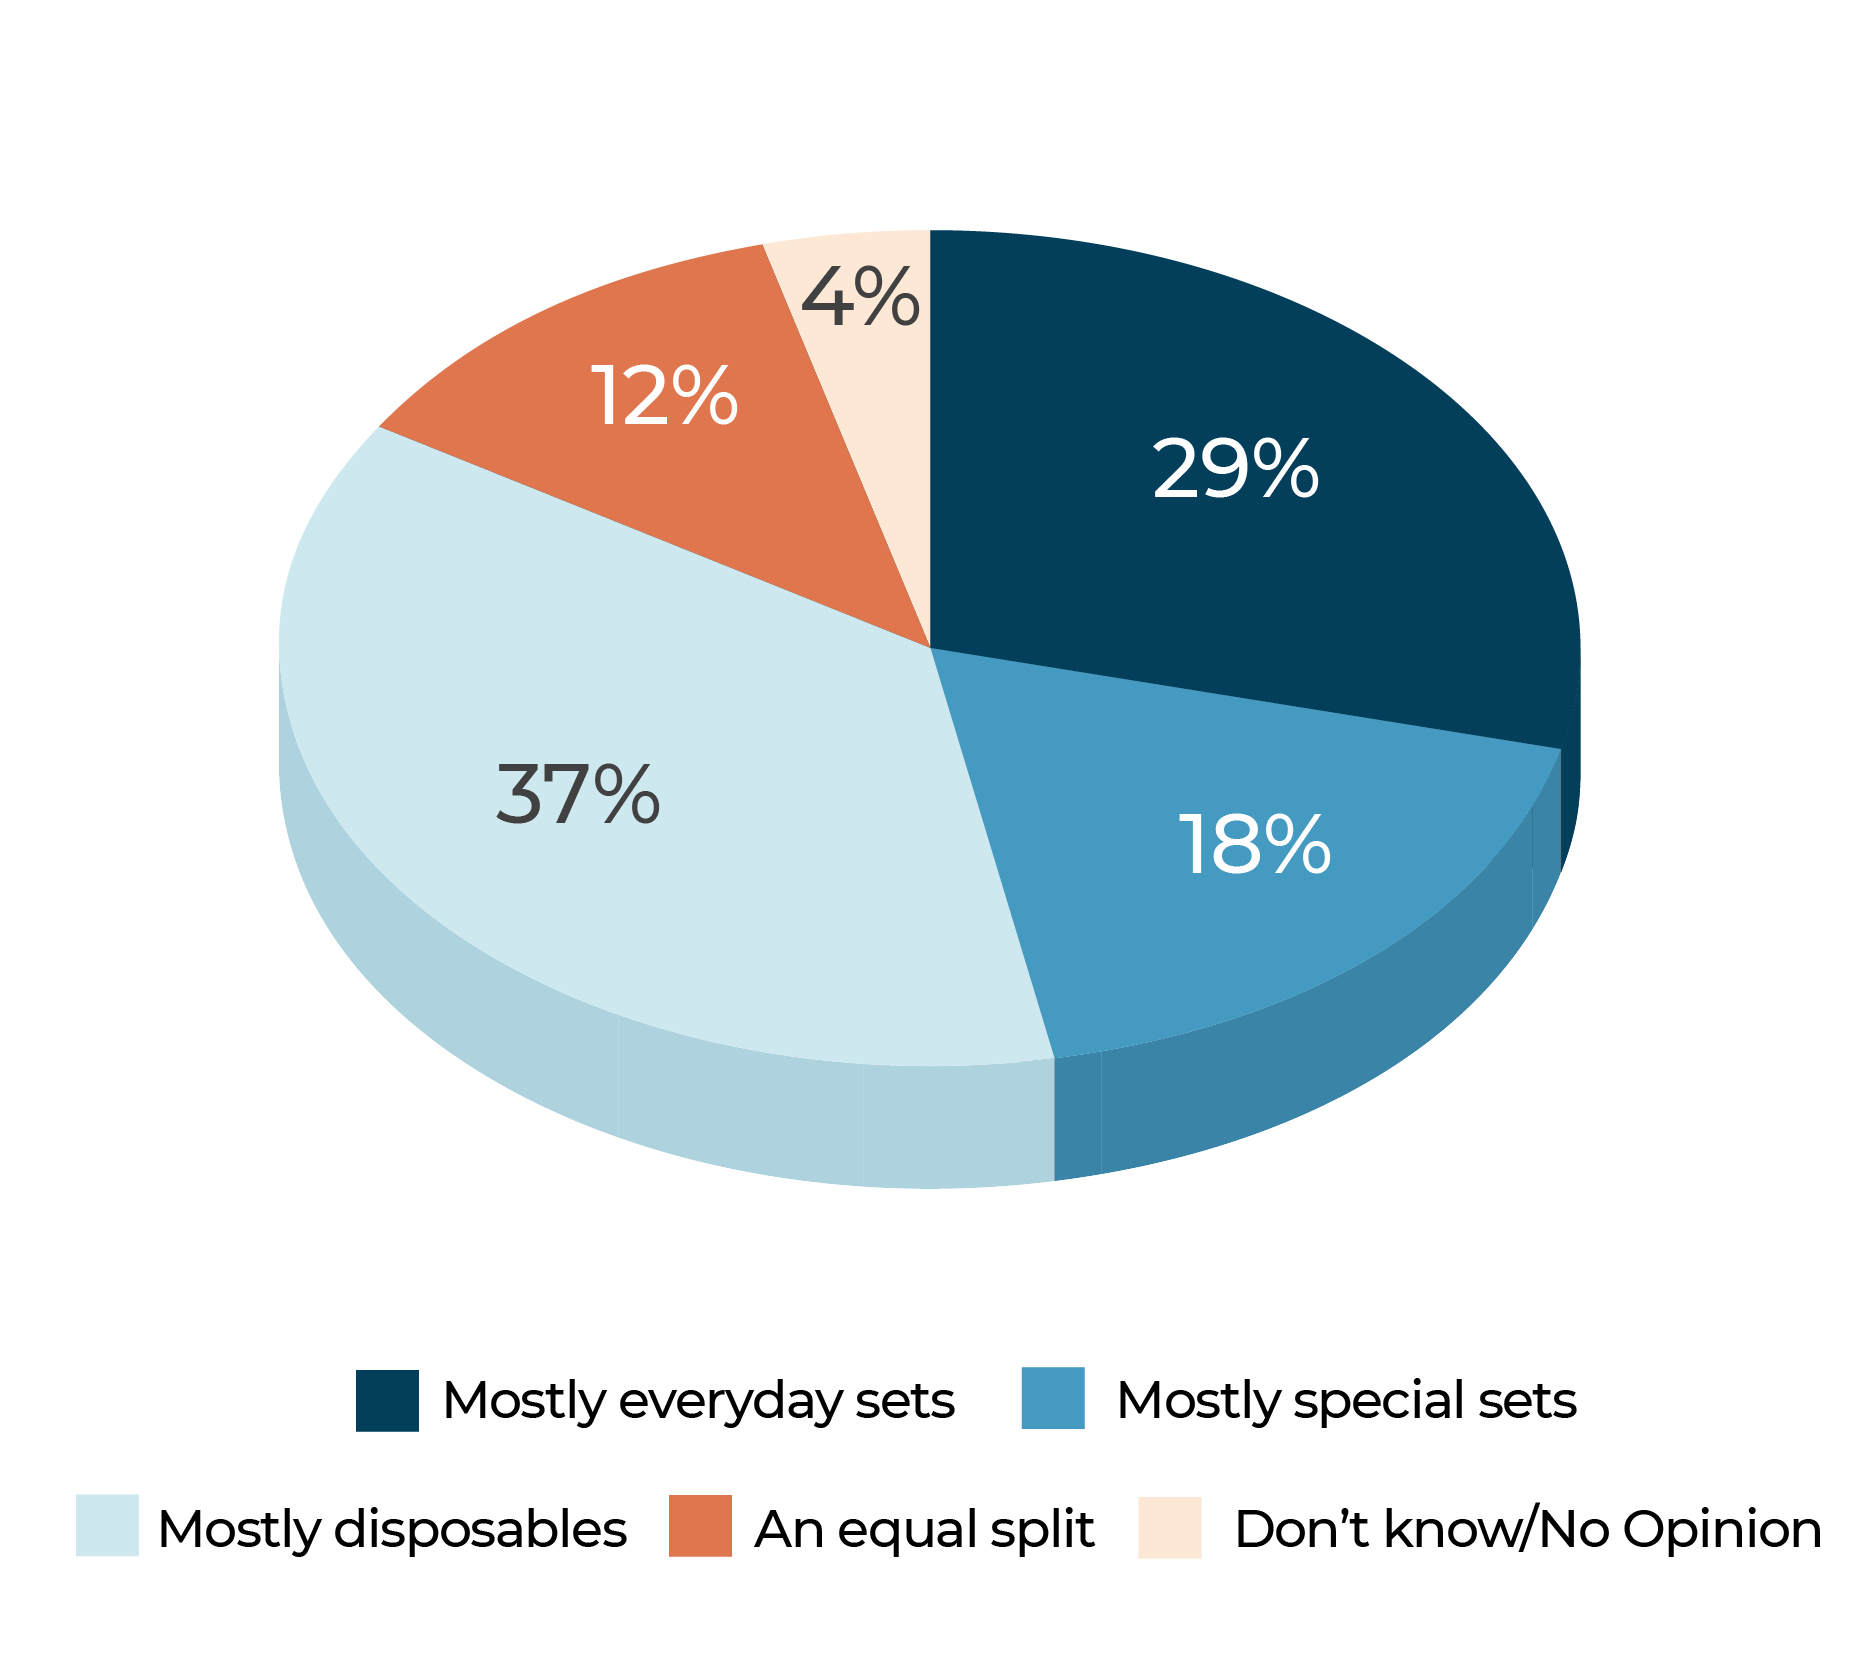
Disposable products are popular among consumers when they host gatherings at 37%, with everyday sets next at 29% and specialty sets employed by 18%. Although some might suspect that women would prove fonder of disposables given that they often take a more significant role in putting the home back together after a gathering, men came in ahead preference-wise by four points.
Consumers from households earning more than $100,000 are, perhaps unsurprisingly, most likely to use specialty sets in their gatherings, while those earning between $50,000 and $100,000 are most likely to use disposables at 42%.
One in five survey respondents said they don’t serve alcohol at their gatherings, but an equal proportion offer a full bar. The top choice among the categories considered is serving beer, wine, and limited spirits at 39%, followed by beer and wine only at 28%. Younger consumers, 18-34-year-olds and those 35-44, were most likely to offer a full bar at 26% each. This may reflect the rise of cocktail culture over the past 20 years and is consistent with the Millennial and Gen Z focus on craftsmanship and authenticity.
Disposable products are popular among consumers when they host gatherings at 37%, with everyday sets next at 29% and specialty sets employed by 18%.
Regarding leftovers, 69% of survey respondents said they occasionally or usually send home food with their guests after gatherings, with 24% saying they always do. Consumers 35-44 are most likely to say they always send food home with guests at 31%. Men are slightly more likely than women to say they occasionally or usually send food home with guests, but, at 27%, women were six points more likely than men to say they always send food home with guests.
The most challenging aspects of gatherings for survey respondents are cleaning up at 34%, preparing everything at the same time at 23% and preparation in general at 13%. Women were much more concerned about preparing everything at the same time, at 30%, than were men, at 17%. Preparation is an issue for the oldest consumers, those 65 and up, as they were most likely, at 16%, to worry about preparation and getting everything done simultaneously, at 35%, compared to other age brackets.
For gatherings you host at your home, do you typically use your everyday housewares for gatherings, special sets or disposables?
When asked how often they purchase certain housewares items for gatherings, 74% of respondents said they at least occasionally have purchased food storage items in association with a home gathering, more than in any other category, with textiles following at 73%, then tableware at 65%, glassware/stemware/drinkware at 64%, serveware at 60% and decor at 59%. On the other hand, the categories where consumers were least likely to purchase products, as in never or occasionally combined, were kitchen electrics at 72%, prep gadgets and accessories at 71%, barware at 70%, cookware at 68%, and bakeware in a tie with cutlery at 67%.
The most challenging aspects of gatherings for survey respondents are cleaning up at 34%, preparing everything at the same time at 23% and preparation in general at 13%.
Methodology
The 2025 IHA At-Home Entertaining Survey was conducted by Morning Consult between September 16 and 18, 2024, among a sample of 2,201 adults. The interviews were conducted online and the data was weighted to approximate a target sample of adults based on age, gender, race, educational attainment, region, gender by age and race by educational attainment. Results from the subset have a margin of error of plus or minus two to three percentage points depending on the audience.

