HomePage News 2023 Consumer Outlook Report
The HomePage News 2023 Consumer Outlook Survey, commissioned in partnership with the International Housewares Association, was fielded recently to help suppliers and retailers pinpoint home and housewares opportunities in the coming year. This exclusive report reveals housewares purchase intent across core categories.
The term uncertainty was closely associated with the year 2022, yet, despite some trepidation, consumers are shopping for housewares and home furnishings to make their domestic environments better places to live and will continue to do so through 2023.
Surging home goods sales during the pandemic, shortages, inflation and recessionary fears have changed how consumers spend money, but that doesn’t mean they’ve snapped shut their purses. Rather, consumers responding to the HomePage News 2023 Consumer Outlook Survey had a continuing interest in spending on their homes, though not at quite the same level as last year. That being said, survey results showed spending decreases year over year were generally rather small. Even with the economic circumstances, and the end of stimulus payments issued by the United States Treasury, no great pullback is evident. A switch to travel and restaurant spending was supposed to siphon off dollars that had been spent on houseware and home furnishings. However, now, with shoppers facing inflation and recessionary worries, some market research has emerged suggesting that consumers who had begun to shift spending to service sectors were reconsidering and even scaling back spending plans in those sectors. Although it’s yet to be seen, consumers faced with a worrisome economy may repeat the behavior they demonstrated in the Great Recession and find more ways to enjoy their households.
Institutional changes wrought or accelerated by the COVID-19 pandemic may provide more encouragement for those inclined to stay at home. Everything from the growth of streaming services to the expansion of delivery and pickup amenities to the reconfiguration of homes to house more professional and leisure activities suggest it won’t take much for a significant number of consumers to settle right back in until the latest storm passes over. Indeed, because concerns about the pandemic have waned, the capabilities consumers have added to their homes for both labor and leisure ventures may reinforce the household as the first choice when it comes to planning activities. People can, after all, get together just as easily at a dinner party or barbecue as they can at a restaurant or resort, and they may do so more happily if they are spending less money as they isolate cash reserves just in case the economy takes a steep downturn.
This year’s survey also included data on primary household purchasers. In every survey category, when asked if they were likely to purchase a housewares product in the year ahead, the very likely to purchase answer was higher from the primary purchaser group than it was from the all-adults group and by as much as five points. The somewhat likely answer was much tighter between the primary purchaser and all adults. The readiness to spend is particularly strong among consumers who would be the go-to person for a housewares or home goods purchase.
The second annual HomePage News 2023 Consumer Outlook Survey, commissioned in partnership with the International Housewares Association (IHA), provides data that, by design, can help retailers and their suppliers get a sense of where their opportunities lie in 2023 and who may be the most prepared to spend in home merchandise categories.

With detailed charts and exclusive analysis, the comprehensive report throws a spotlight on consumer purchase decision factors affecting 18 key home and housewares categories:
- Bakeware
- Cleaning Tools
- Cookware
- Cutlery
- Dinnerware
- Drinkware
- Flatware
- Floor Care Electrics
- Glassware
- Home Environment
- Kitchen Electrics
- Kitchen Textiles
- Kitchen Tools & Gadgets
- Luggage & Travel Accessories
- Outdoor Living
- Personal Care & Wellness
- Pet Accessories
- Storage & Organization
For each featured category, the survey reveals which housewares products consumers plan to buy; retail channels in which they expect to shop; key product attributes and lifestyle factors expected to influence their purchase choices; and the potential impact of inflation on their purchase decisions.
A competitive business arena complicated both by extraordinary and evolving issues, including the role of e-commerce, needs careful consideration and dedicated data if initiatives to gain market share are to succeed. Even with all the other factors in flux, retailers and vendors in the home goods sector still have to gauge how major demographic groups are thinking about purchasing especially as Baby Boomers move into retirement more quickly, Gen Xers and Millennials mature as parents and grandparents, and Gen Z emerges into full and independent consumer status.
The HomePage News 2023 Consumer Outlook Report provides a detailed guide that home goods retailers and supplies can use to help them plot their course for the coming year. Data that emerges from the study can help set strategic efforts on a firmer footing as retailers and vendors strive to bolster demand, target shoppers most enthusiastic about purchasing, generate consumer satisfaction and gain market share.
The 2023 Consumer Outlook Survey was conducted by Morning Consult between November 21-November 25, 2022 among a sample of 4,000 adults. The interviews were conducted online and the data were weighted to approximate a target sample of adults based on gender, age, race, educational attainment and region. Results from the full survey have a margin of error of plus or minus two percentage points.
The HomePage News 2023 Consumer Outlook Report was written by Contributing Editor Mike Duff, Editor-in-Chief Peter Giannetti and Managing Editor Chandler Harvey.
Bakeware
Bakeware was among the biggest growth segments in housewares during the pandemic as baking emerged as one of the most popular stay-at home personal and family pastimes. The HomePage News 2023 Consumer Outlook Survey indicates baking is continuing as an elevated at-home staple, which will continue to drive new and step-up purchases in the category.
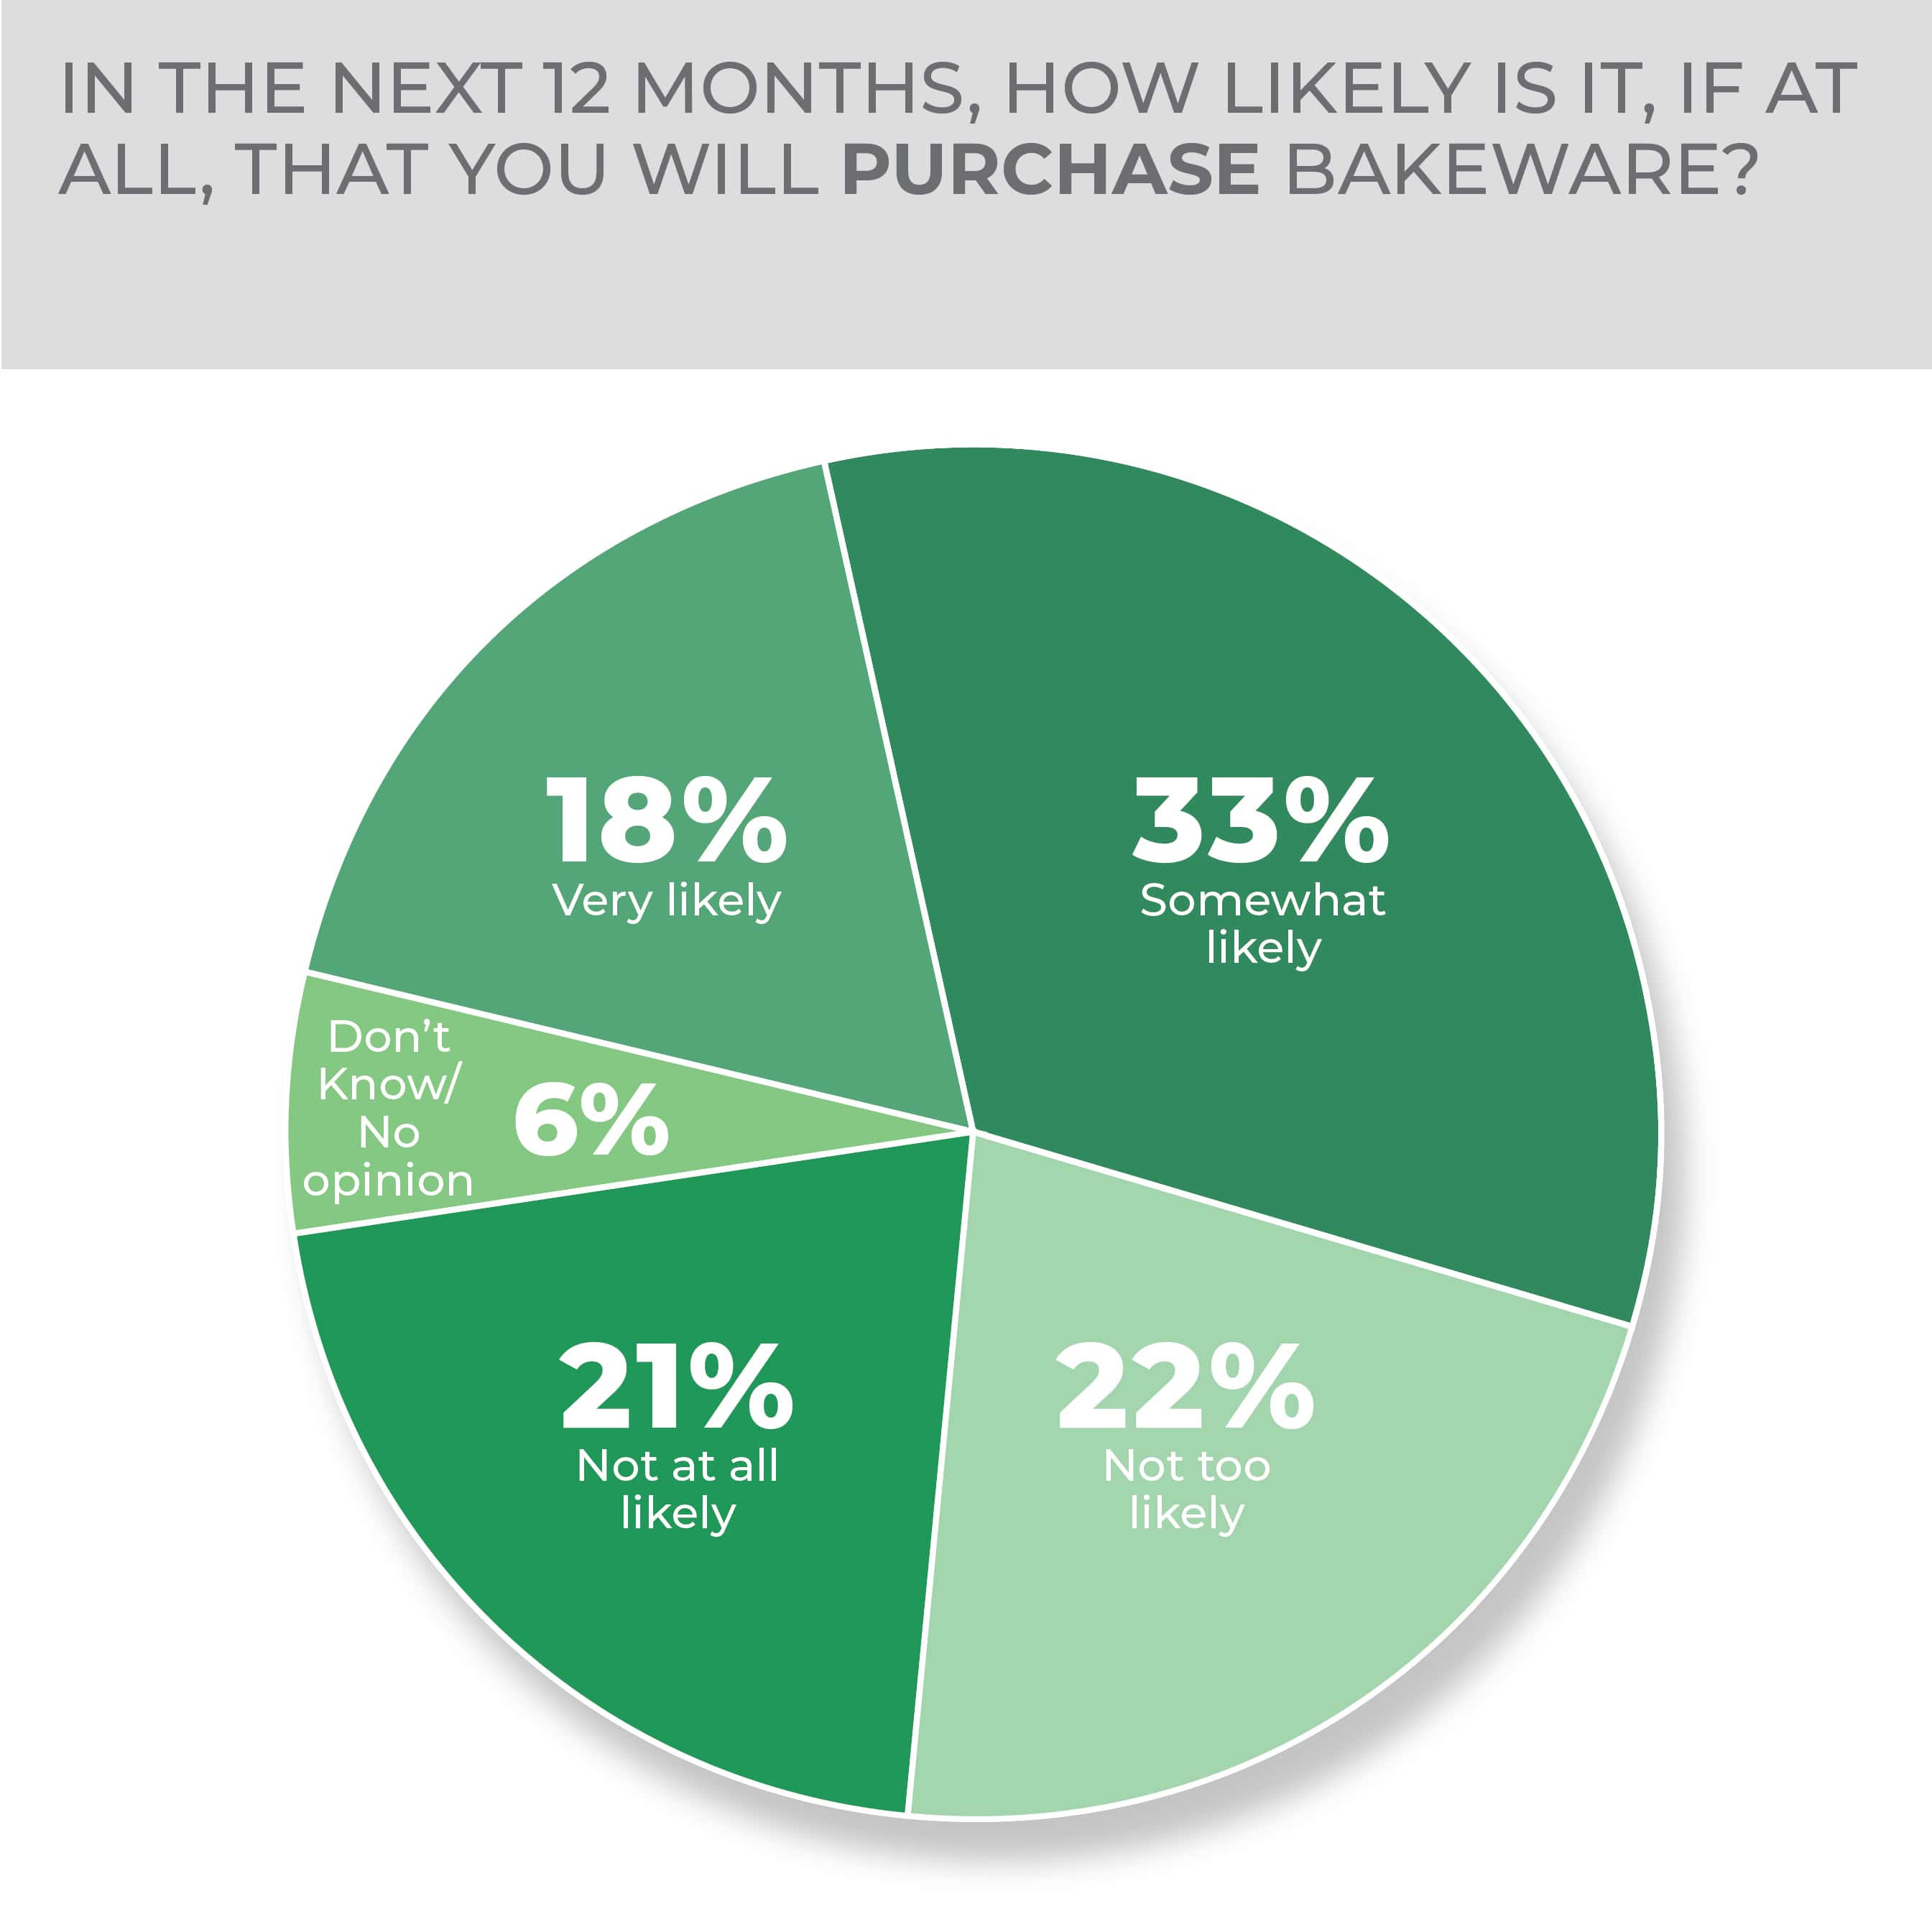
Consumer purchase intent in bakeware stayed generally even across the board when comparing the 2022 survey results to the 2023 results. Bakeware is slightly down year over year with 18% very likely and 33% somewhat likely to make a bakeware purchase compared to last year, when respondents were 21% very likely and 33% somewhat likely.
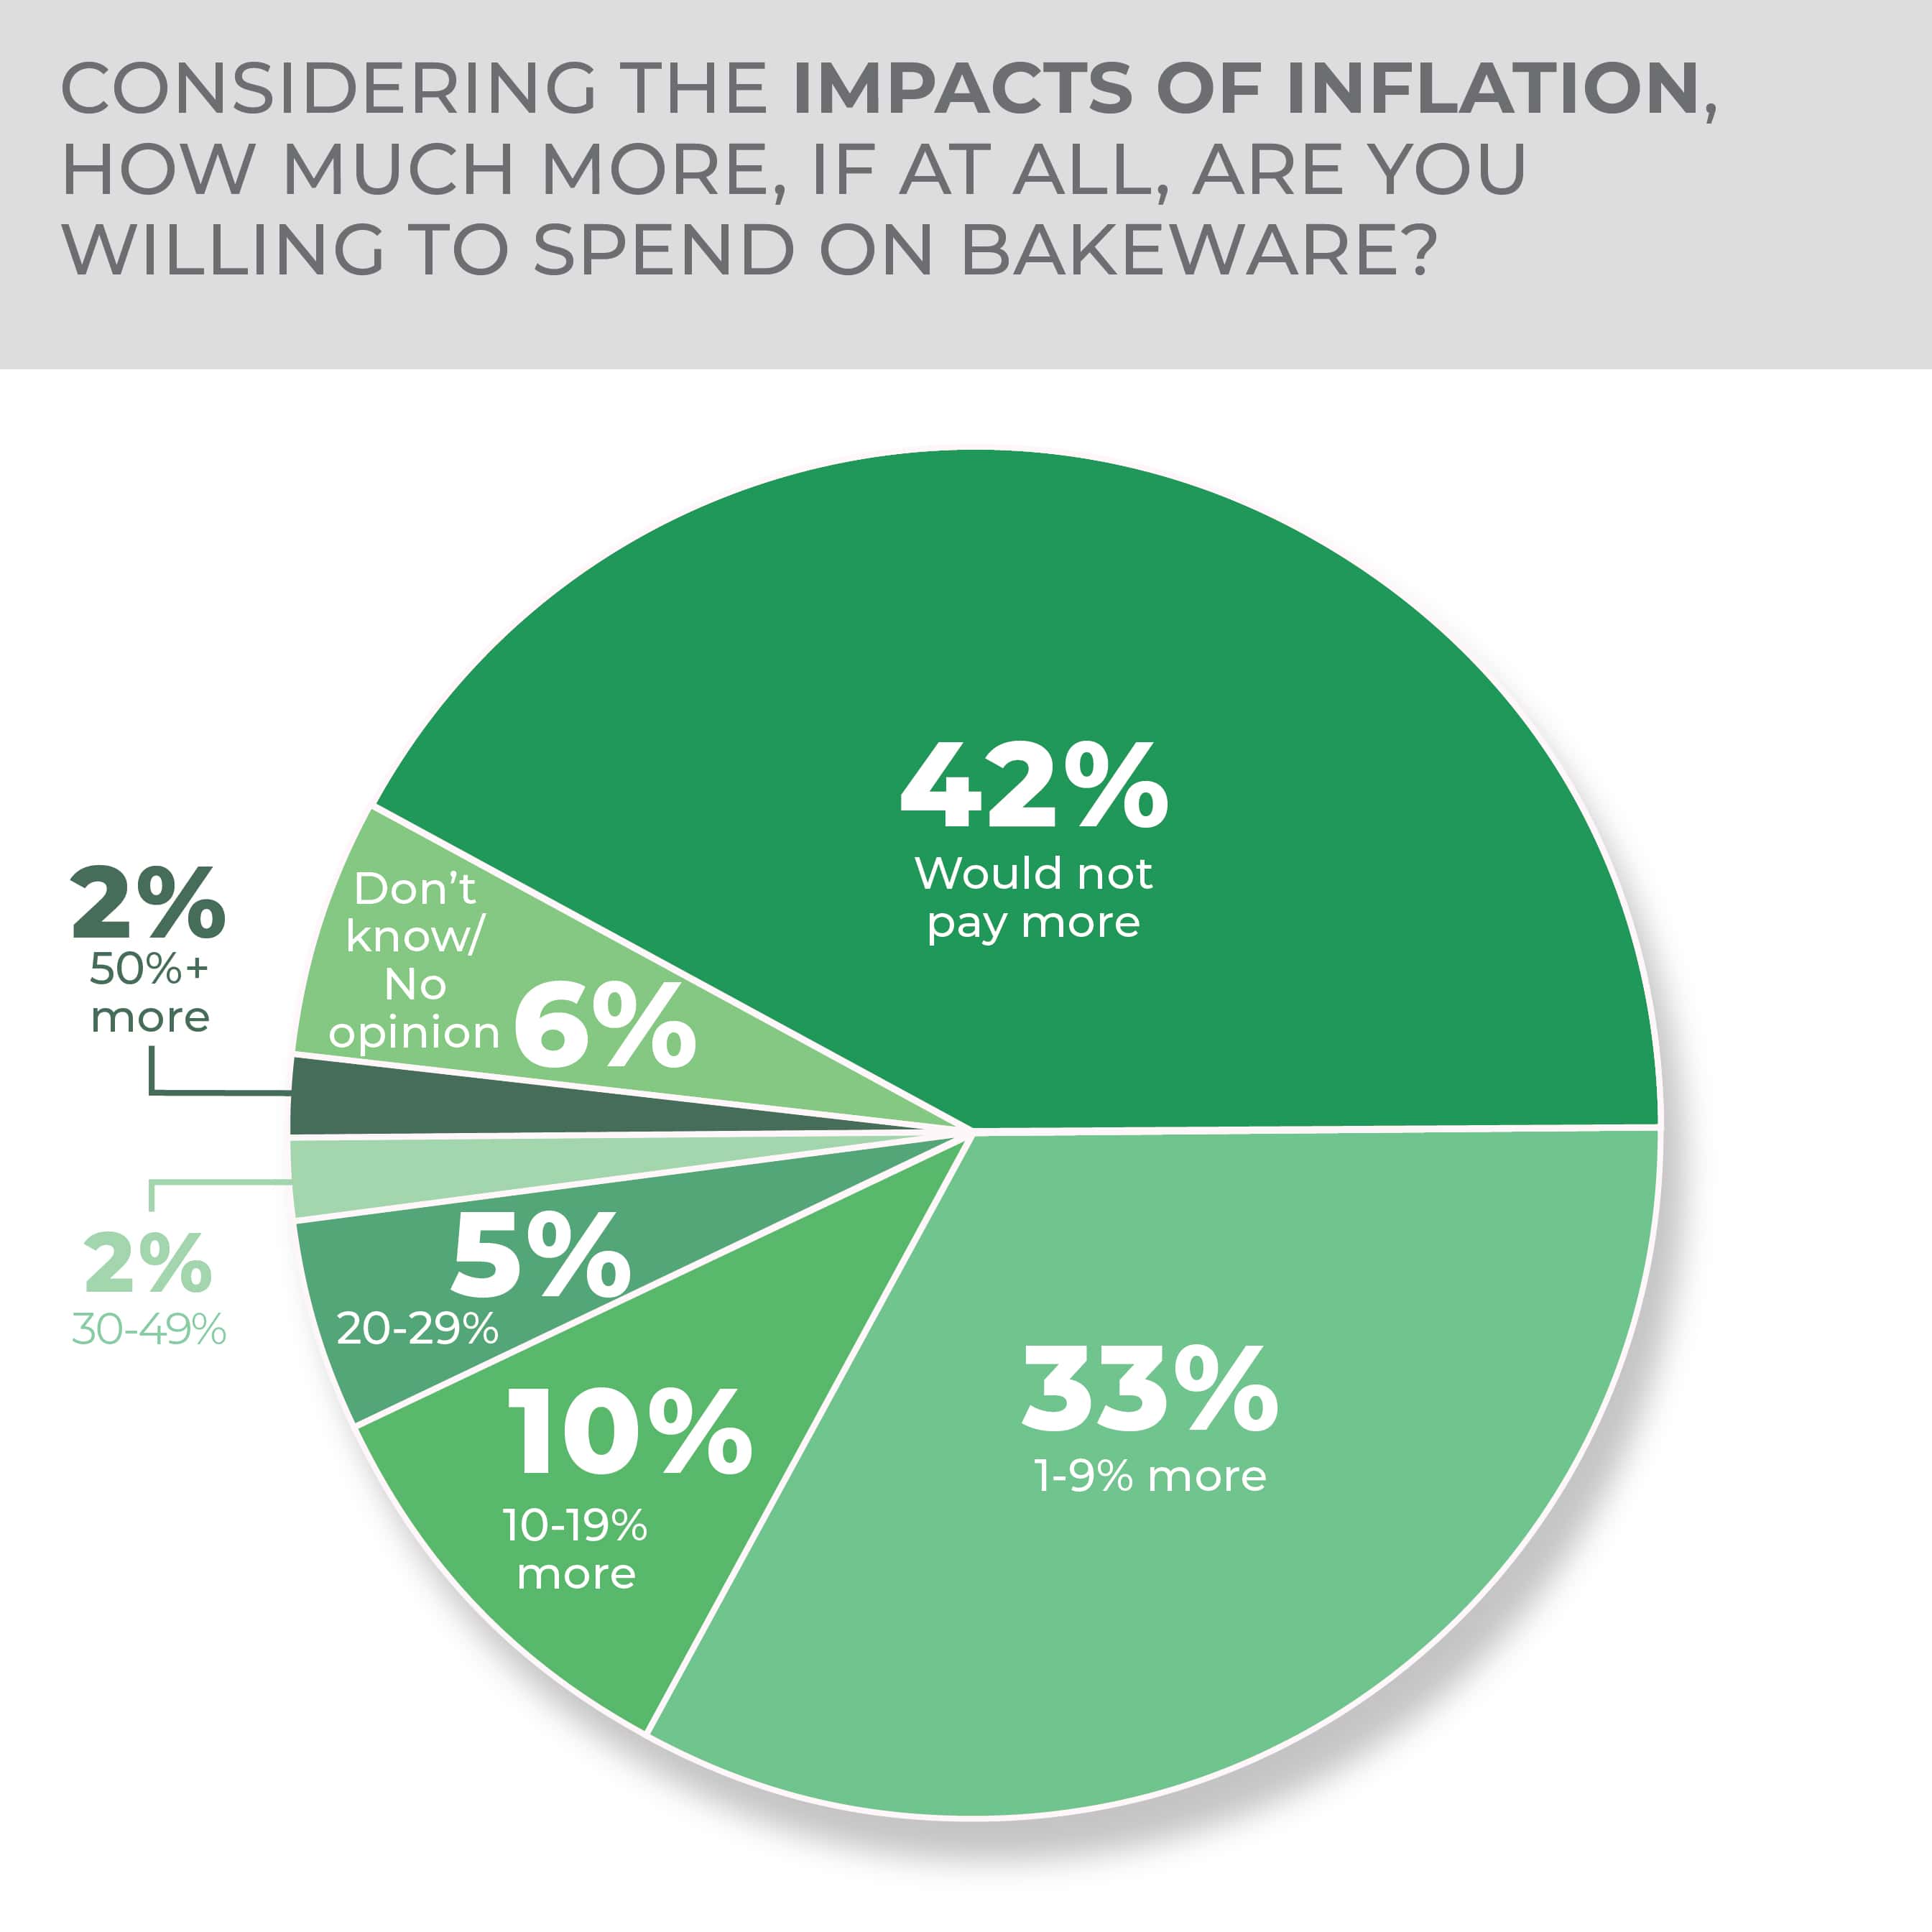
When it comes to inflation, most consumers were not willing to spend more or much more on bakeware products with 42% reporting they would not pay more and 33% saying they would pay 1% to 9% more. Those willing to pay more than that all came in at 10% or less.
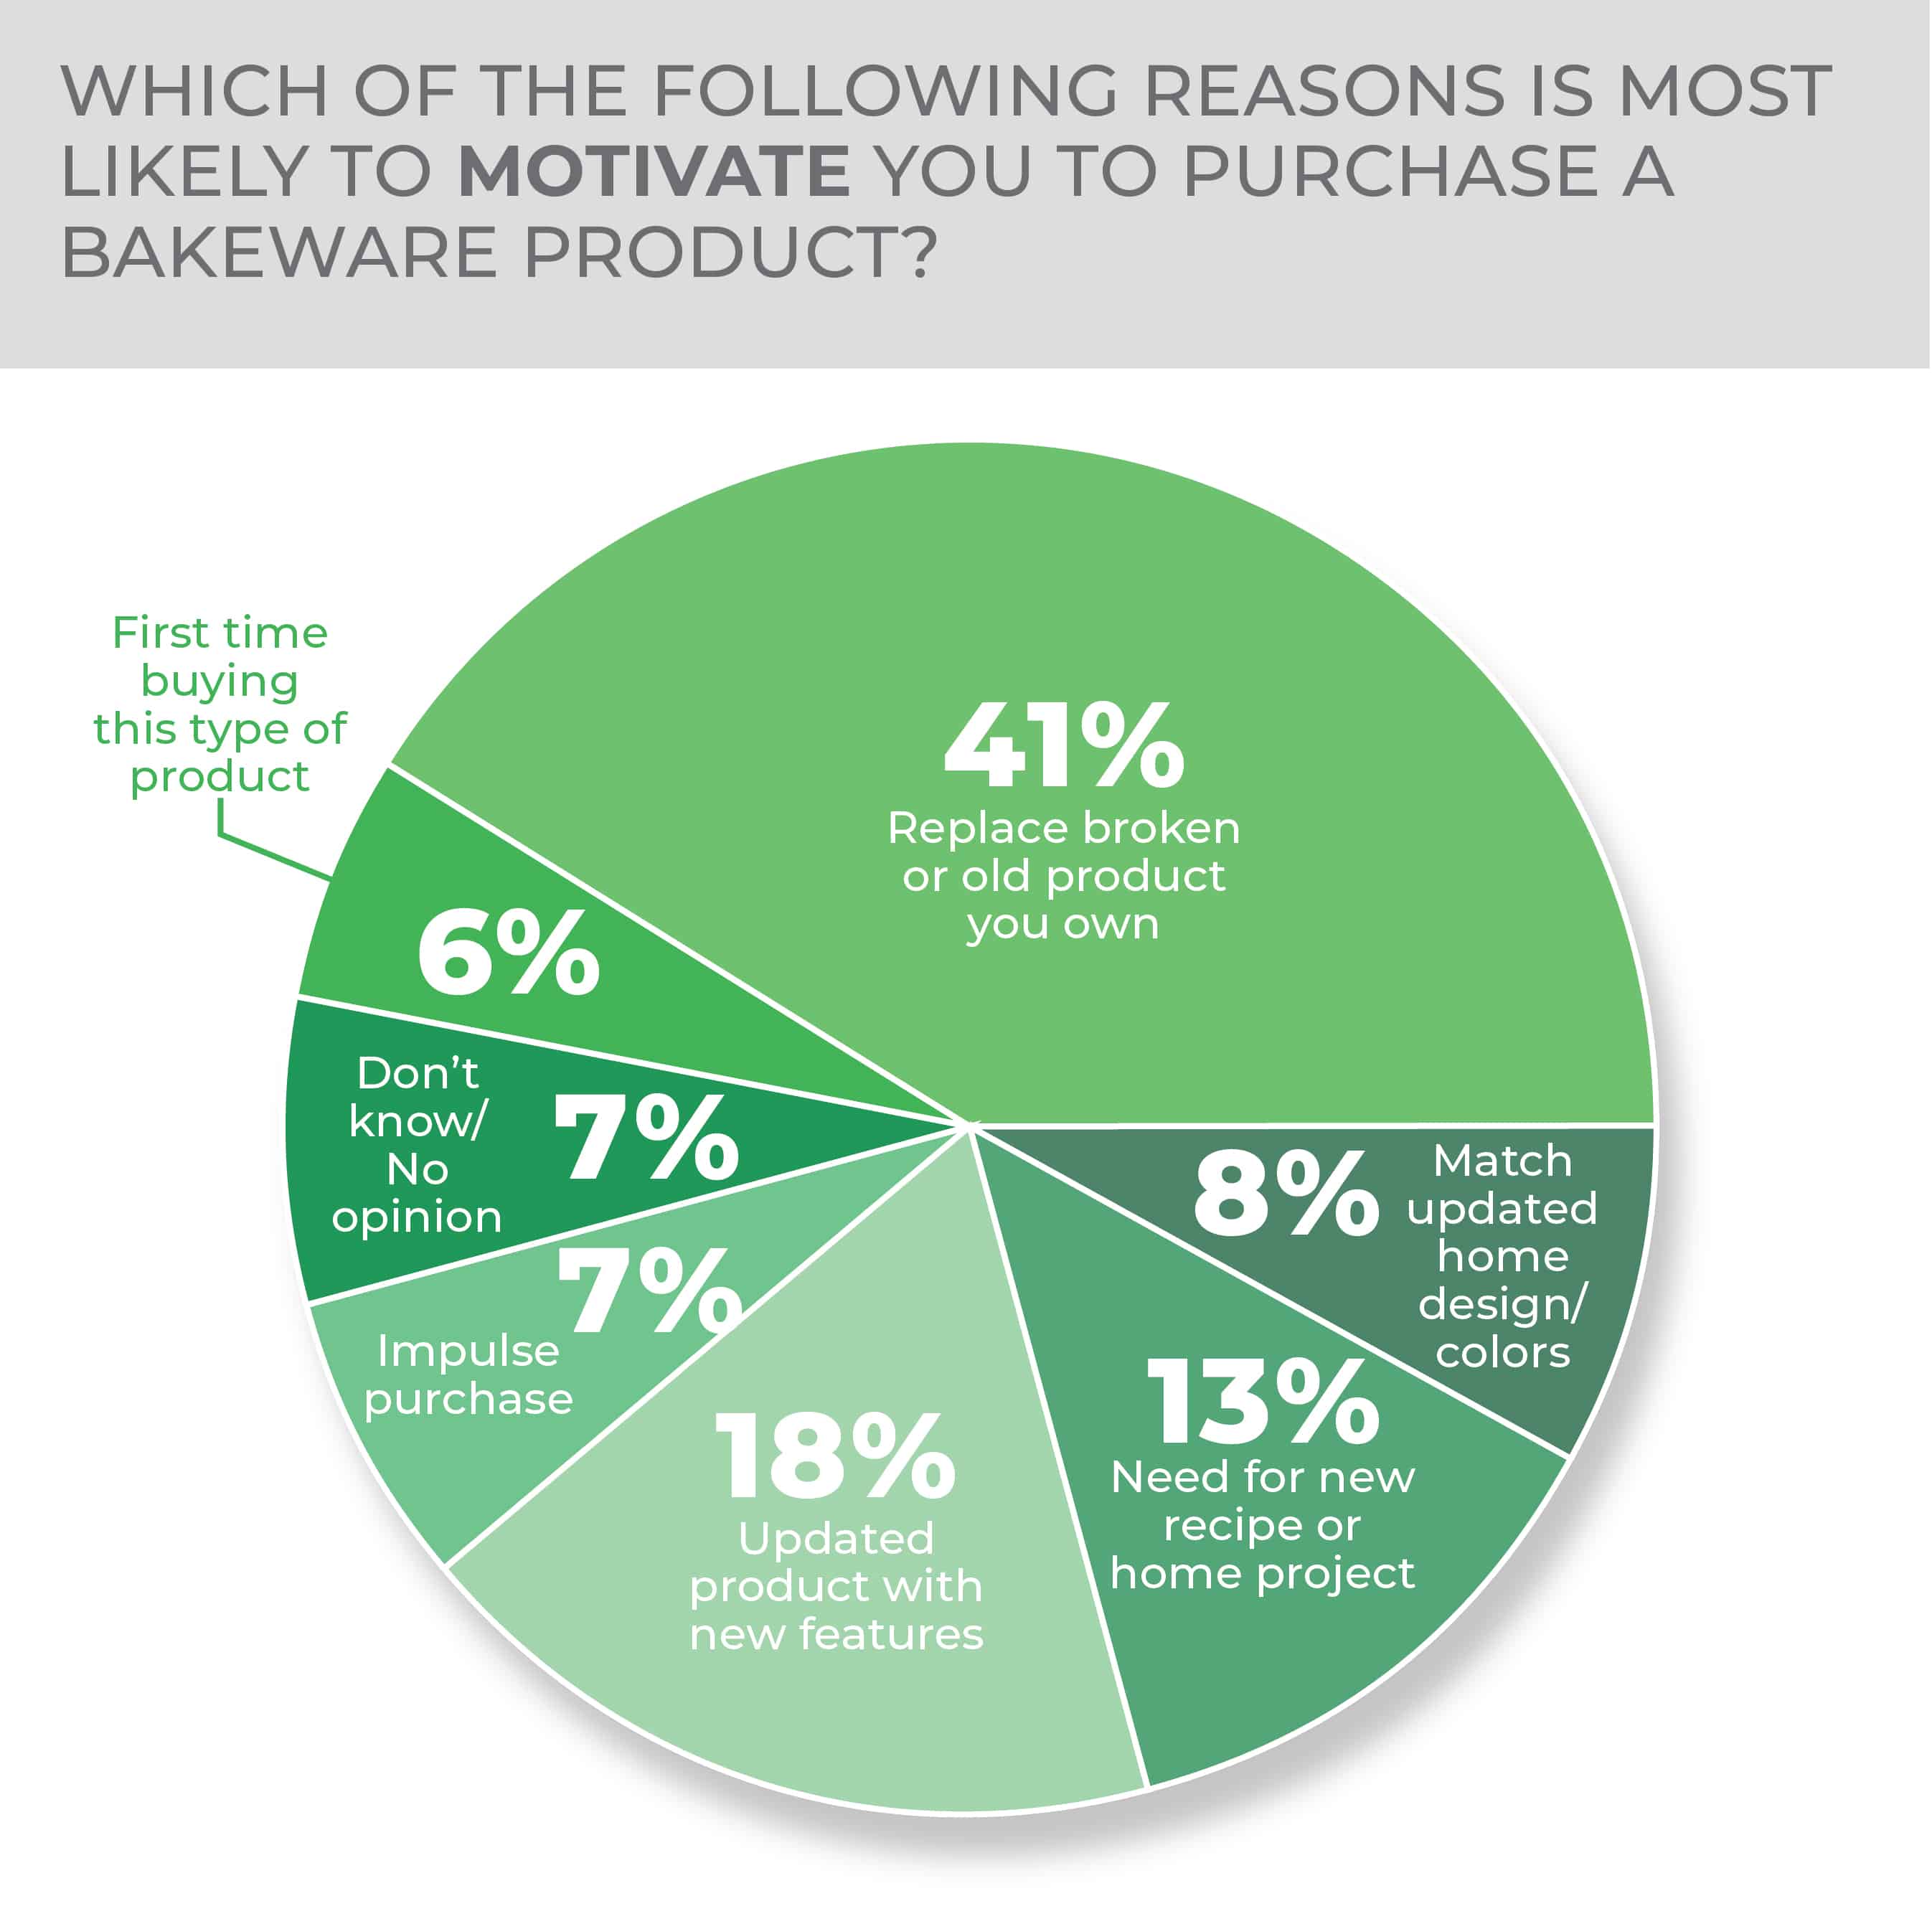
Consumers were most motivated to purchase a bakeware product to replace a broken or old product at 41% followed by wanting to purchase an updated product with new features at 18%, for a new recipe or home project at 13%, to match updated home design or colors at 8%, an impulse purchase at 7% and purchasing a bakeware product for the first time at 6%. Only 7% chose don’t know/no opinion.
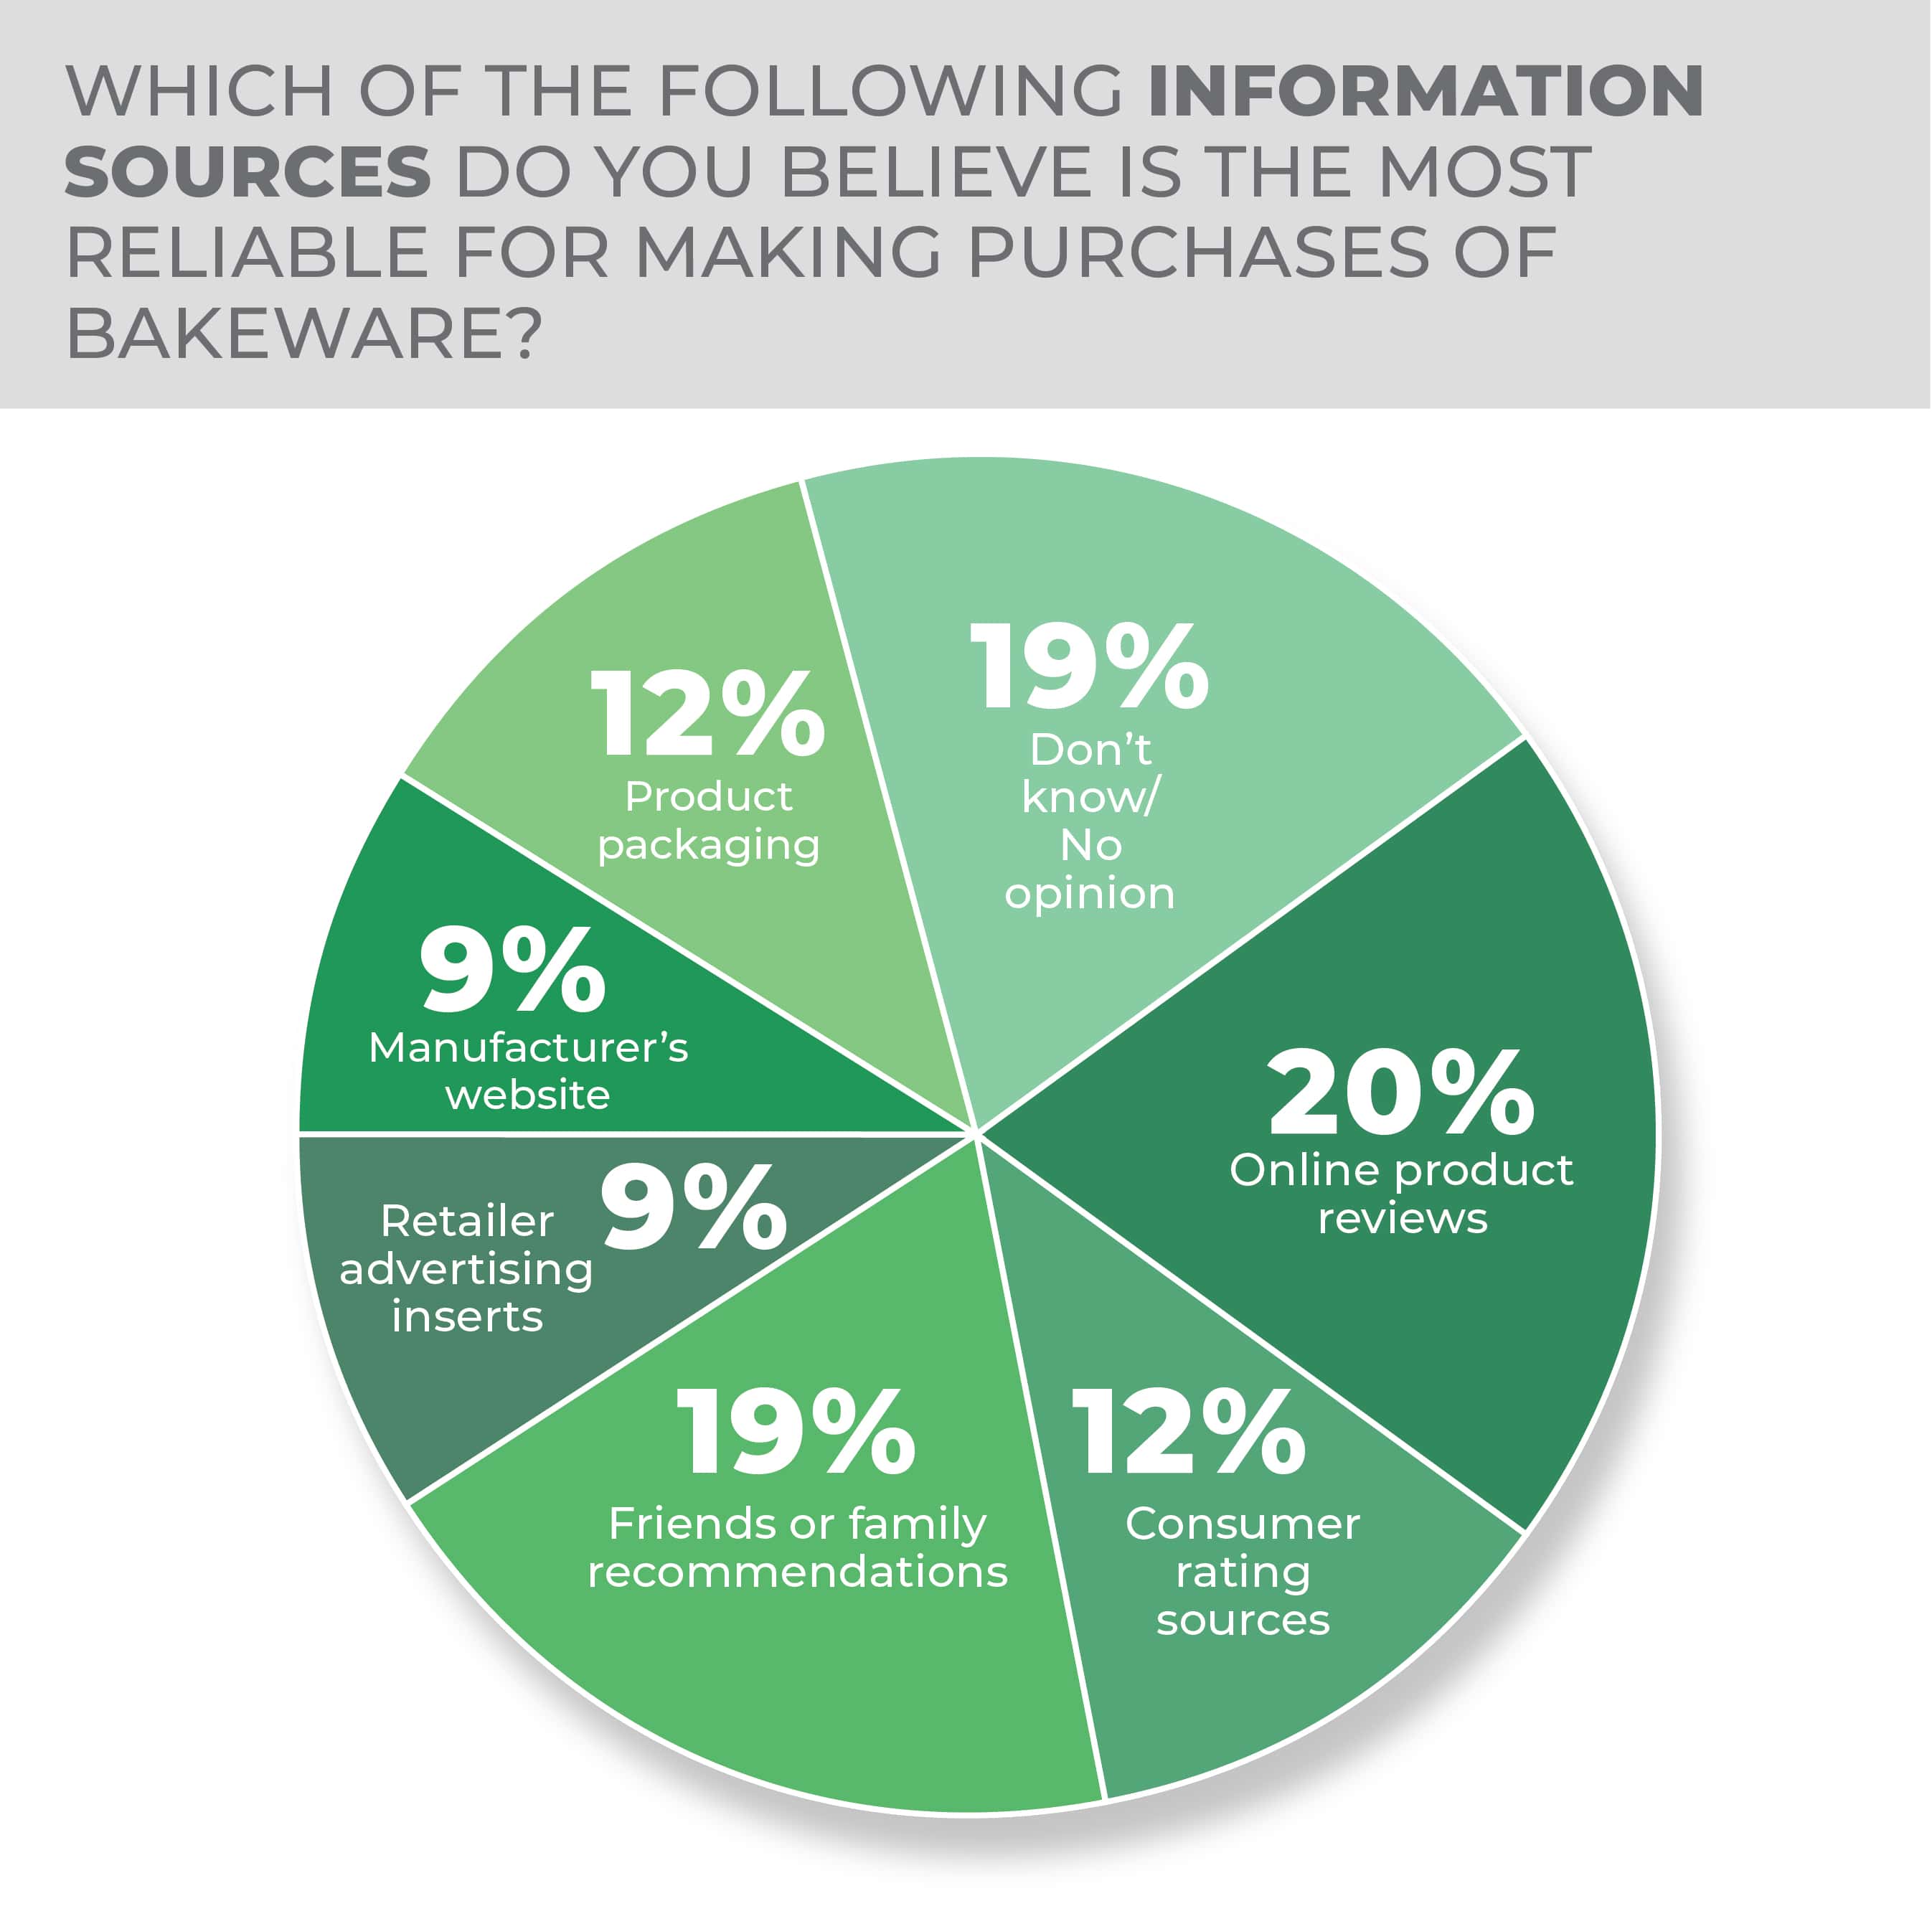
The information source consumers trust the most is online product reviews at 20%, followed closely by friends and family recommendations, and don’t know/no opinion tied at 19%, and another tie at 12% for consumer ratings sources and product packaging.
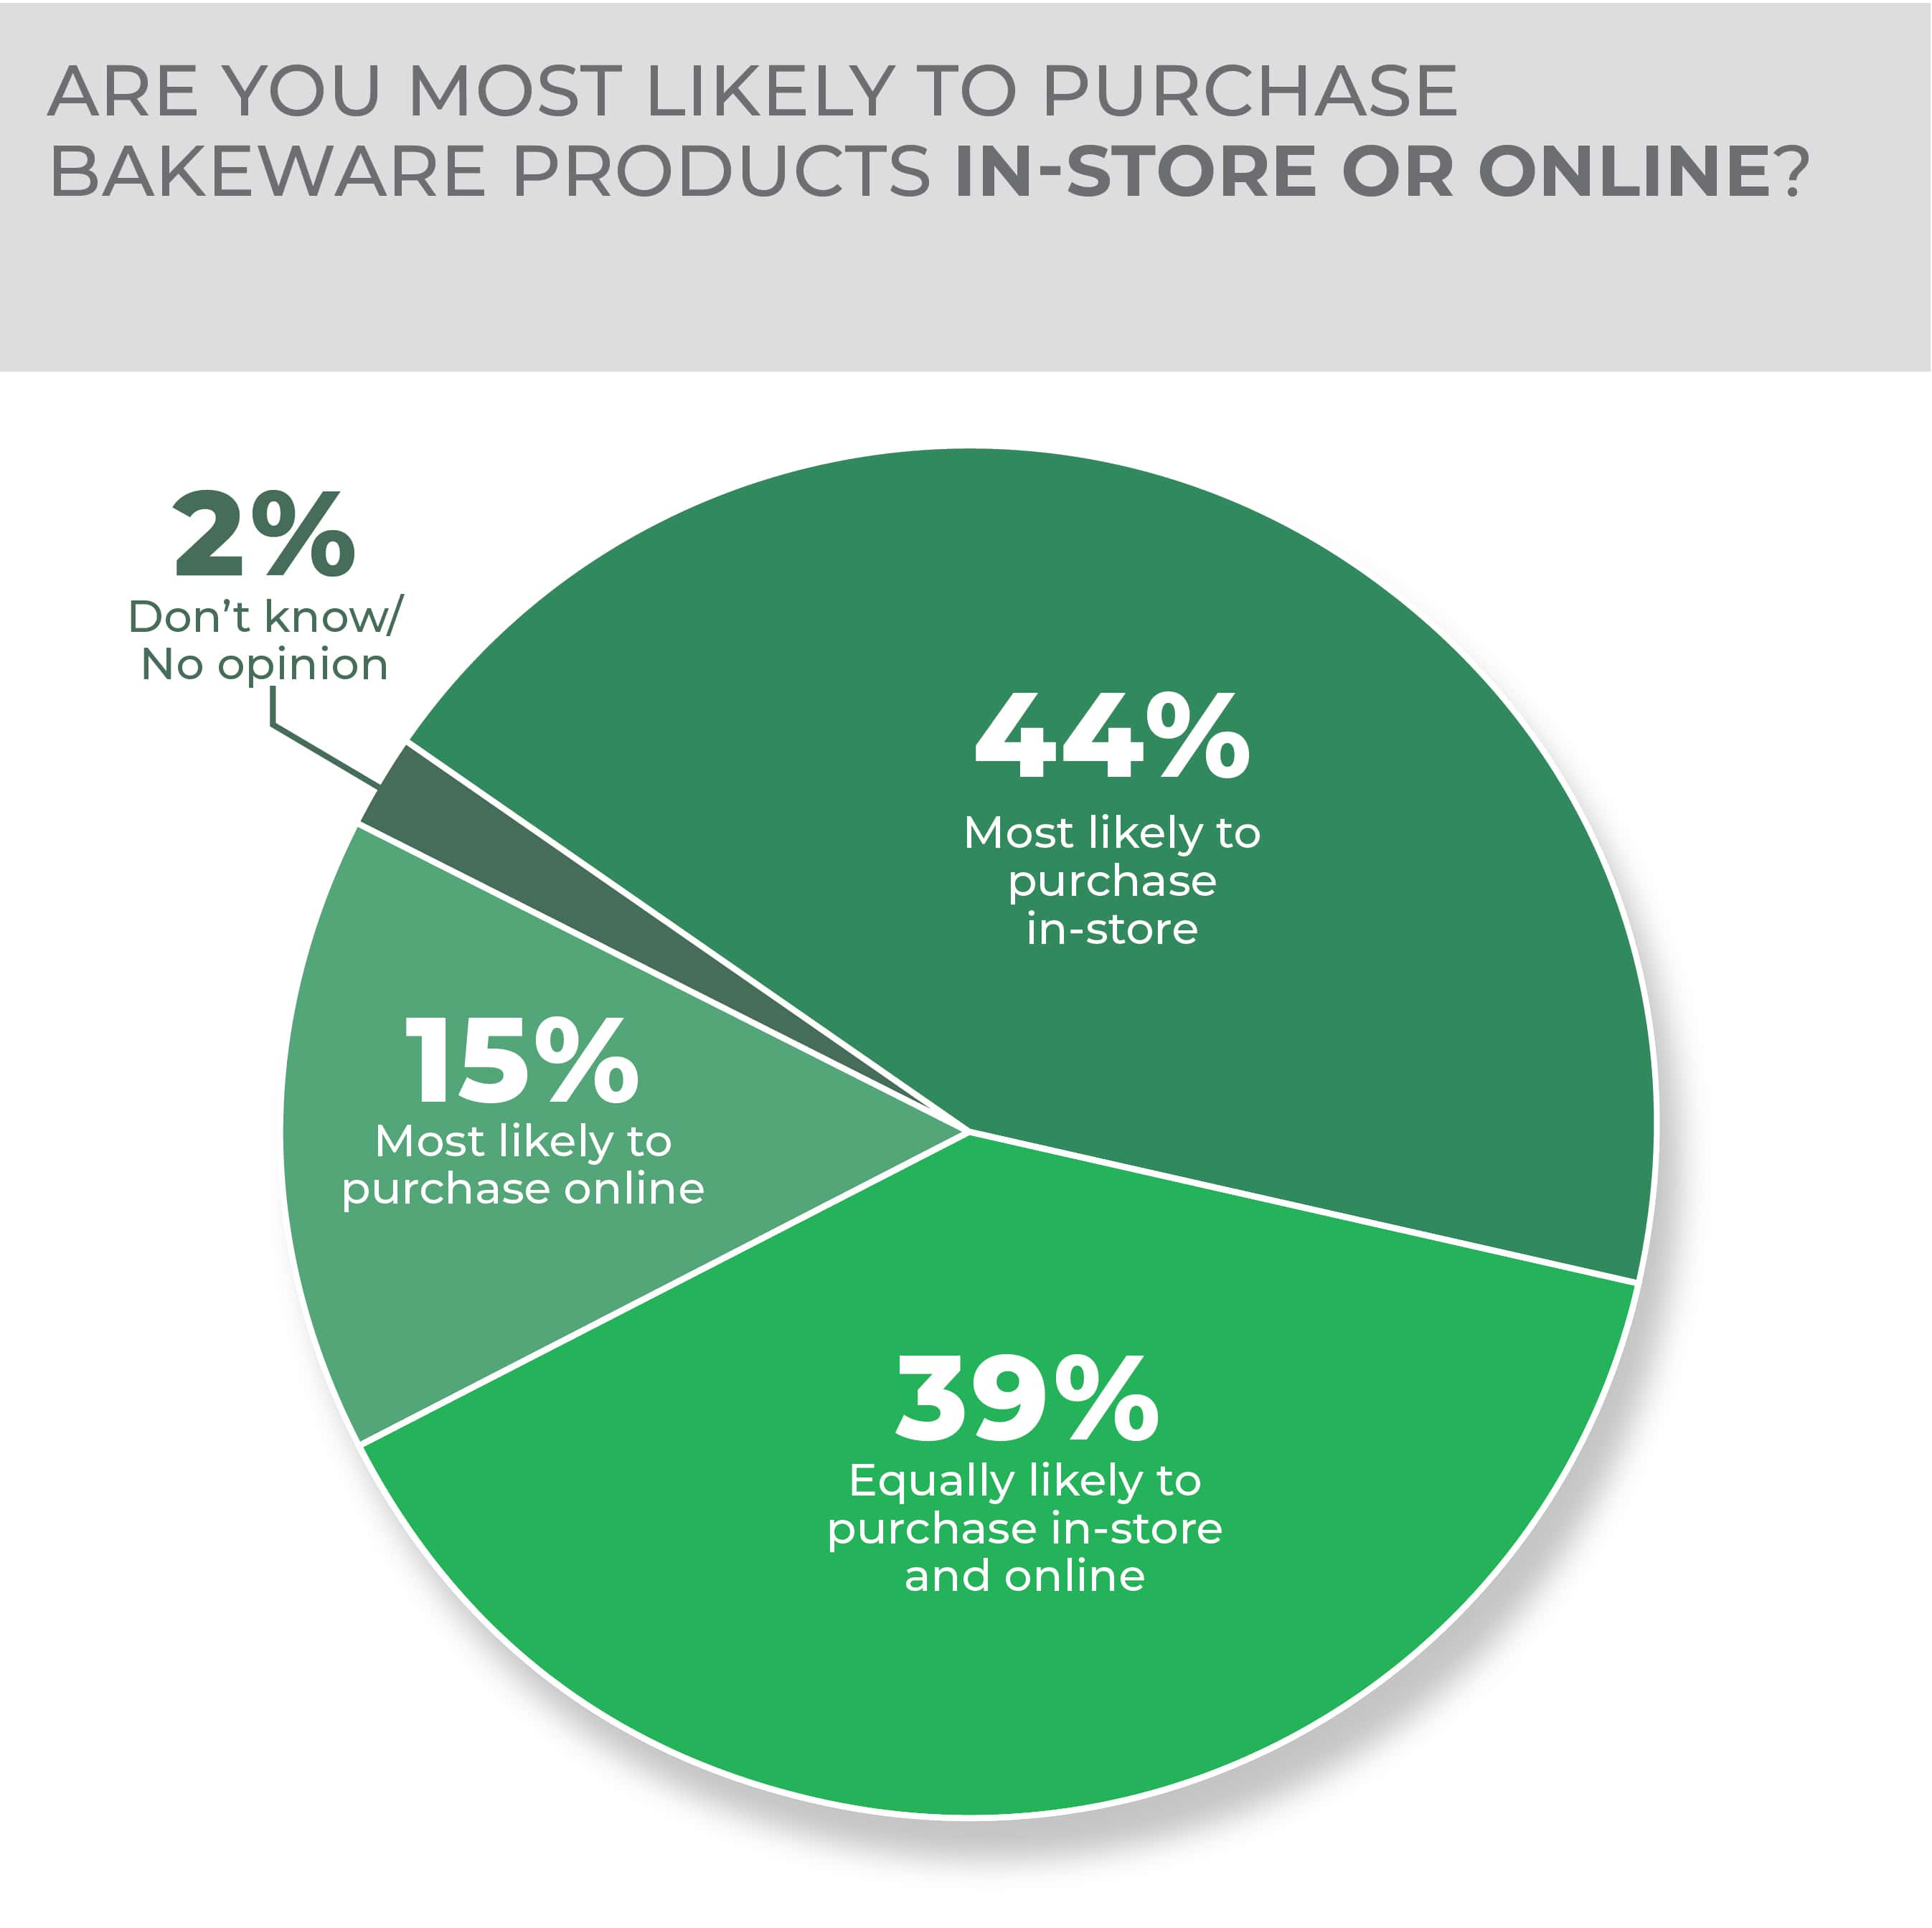
Consumers were just slightly more likely to purchase in-store at 44% with equally likely to purchase in-store and online at 39%. Only 15% were most likely to purchase online.
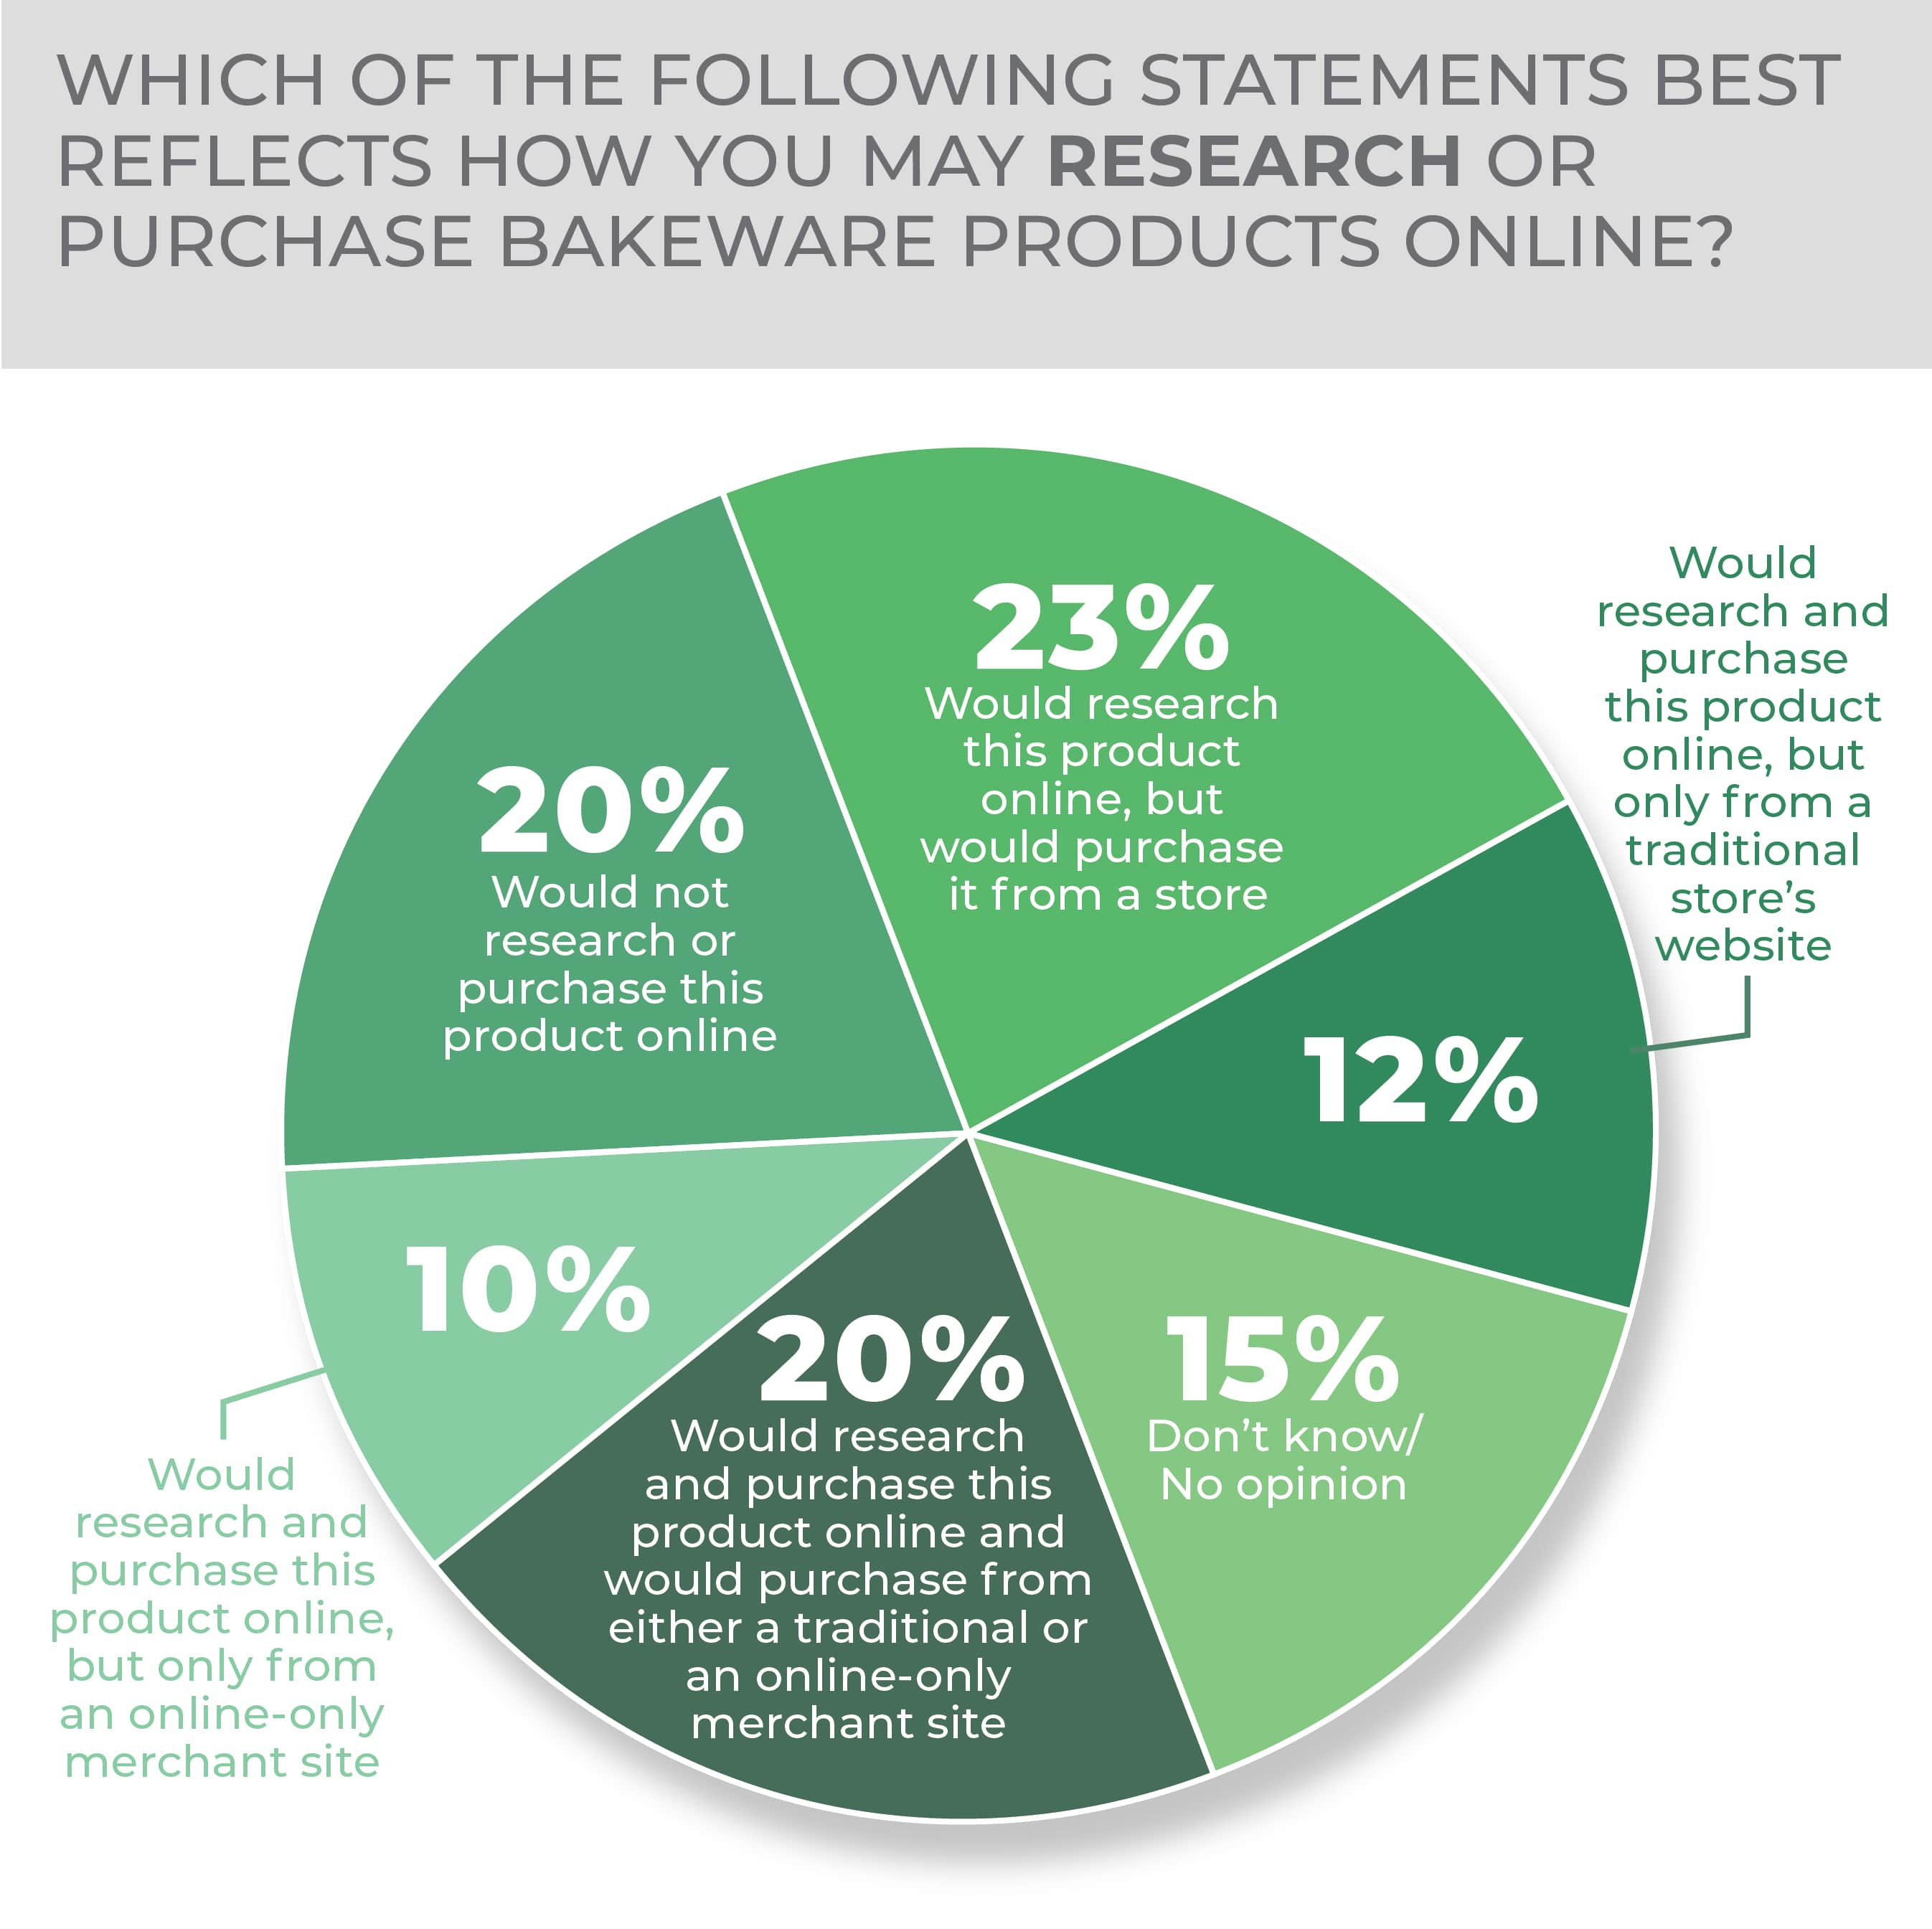
Results were relatively split for respondents deciding how they may research bakeware products online. Would research a product online but purchase it from a store came in highest at 23%, followed by would not research this product online and would research this product online and would purchase from either a traditional or an online-only merchant both at 20%, don’t know/no opinion at 15%, would research this product online but only from a traditional store’s website at 12%, and would research this product online but only from an online-only merchant at 10%.
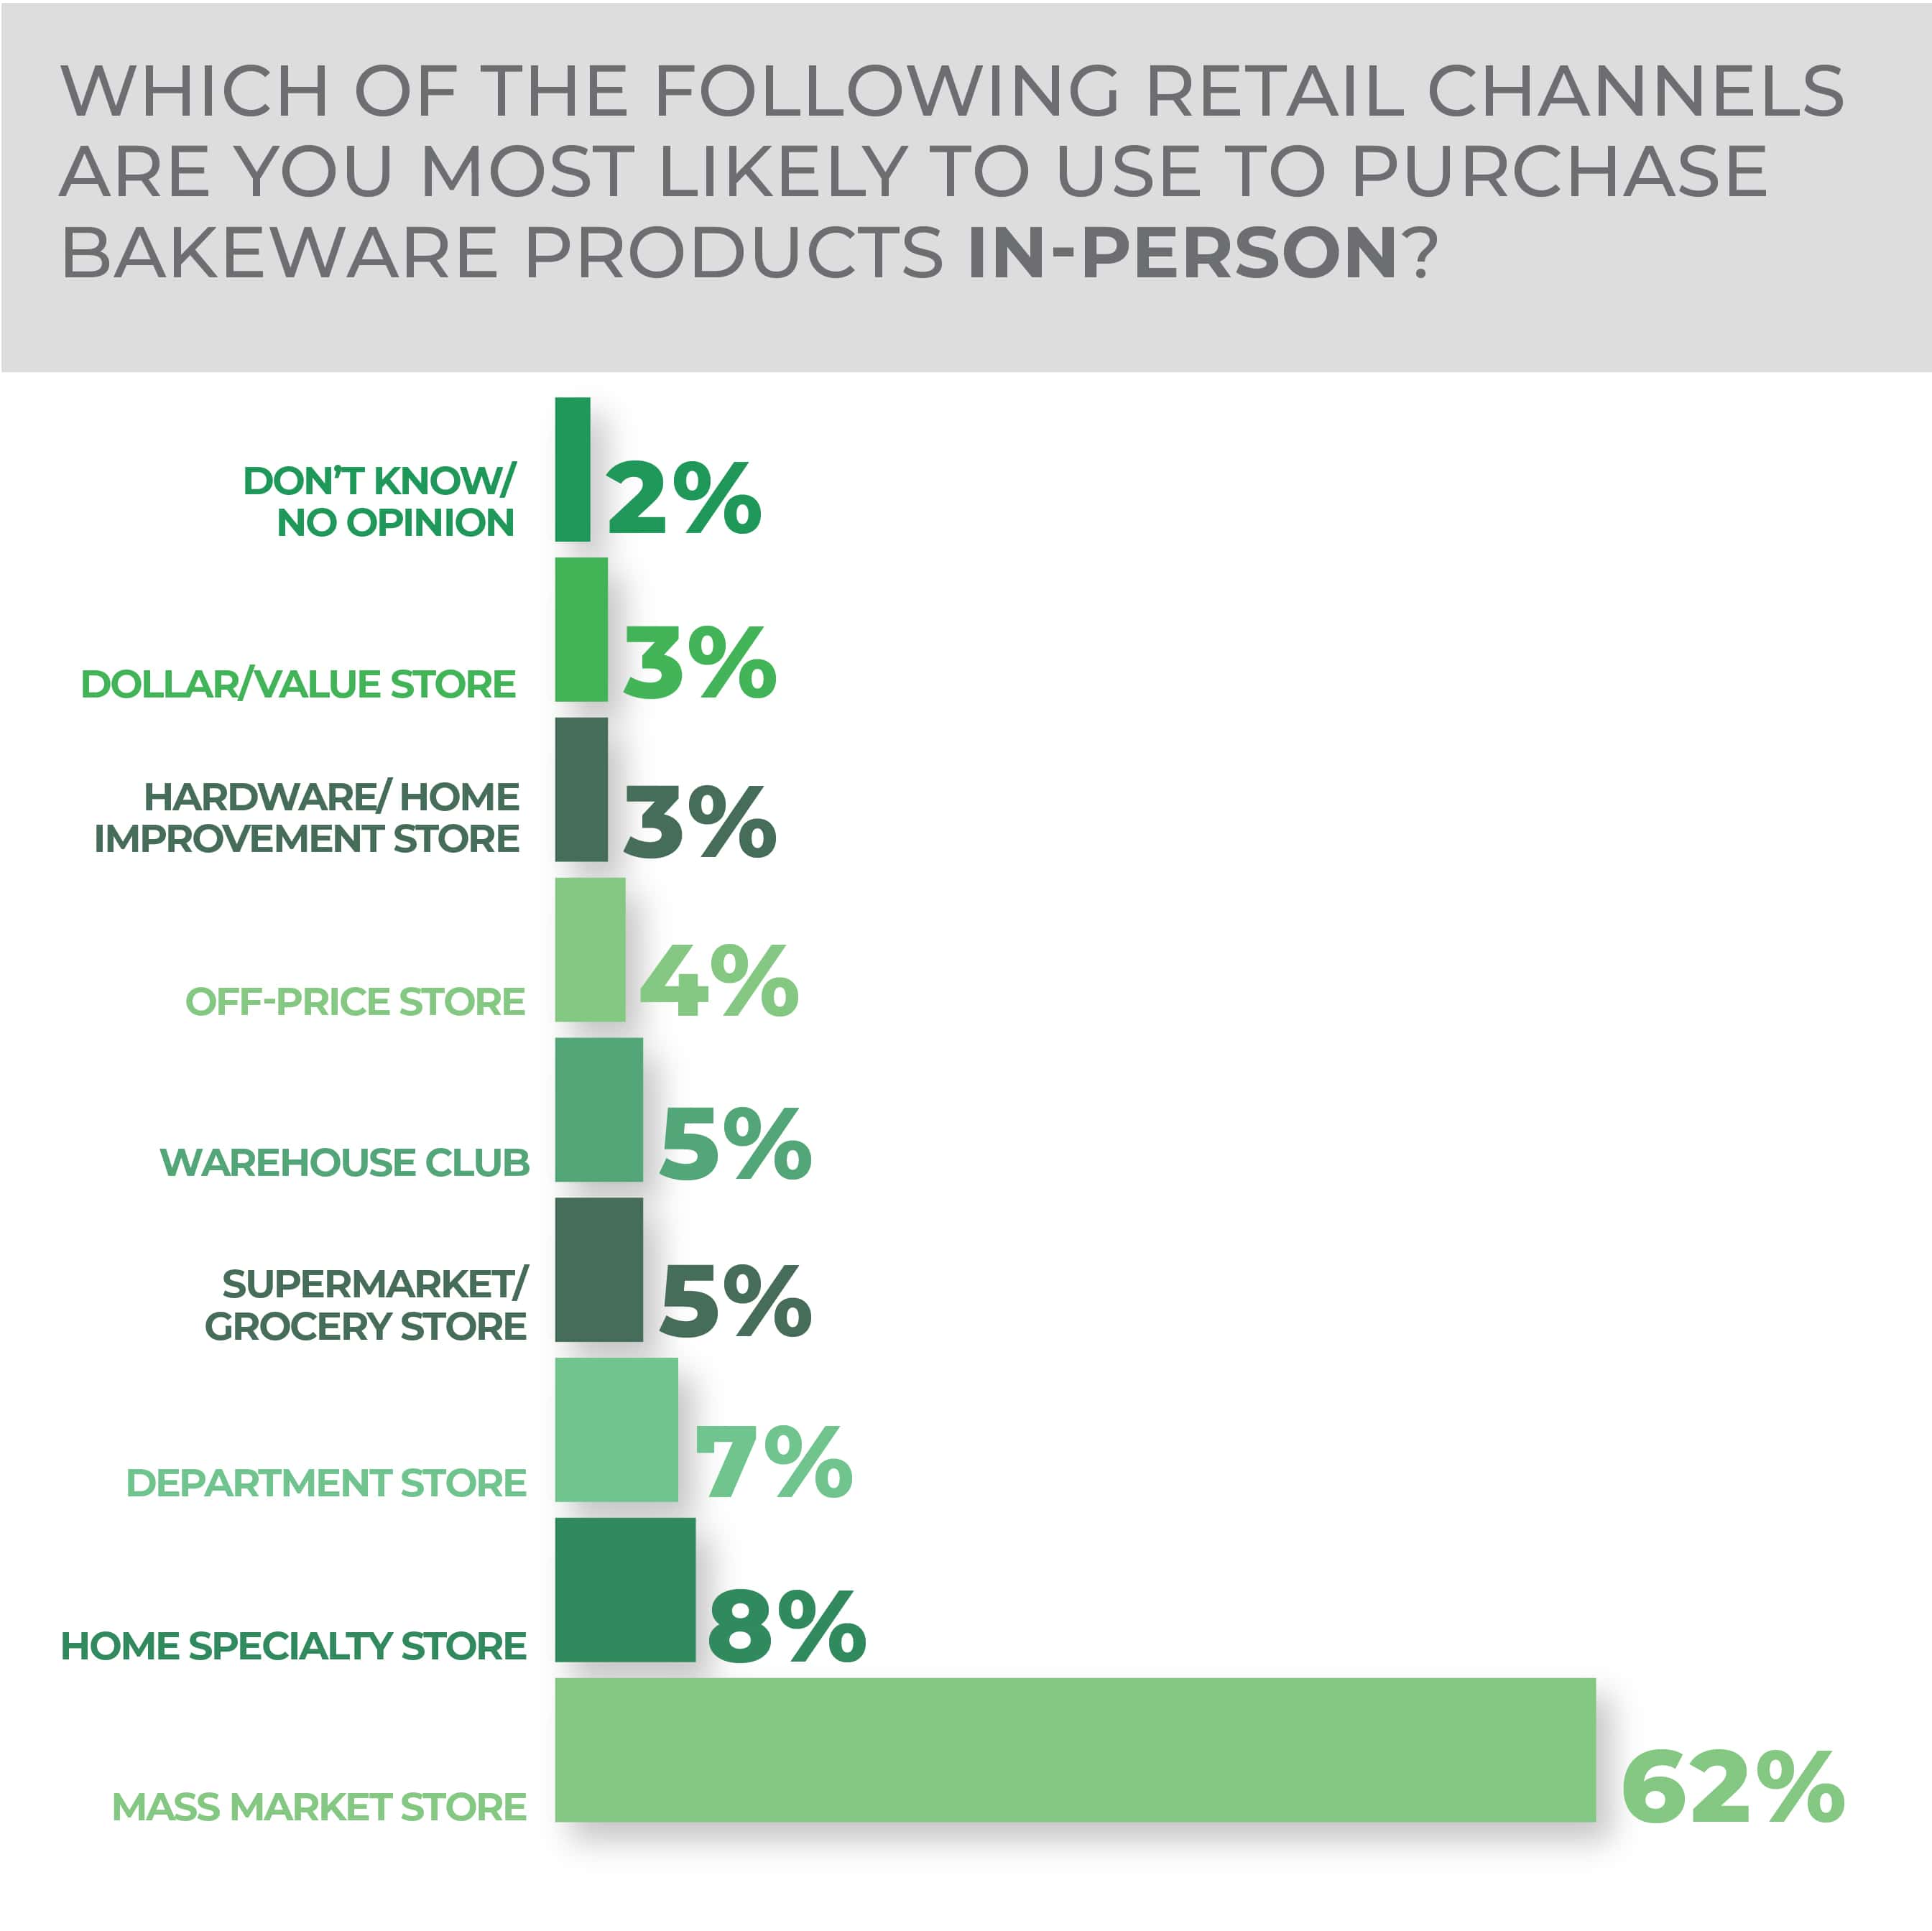
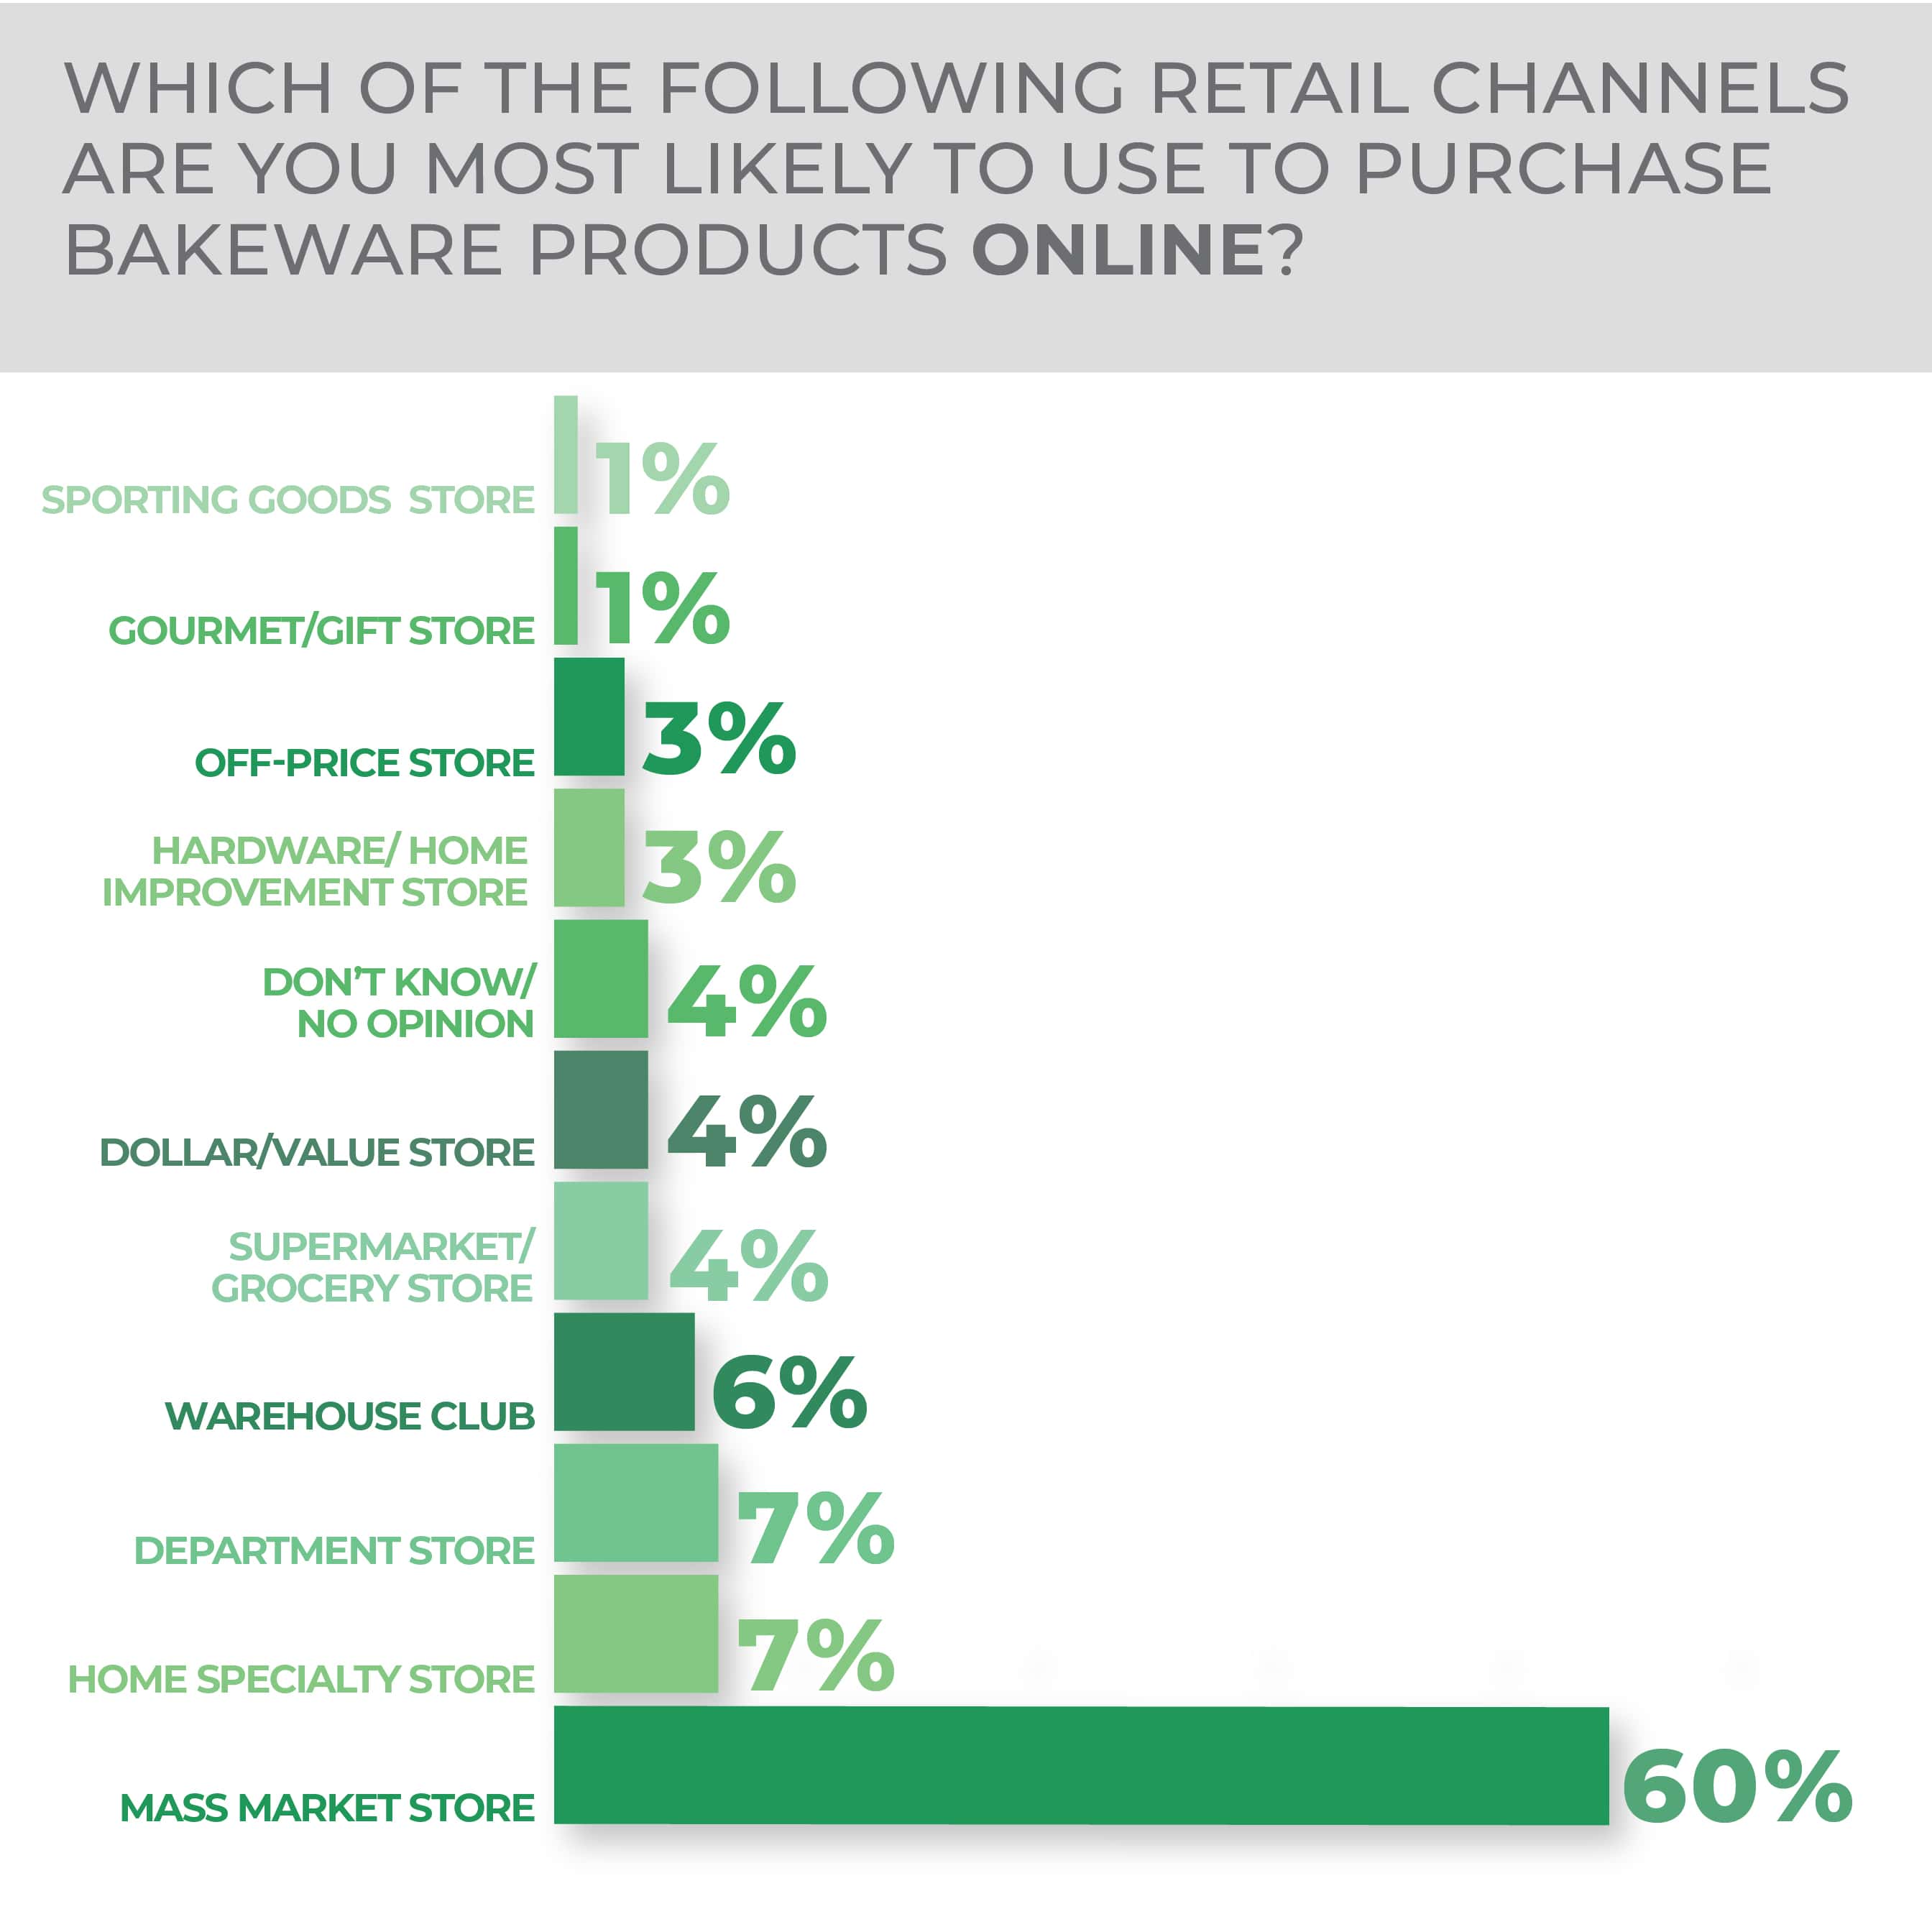
Mass market stores reigned for both in-person and online retail channels at which consumers are most likely to purchase. In-person, 62%, and online, 60% of respondents chose mass market stores while all other options for both in-person and online came in under 10%.
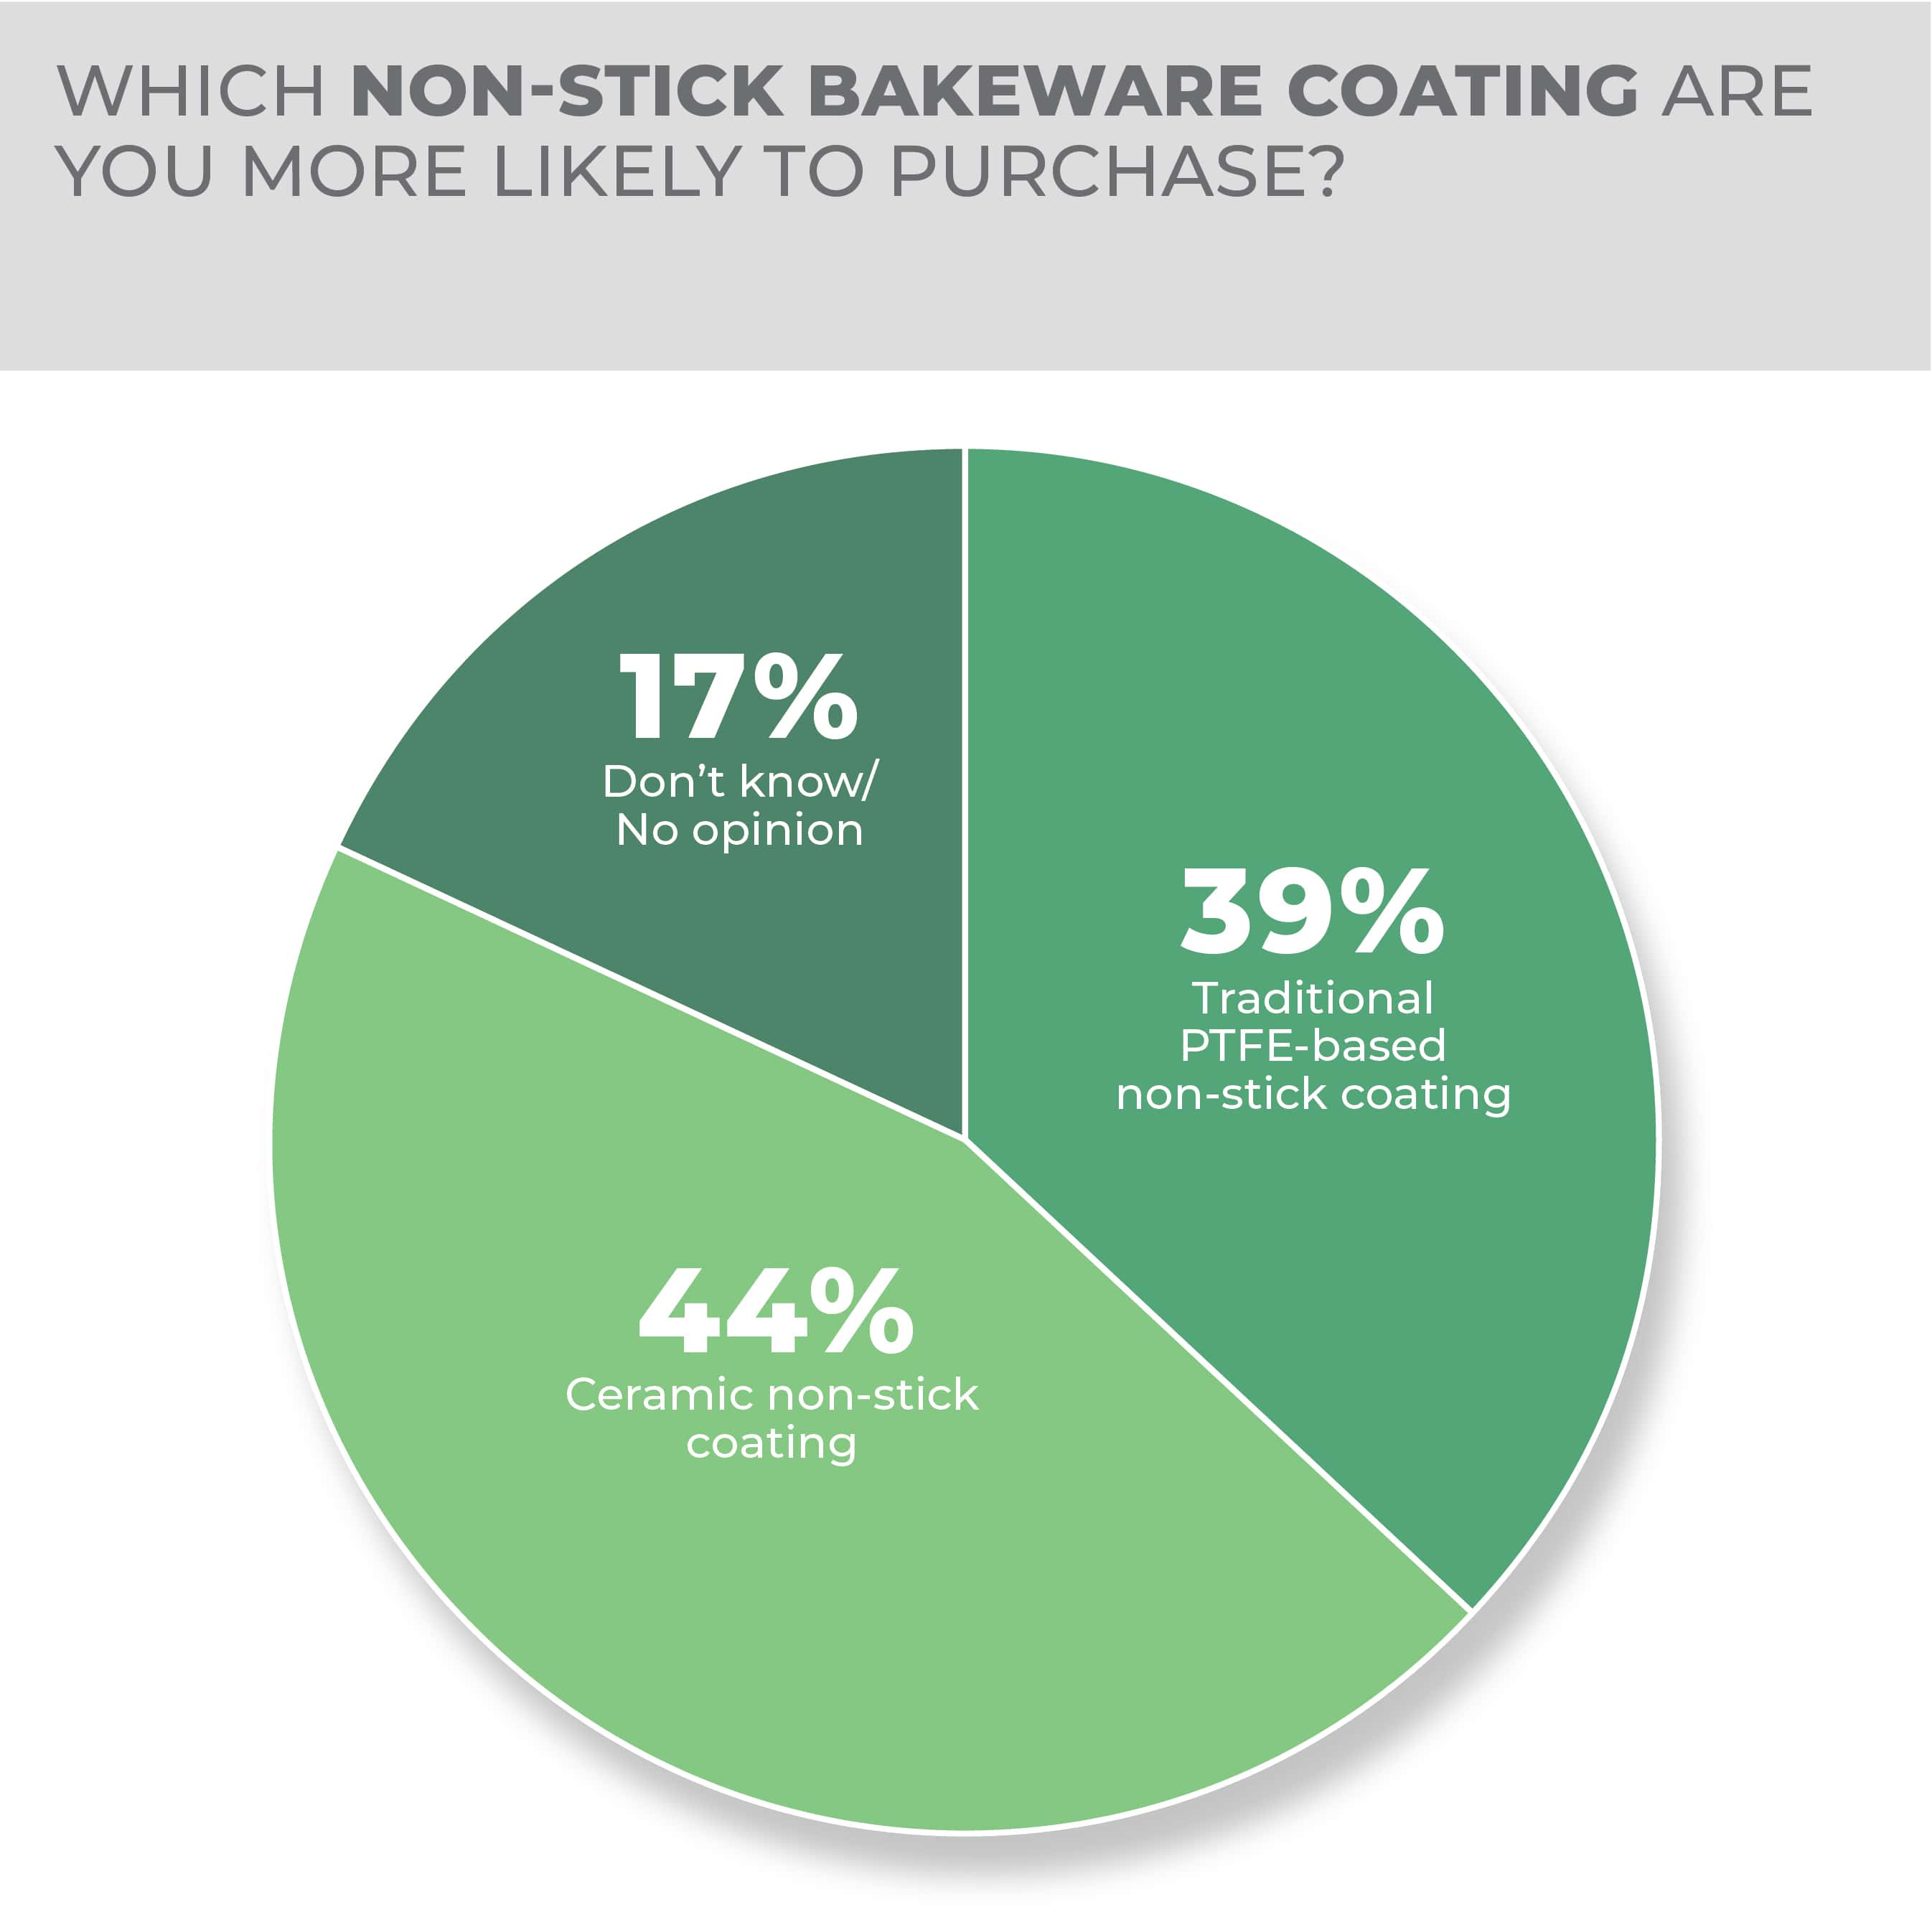
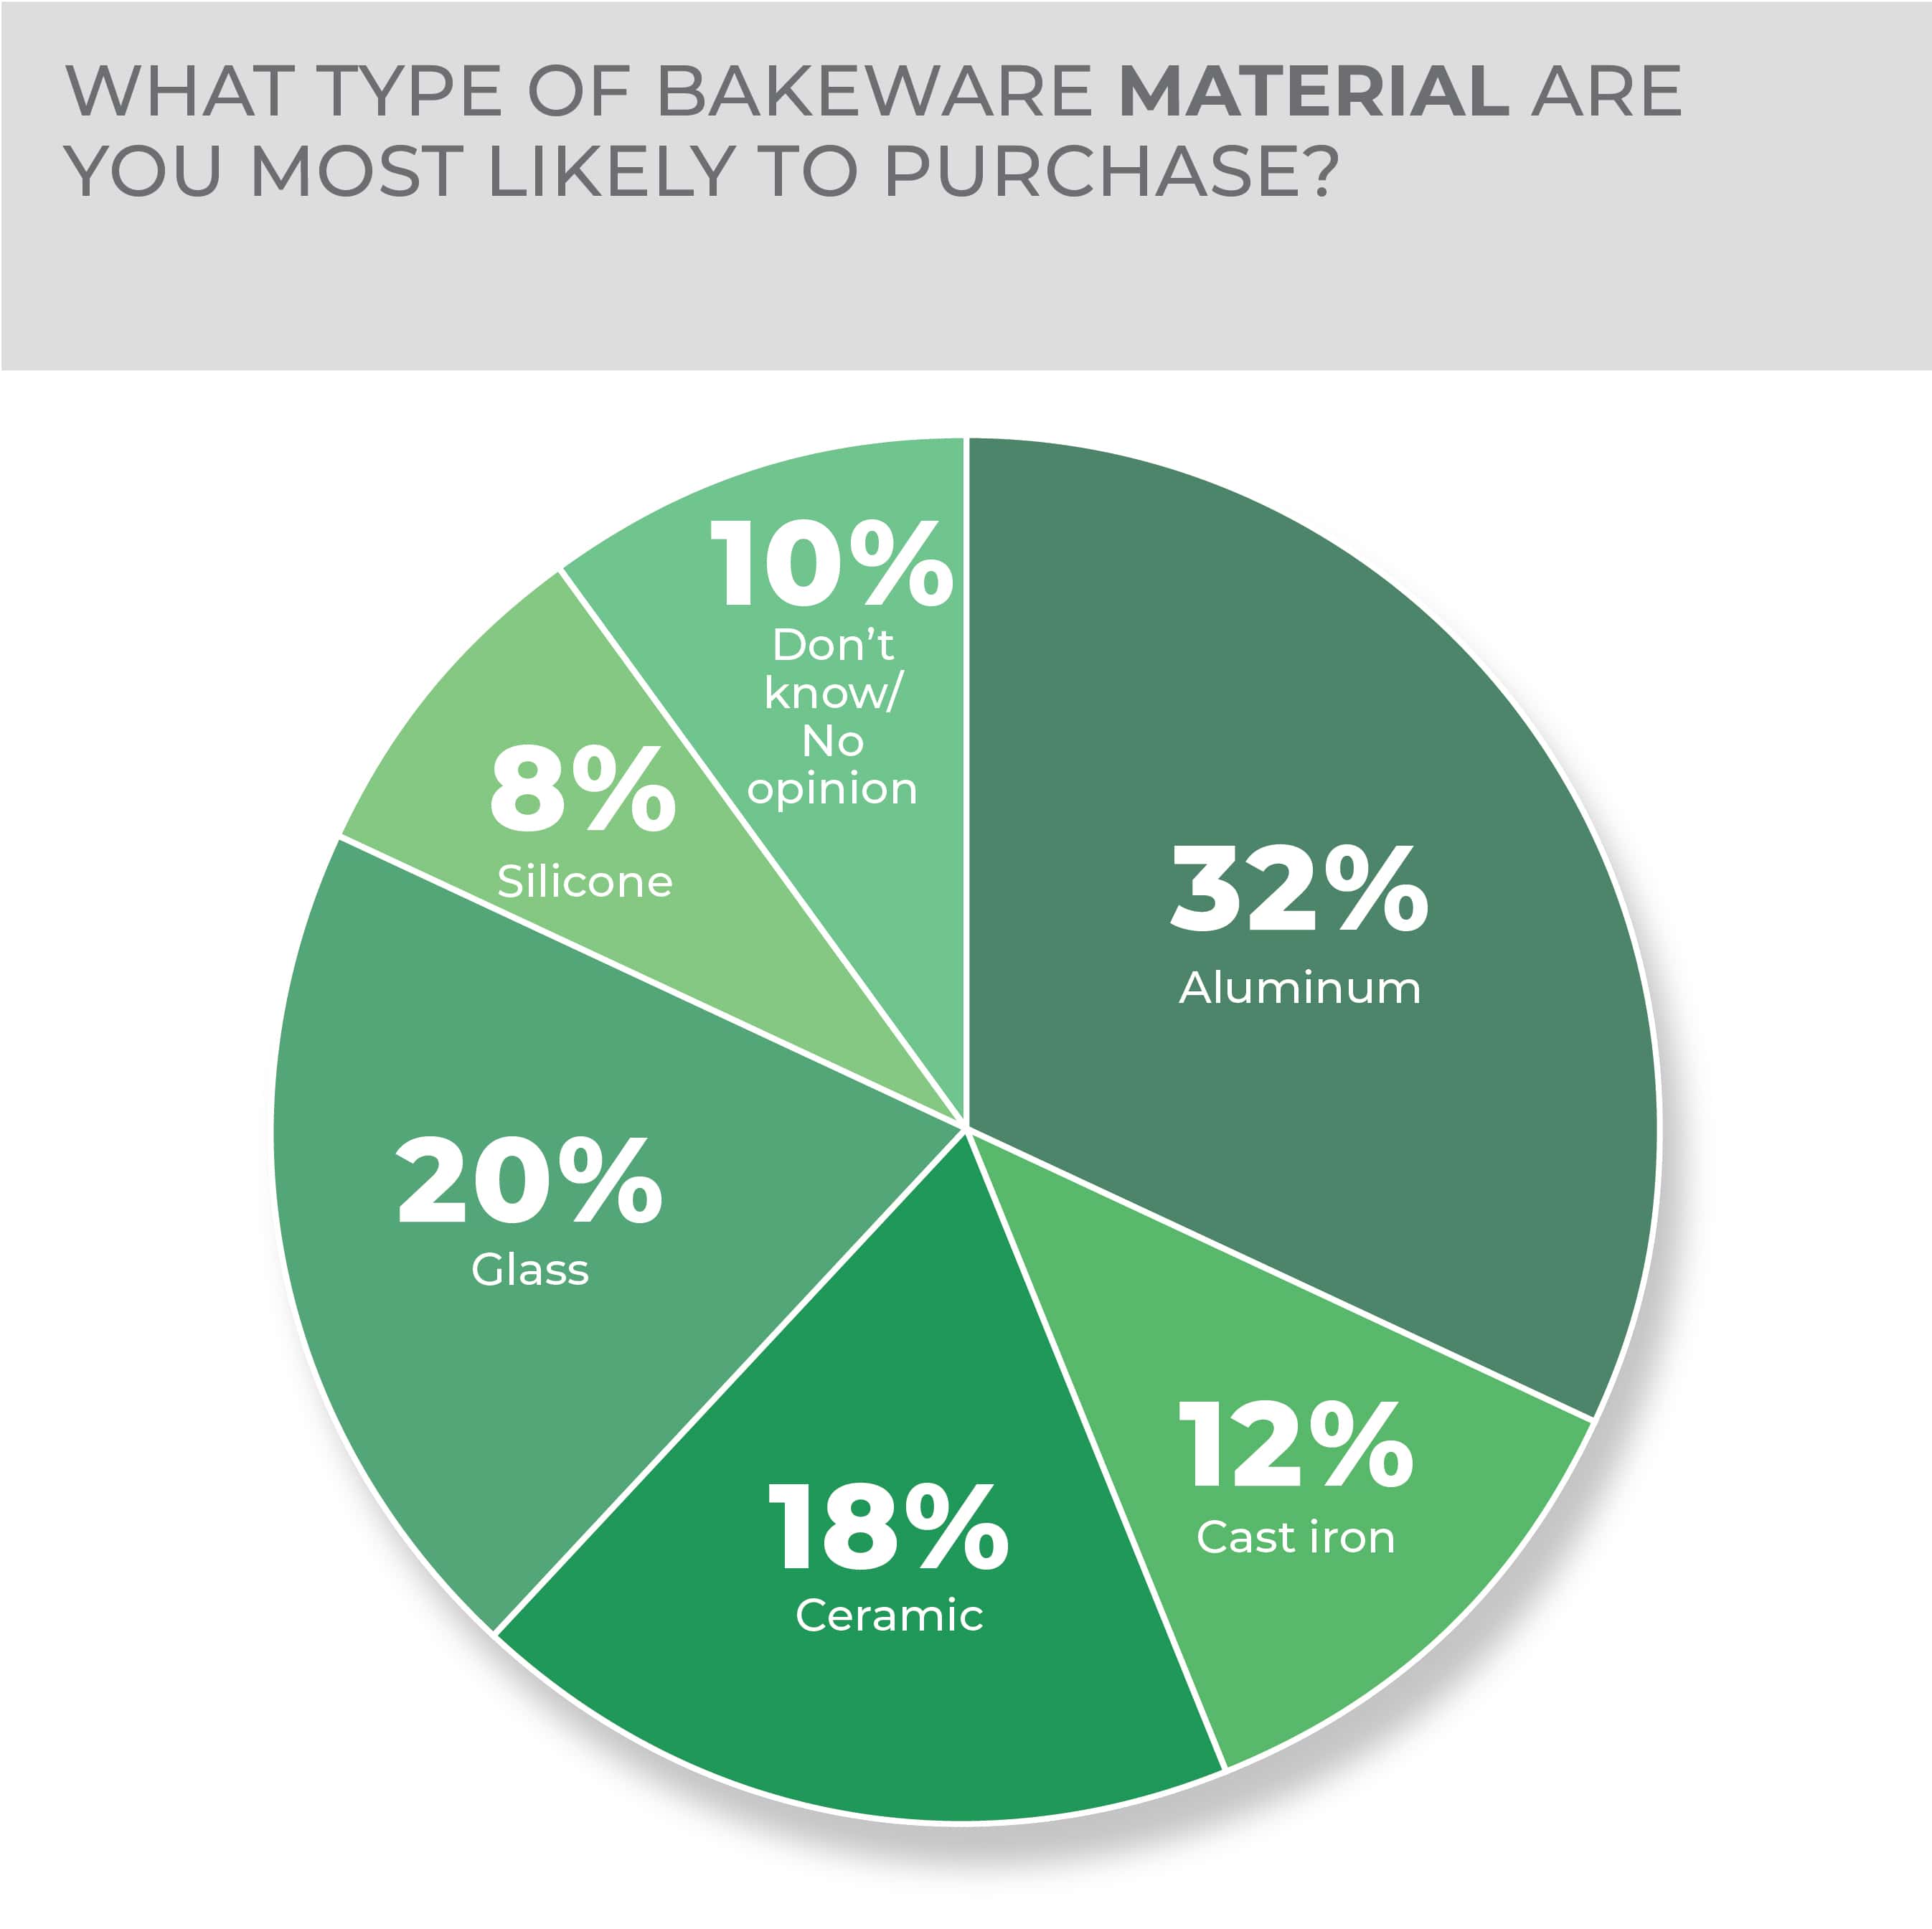
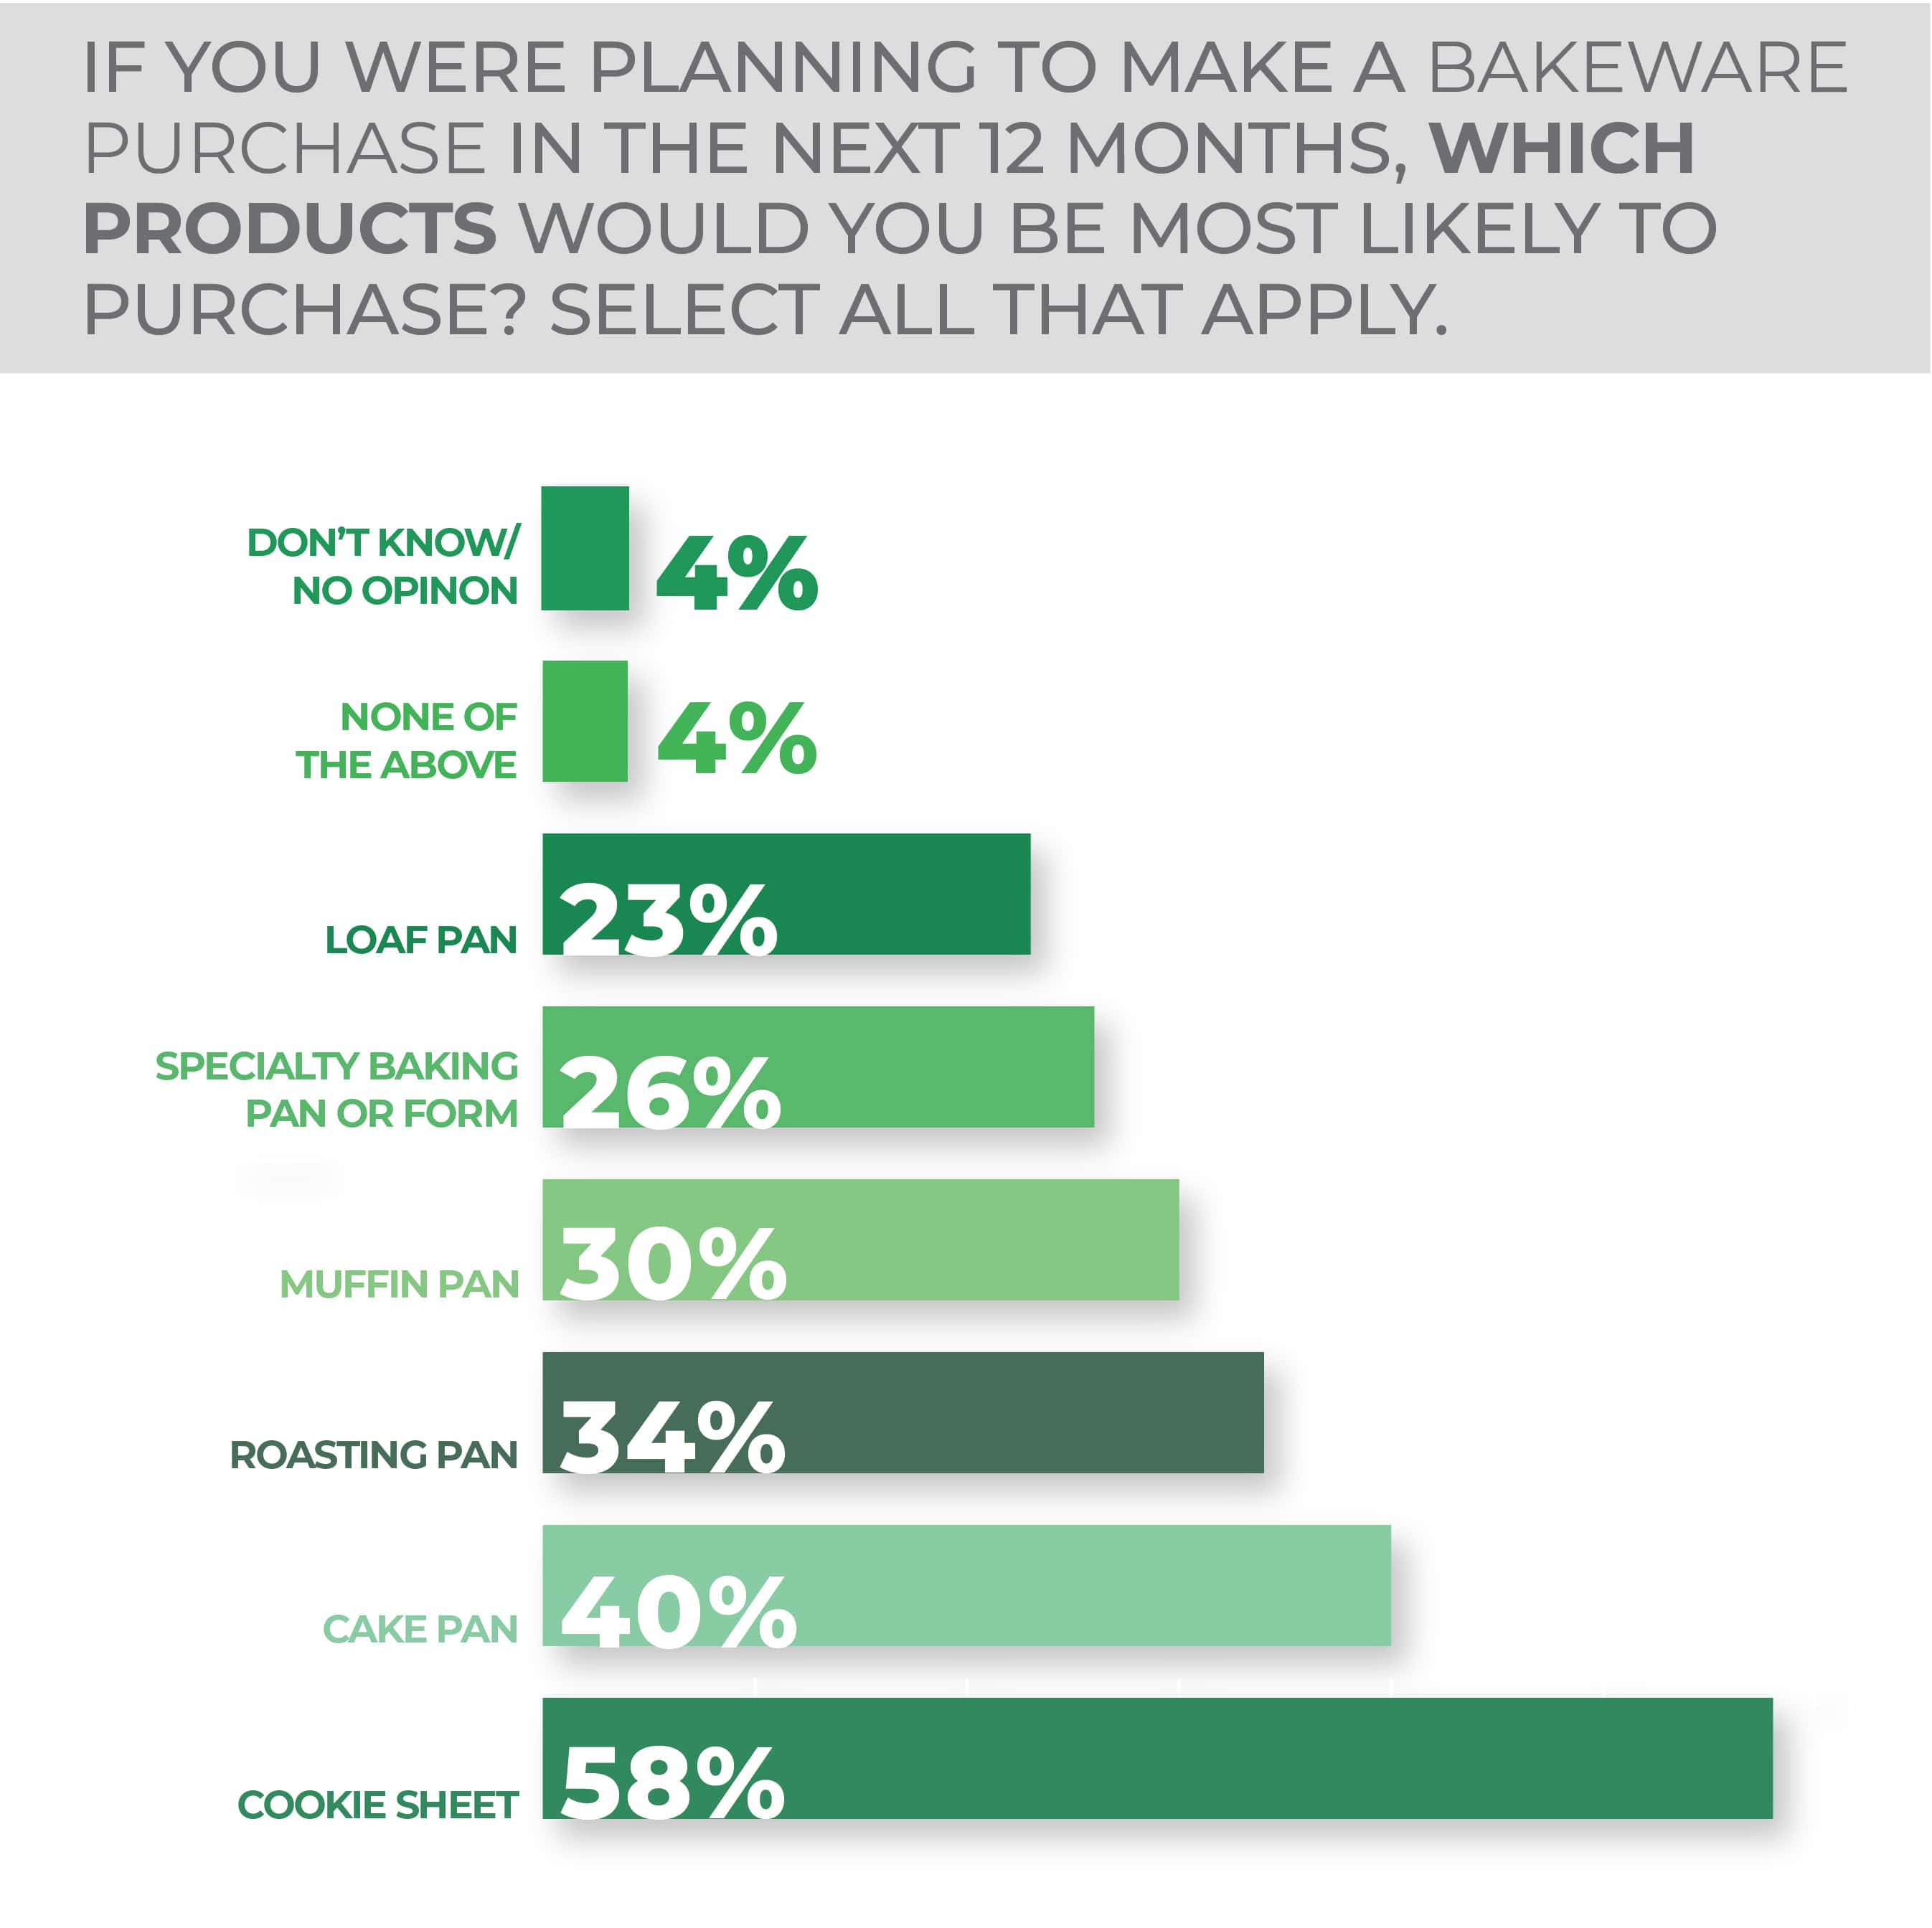
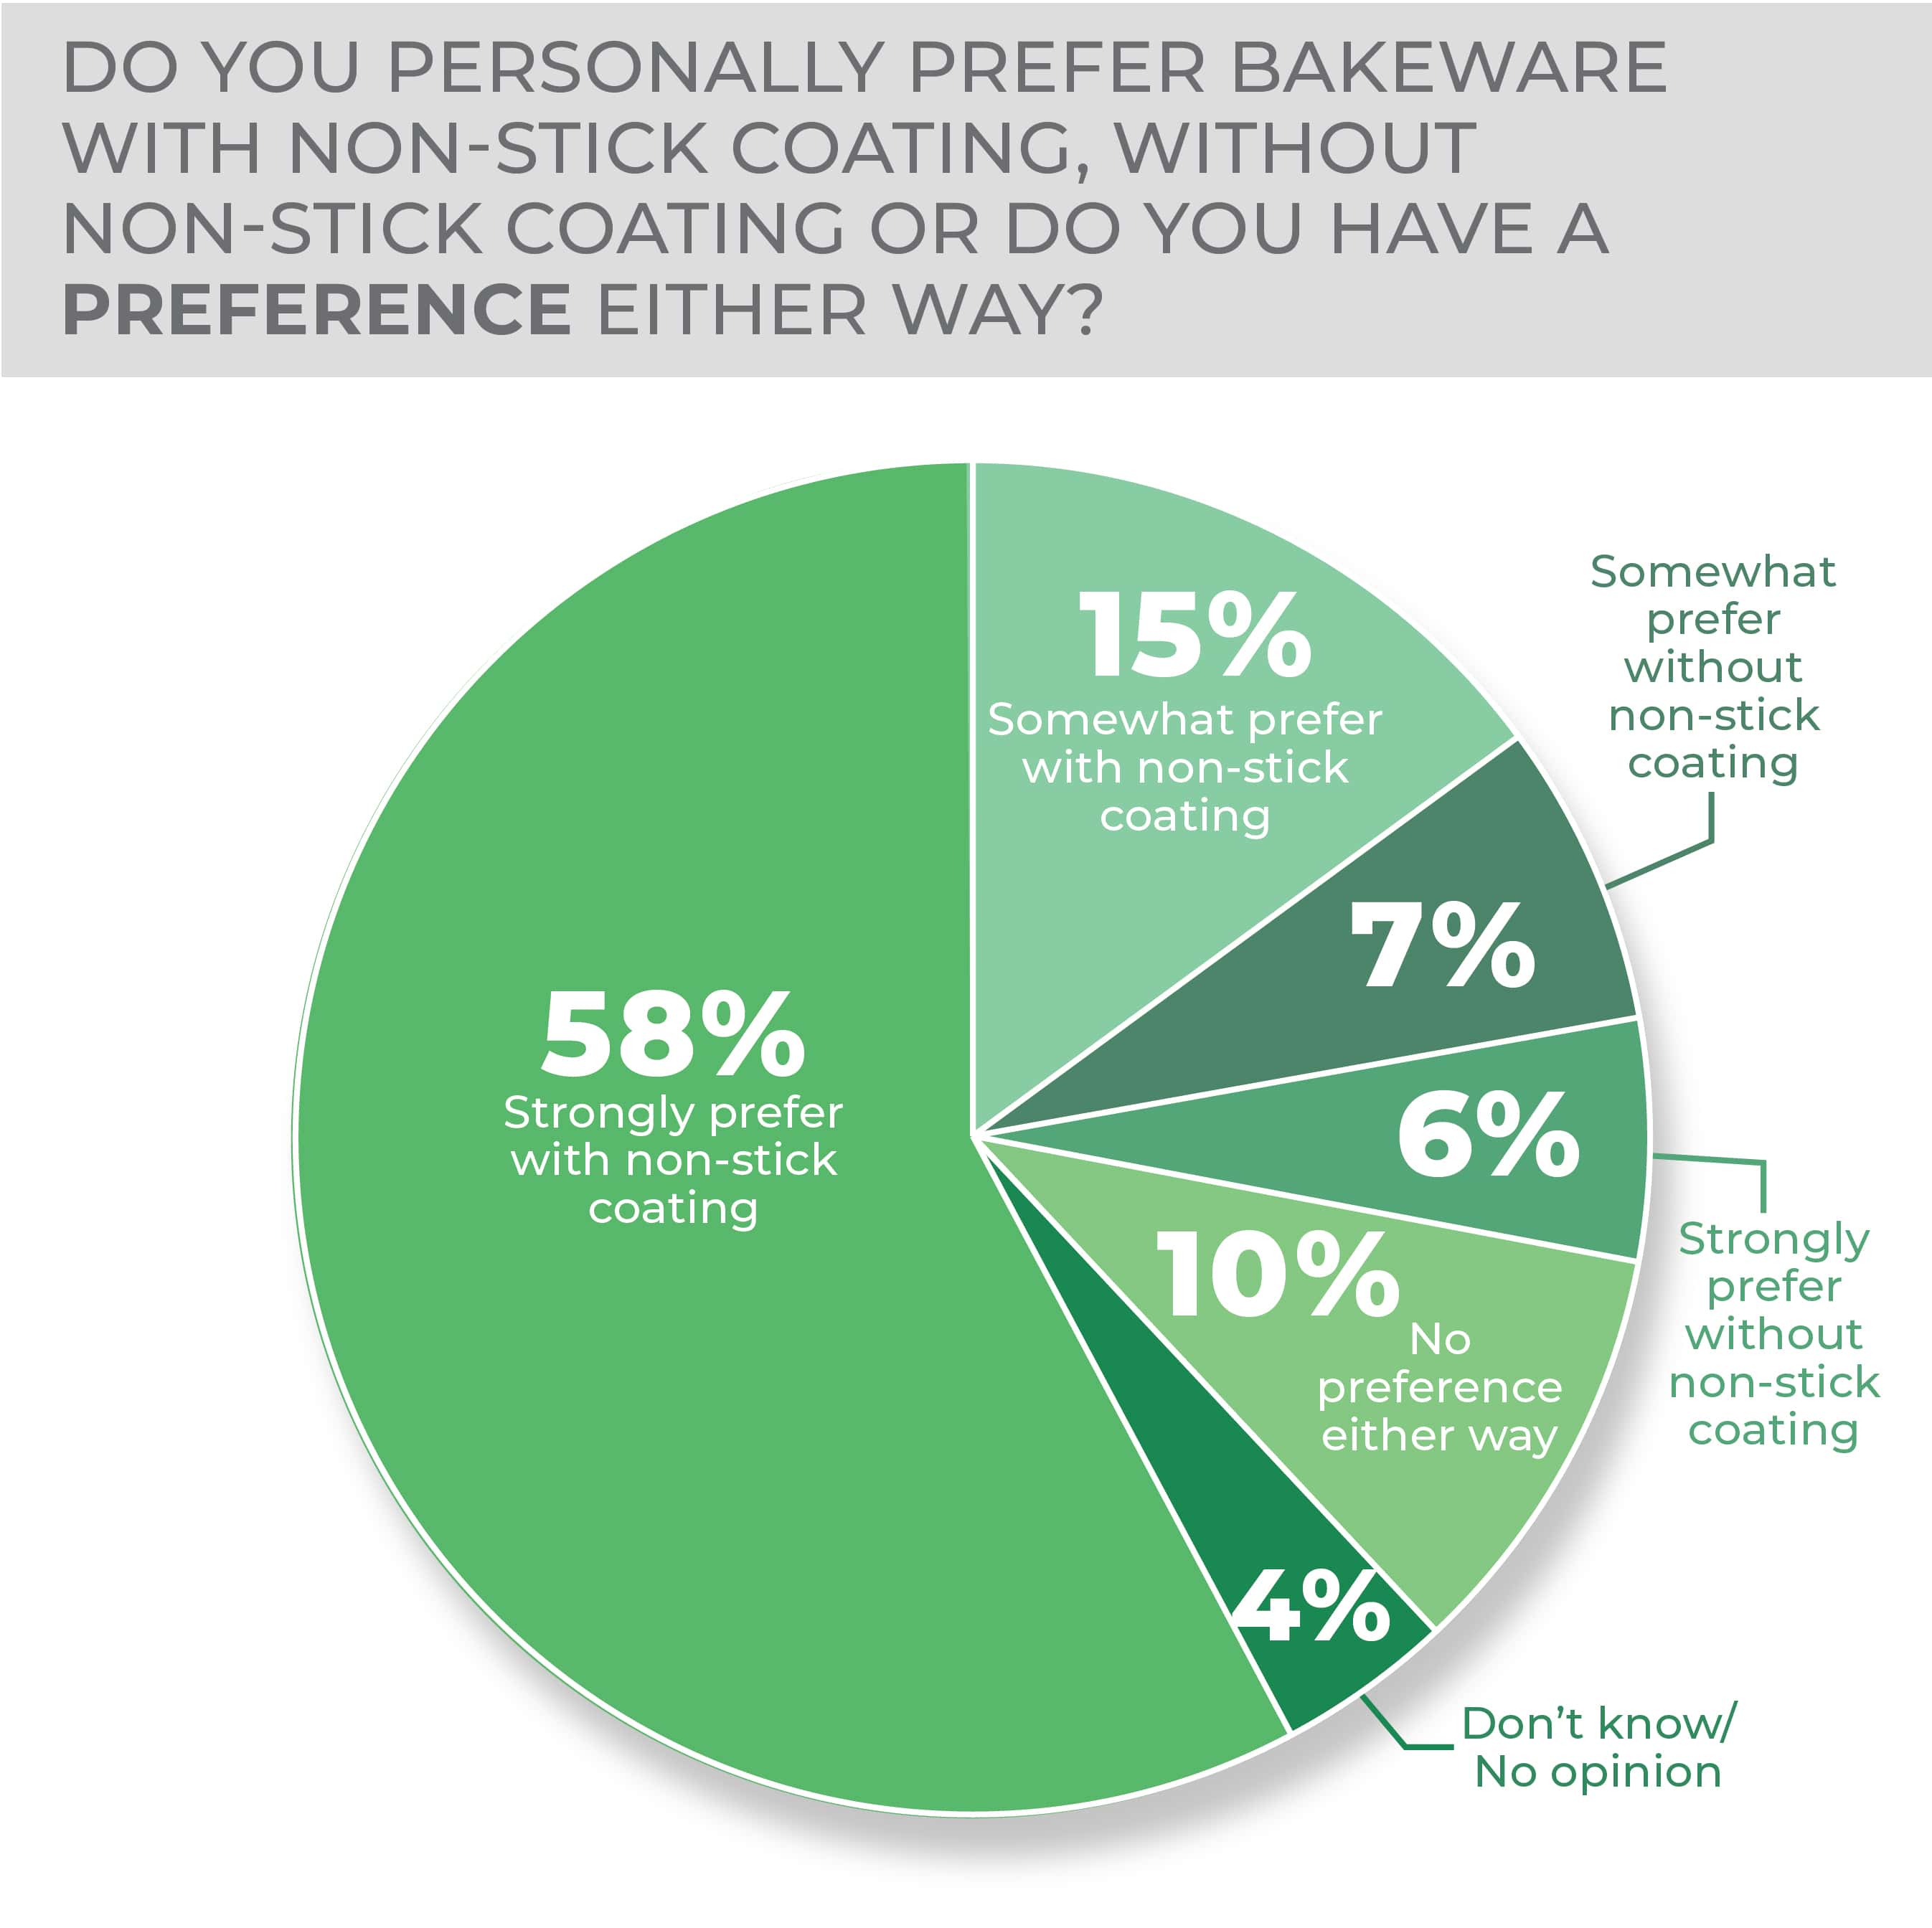
When asked which bakeware products they were most likely to buy in the next 12 months, a cookie sheet was the most popular answer at 58%, while 40% said a cake pan, 34% said a roasting pan, 30% said a muffin pan, 26% said a specialty baking pan or form, 23% said a loaf pan and the none of the above and don’t know/no opinion options were at 4%. Consumers strongly preferred non-stick coating at 58% with ceramic non-stick coating being the choice of the majority of respondents at 44%, followed closely by traditional PTFE-based non-stick coating at 39%. Aluminum, glass and ceramic were the top choices for bakeware material at 32%, 20% and 18%, respectively.
Millennials and GenXers were most interested in purchasing a bakeware product at 37% and 36%, with Gen Z and Baby Boomers close behind at 32% and 29%.
By region, the results were also fairly evenly split with all regions coming in within five points of each other. The South was the highest at 35%.
More Bakeware Findings:
-
- Consumers strongly prefer non-stick coating for their bakeware and the majority prefer ceramic non-stick coating.
- Most consumers are not willing to pay more for bakeware products despite inflation.
Cleaning Tools
As household necessities, brooms, mops, scrubbing brushes and other cleaning tools constitute a category where consumers know that the odds of their making a purchase are pretty good, most are likely to purchase a replacement product but sometimes look to step up their tidying game.
-
- By region, Southern consumers are most likely to purchase cleaning tools in the year ahead.
- Mass market retailers are the destination of choice for six of 10 cleaning tool purchasers whether in-person or online.
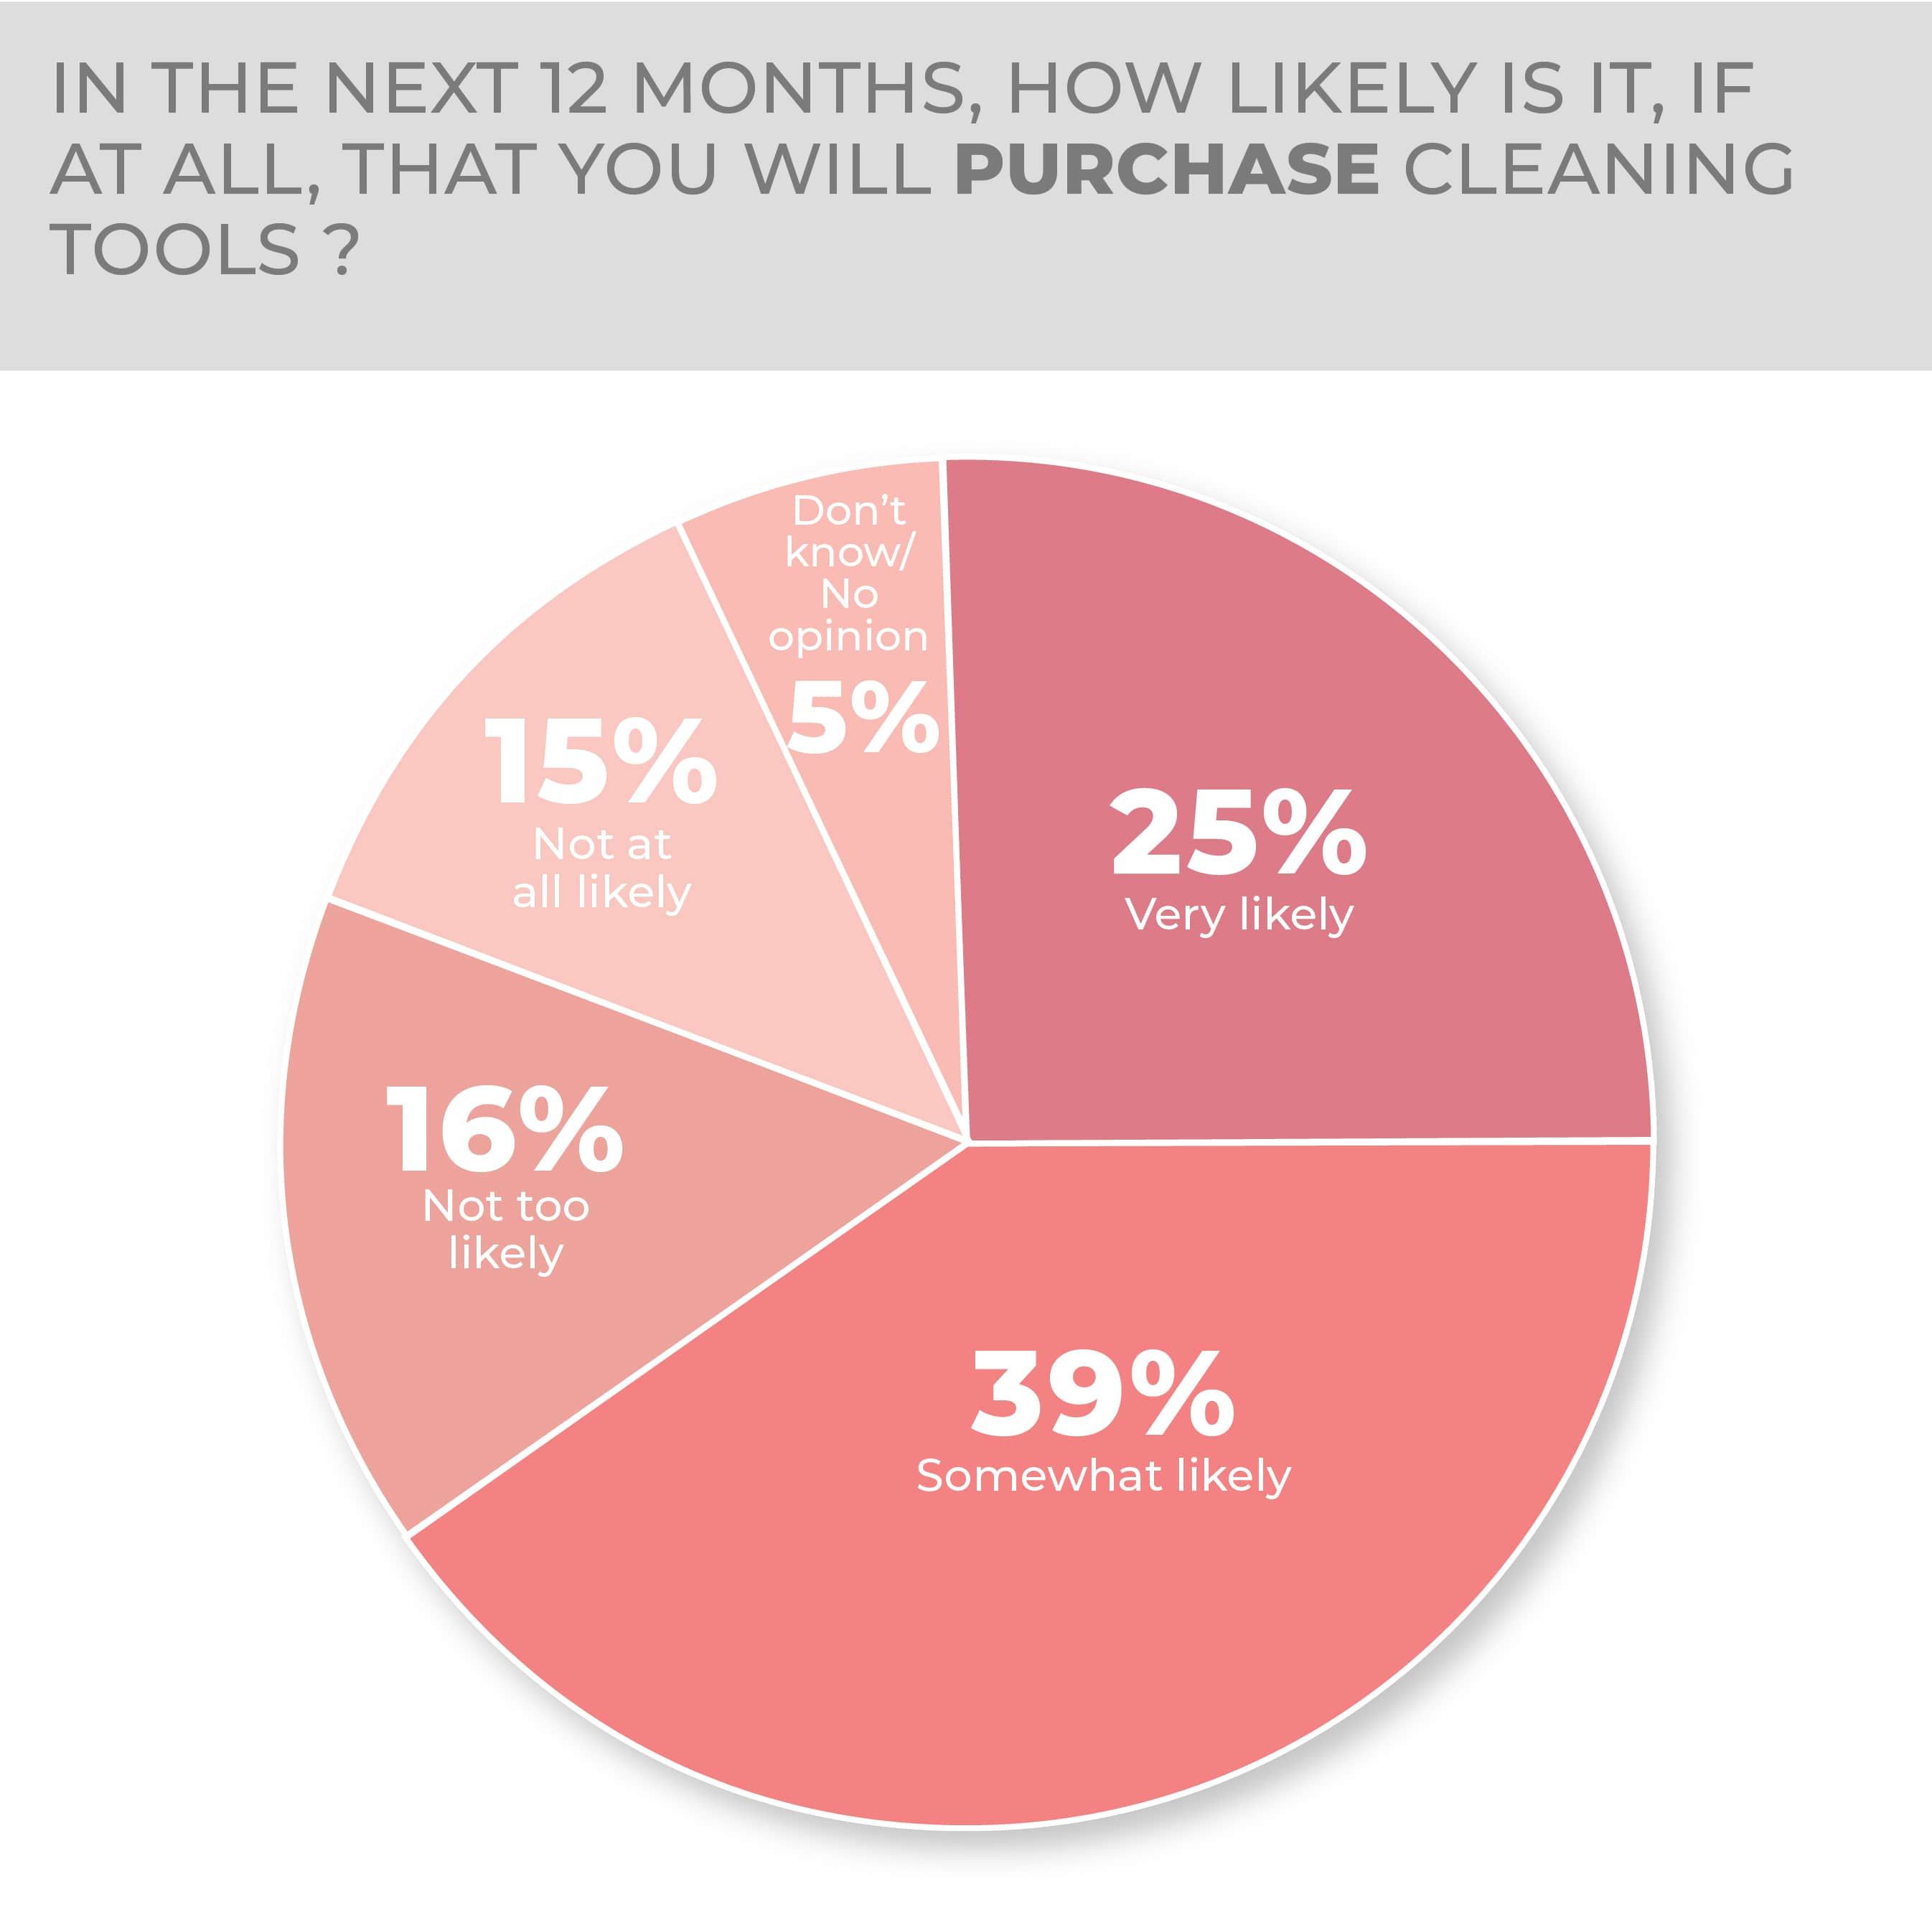
In this year’s HomePage News 2023 Consumer Outlook Survey, a quarter of respondents said they would very likely make a purchase in the category, down three points year over year, and 39% said they would be somewhat likely to make a purchase, basically flat from last year.
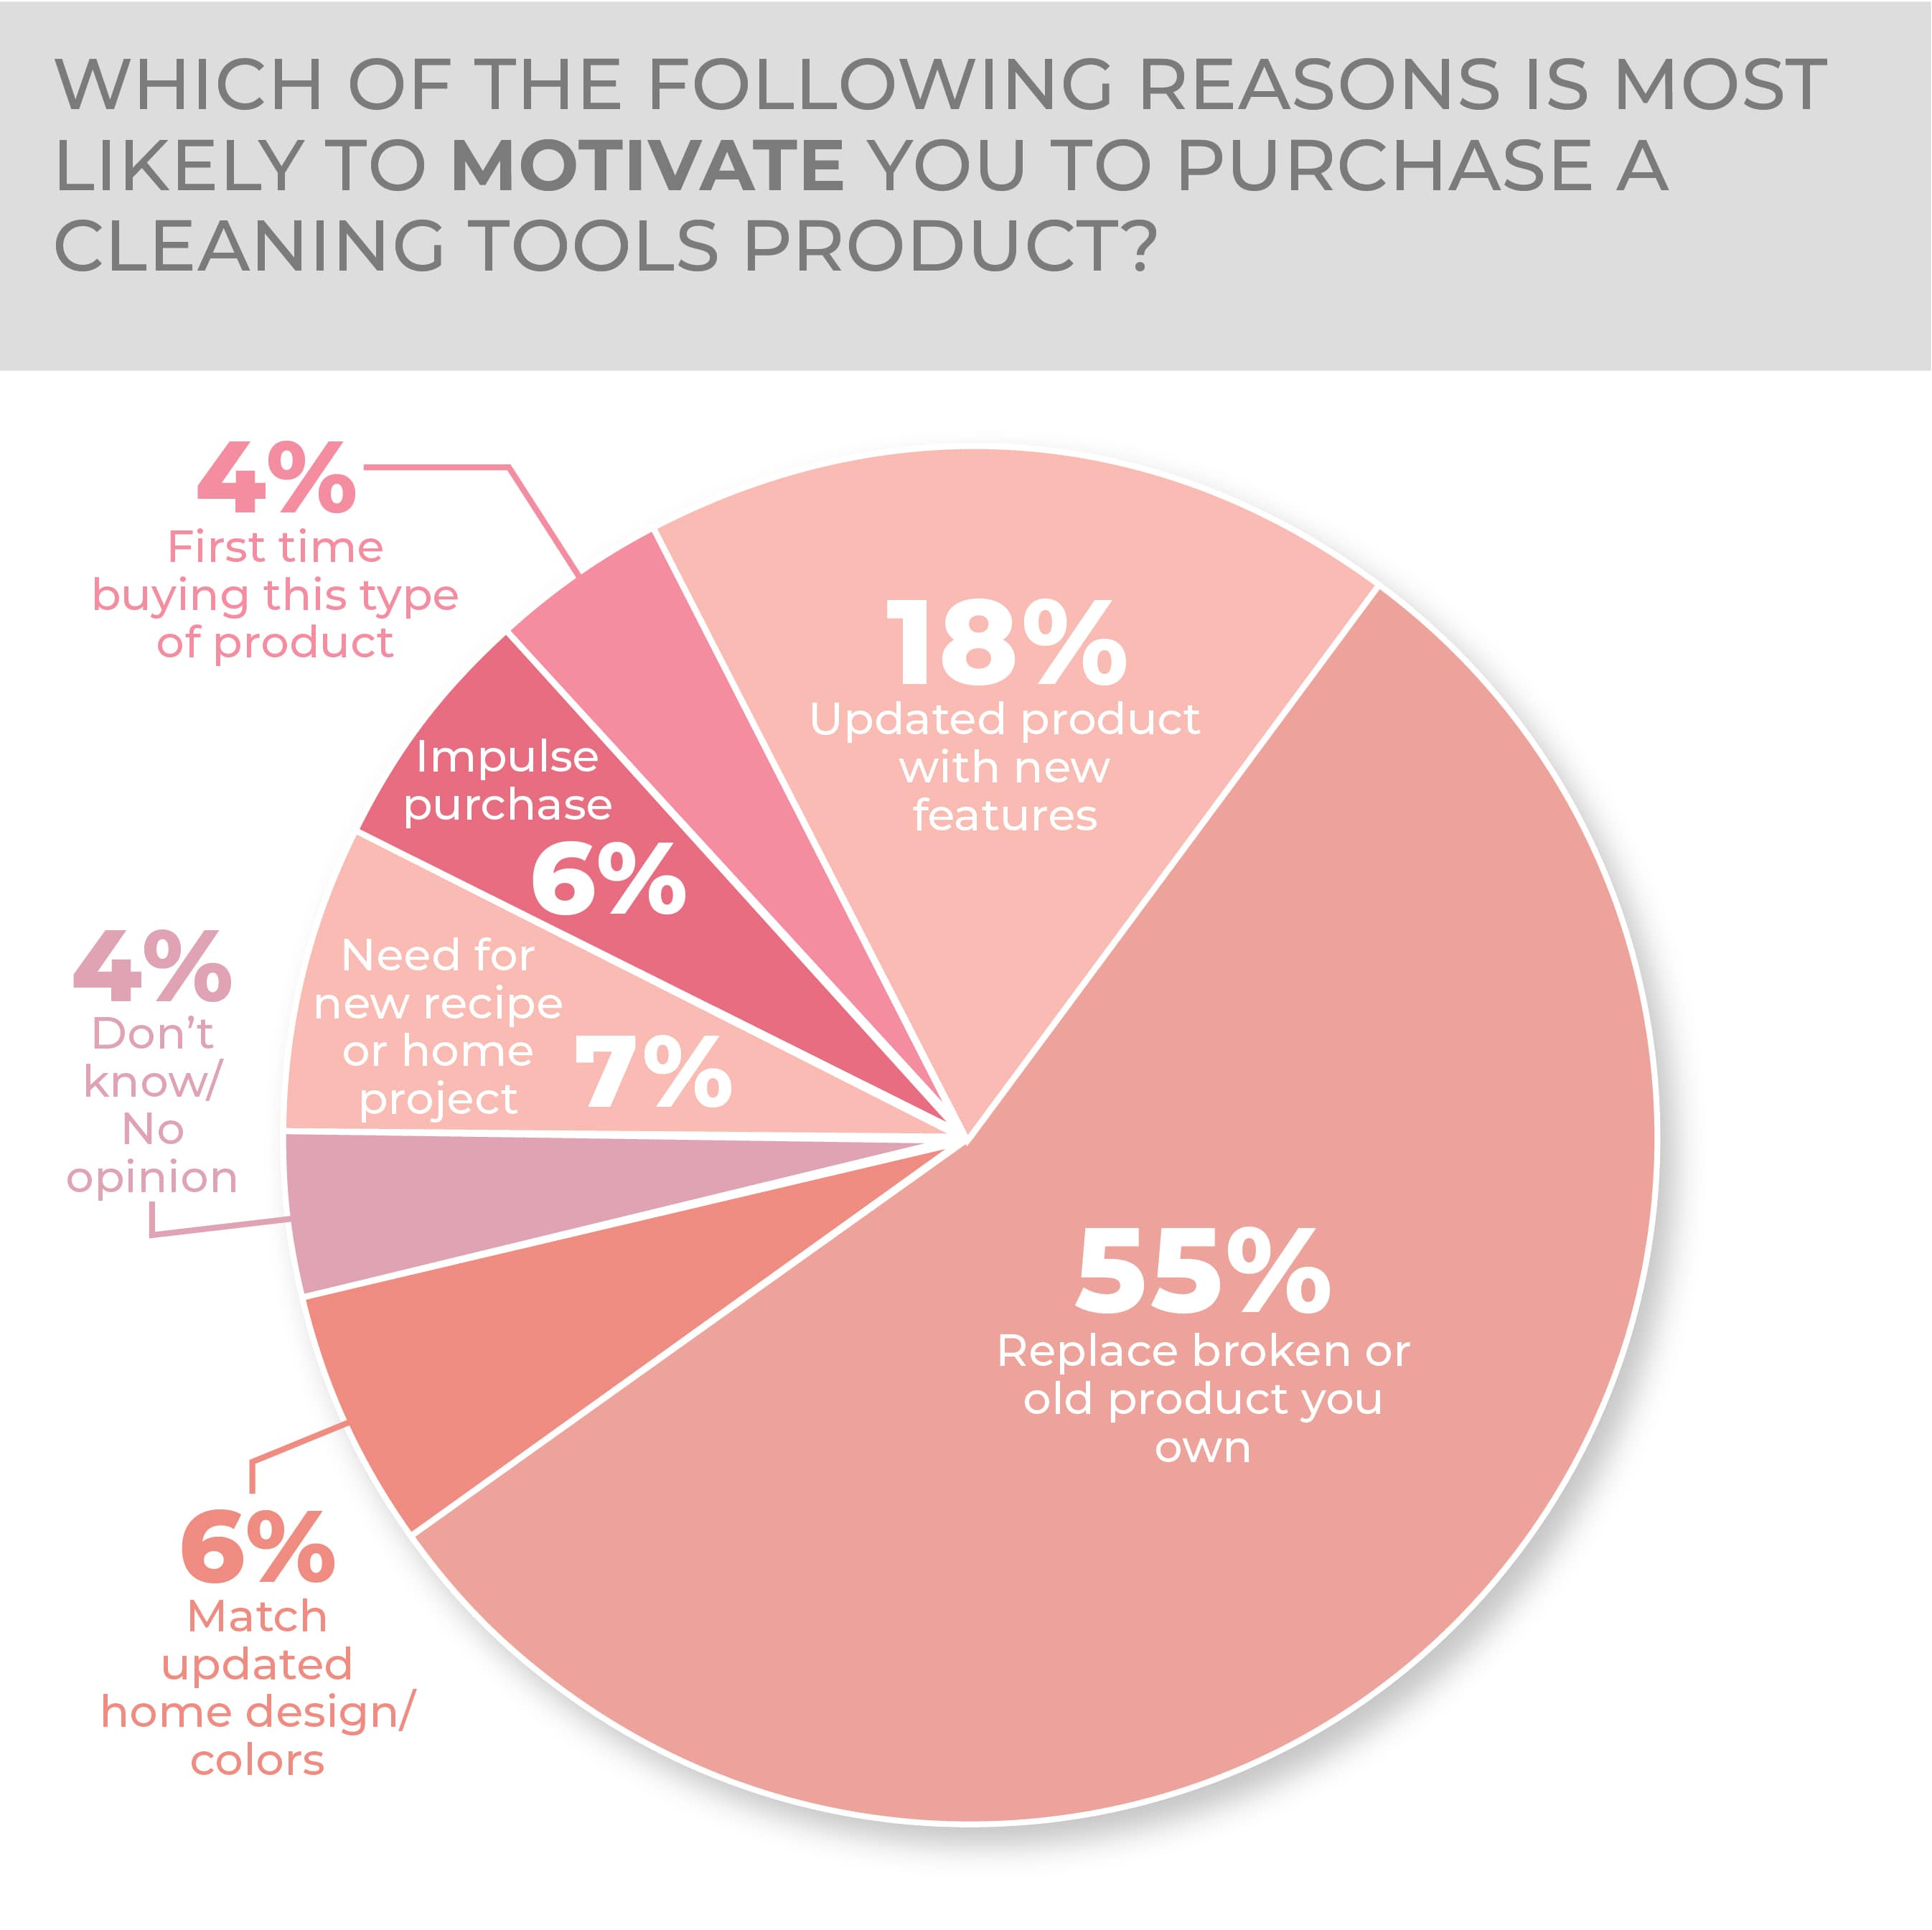
Replacement is the major reason to purchase a cleaning tool, at 55%, while 18% of consumers responding said they would buy for the sake of updated or new features, both near flat from the survey a year past.
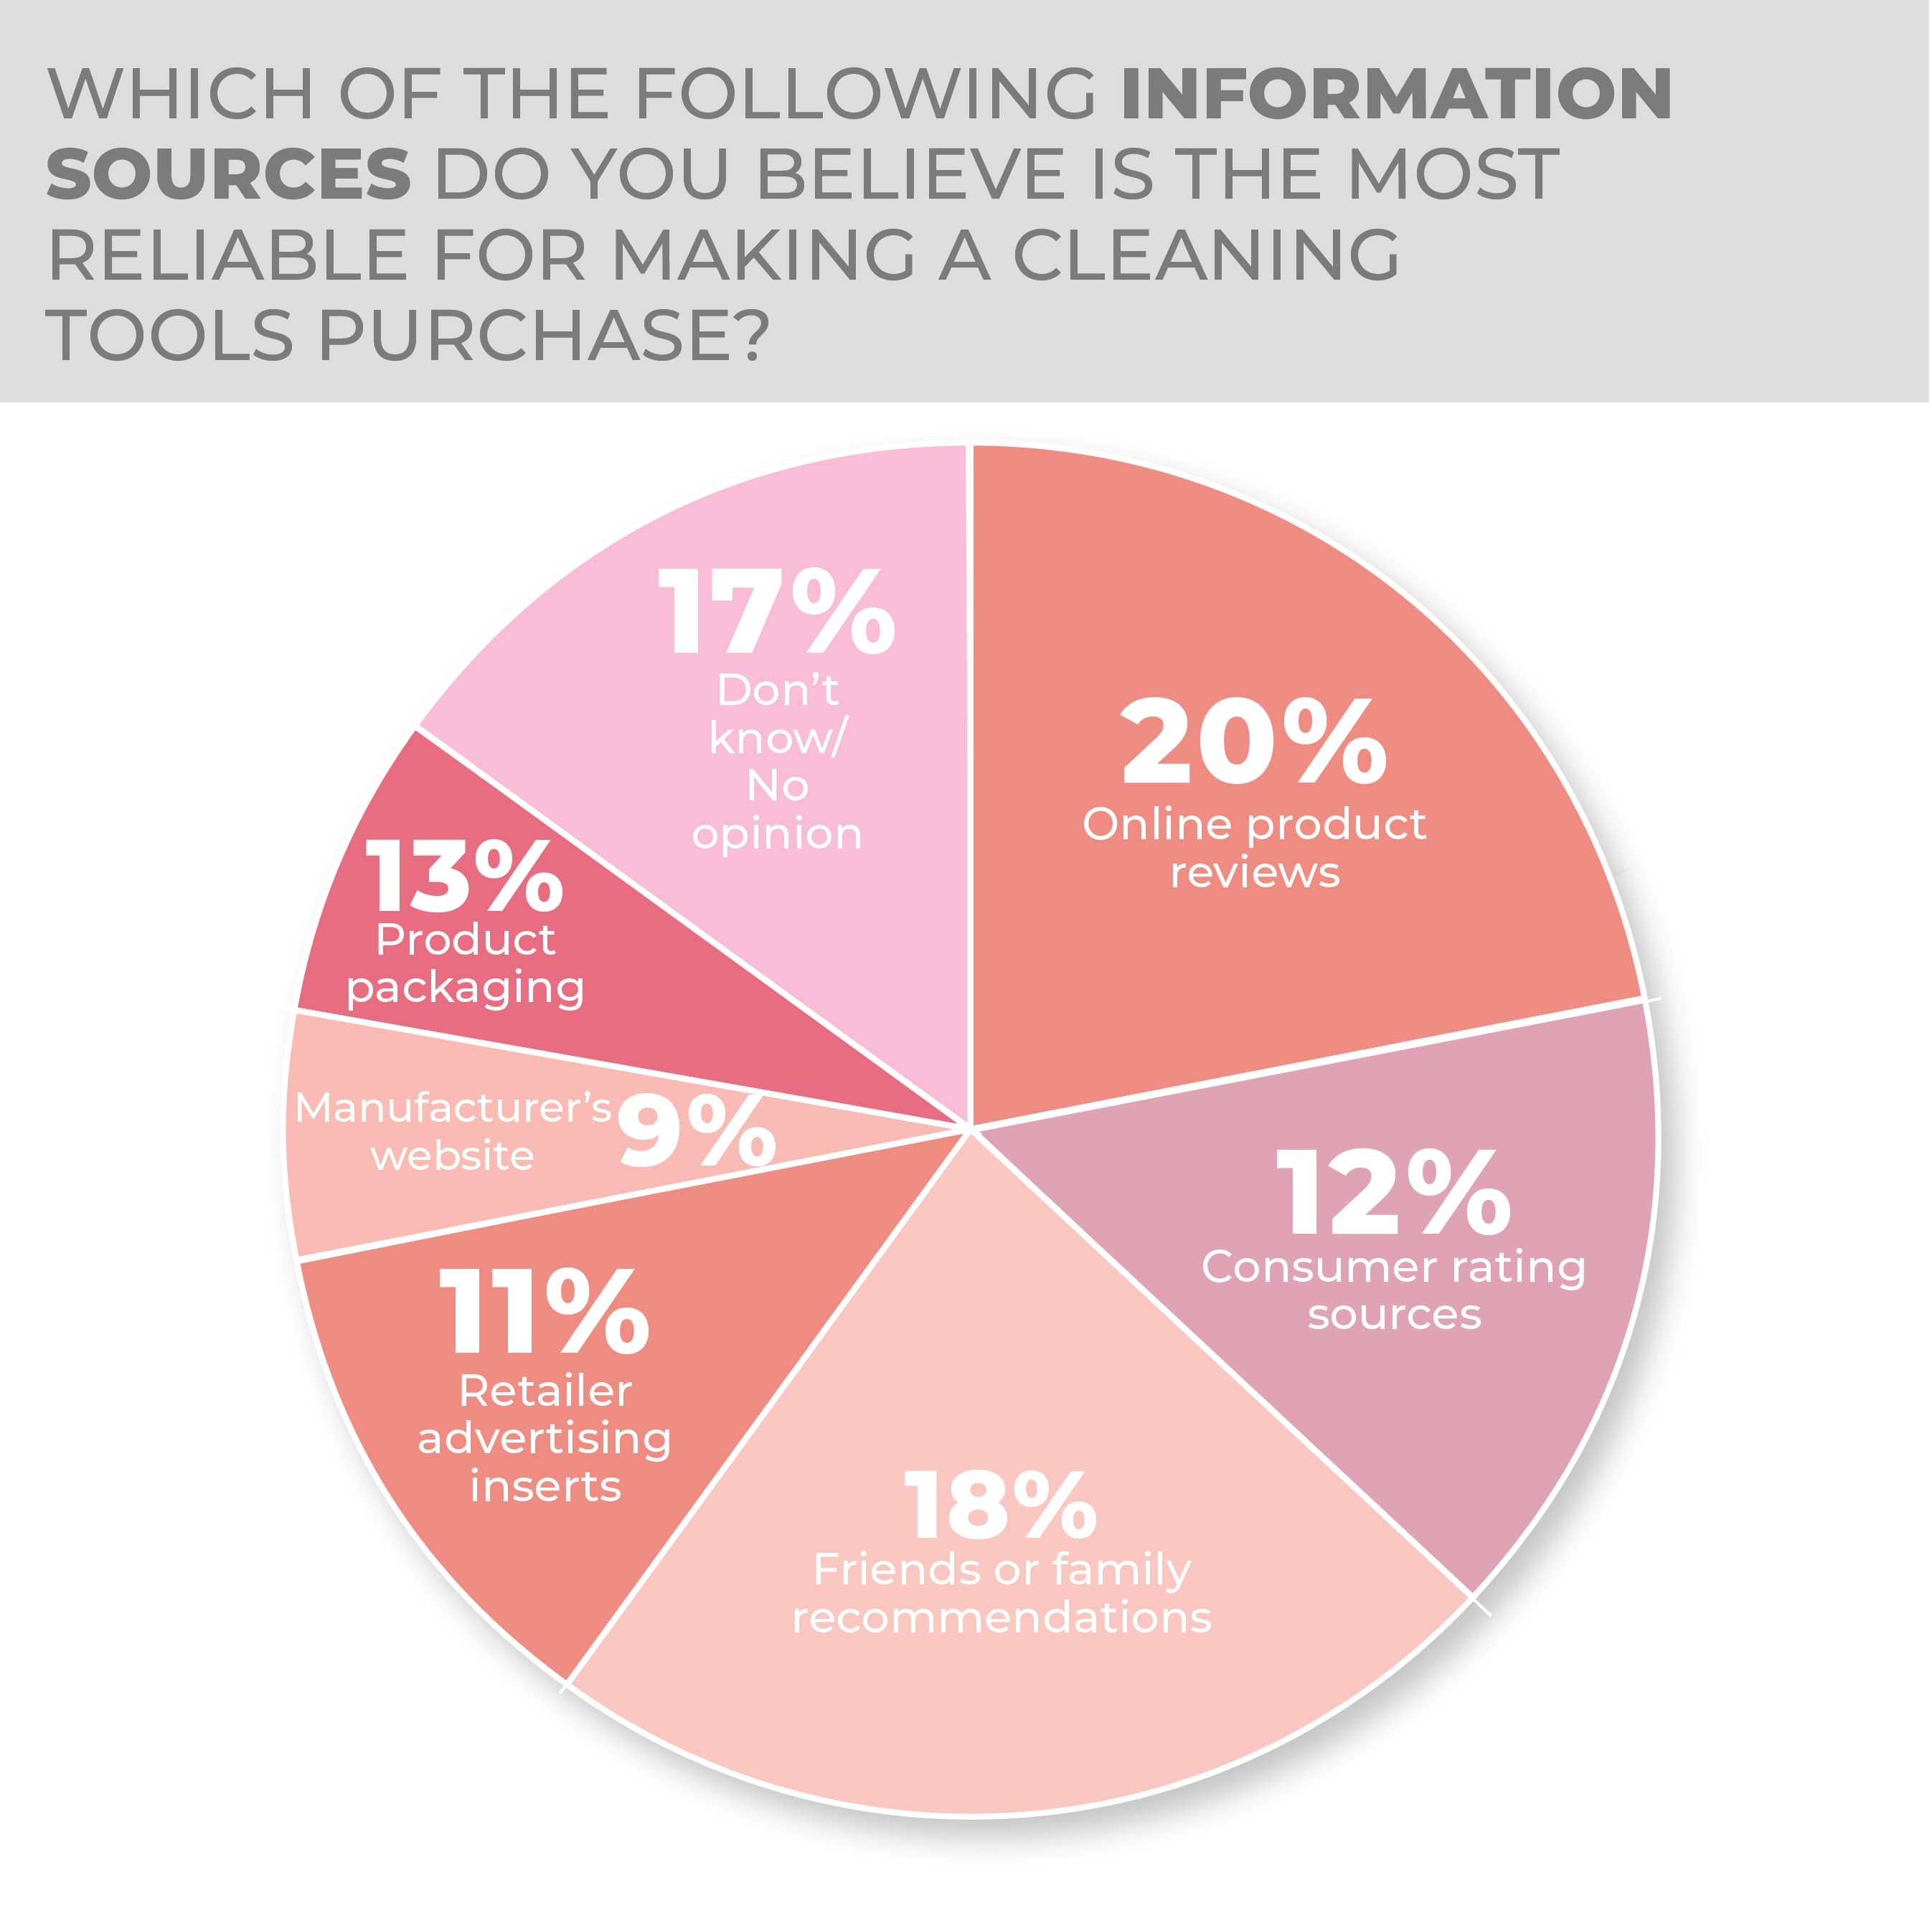
As has been common in this year’s survey, independent sources proved slightly less popular year over year with consumers looking for purchase information: online product reviews at 20%, and consumer ratings at 12% slipped two and three points respectively year over year, and friends and family recommendations slid five points to 18%. Retail advertising inserts was flat at 11% but manufacturers’ websites gained three points to 9% and product packaging gained six points to 13%.
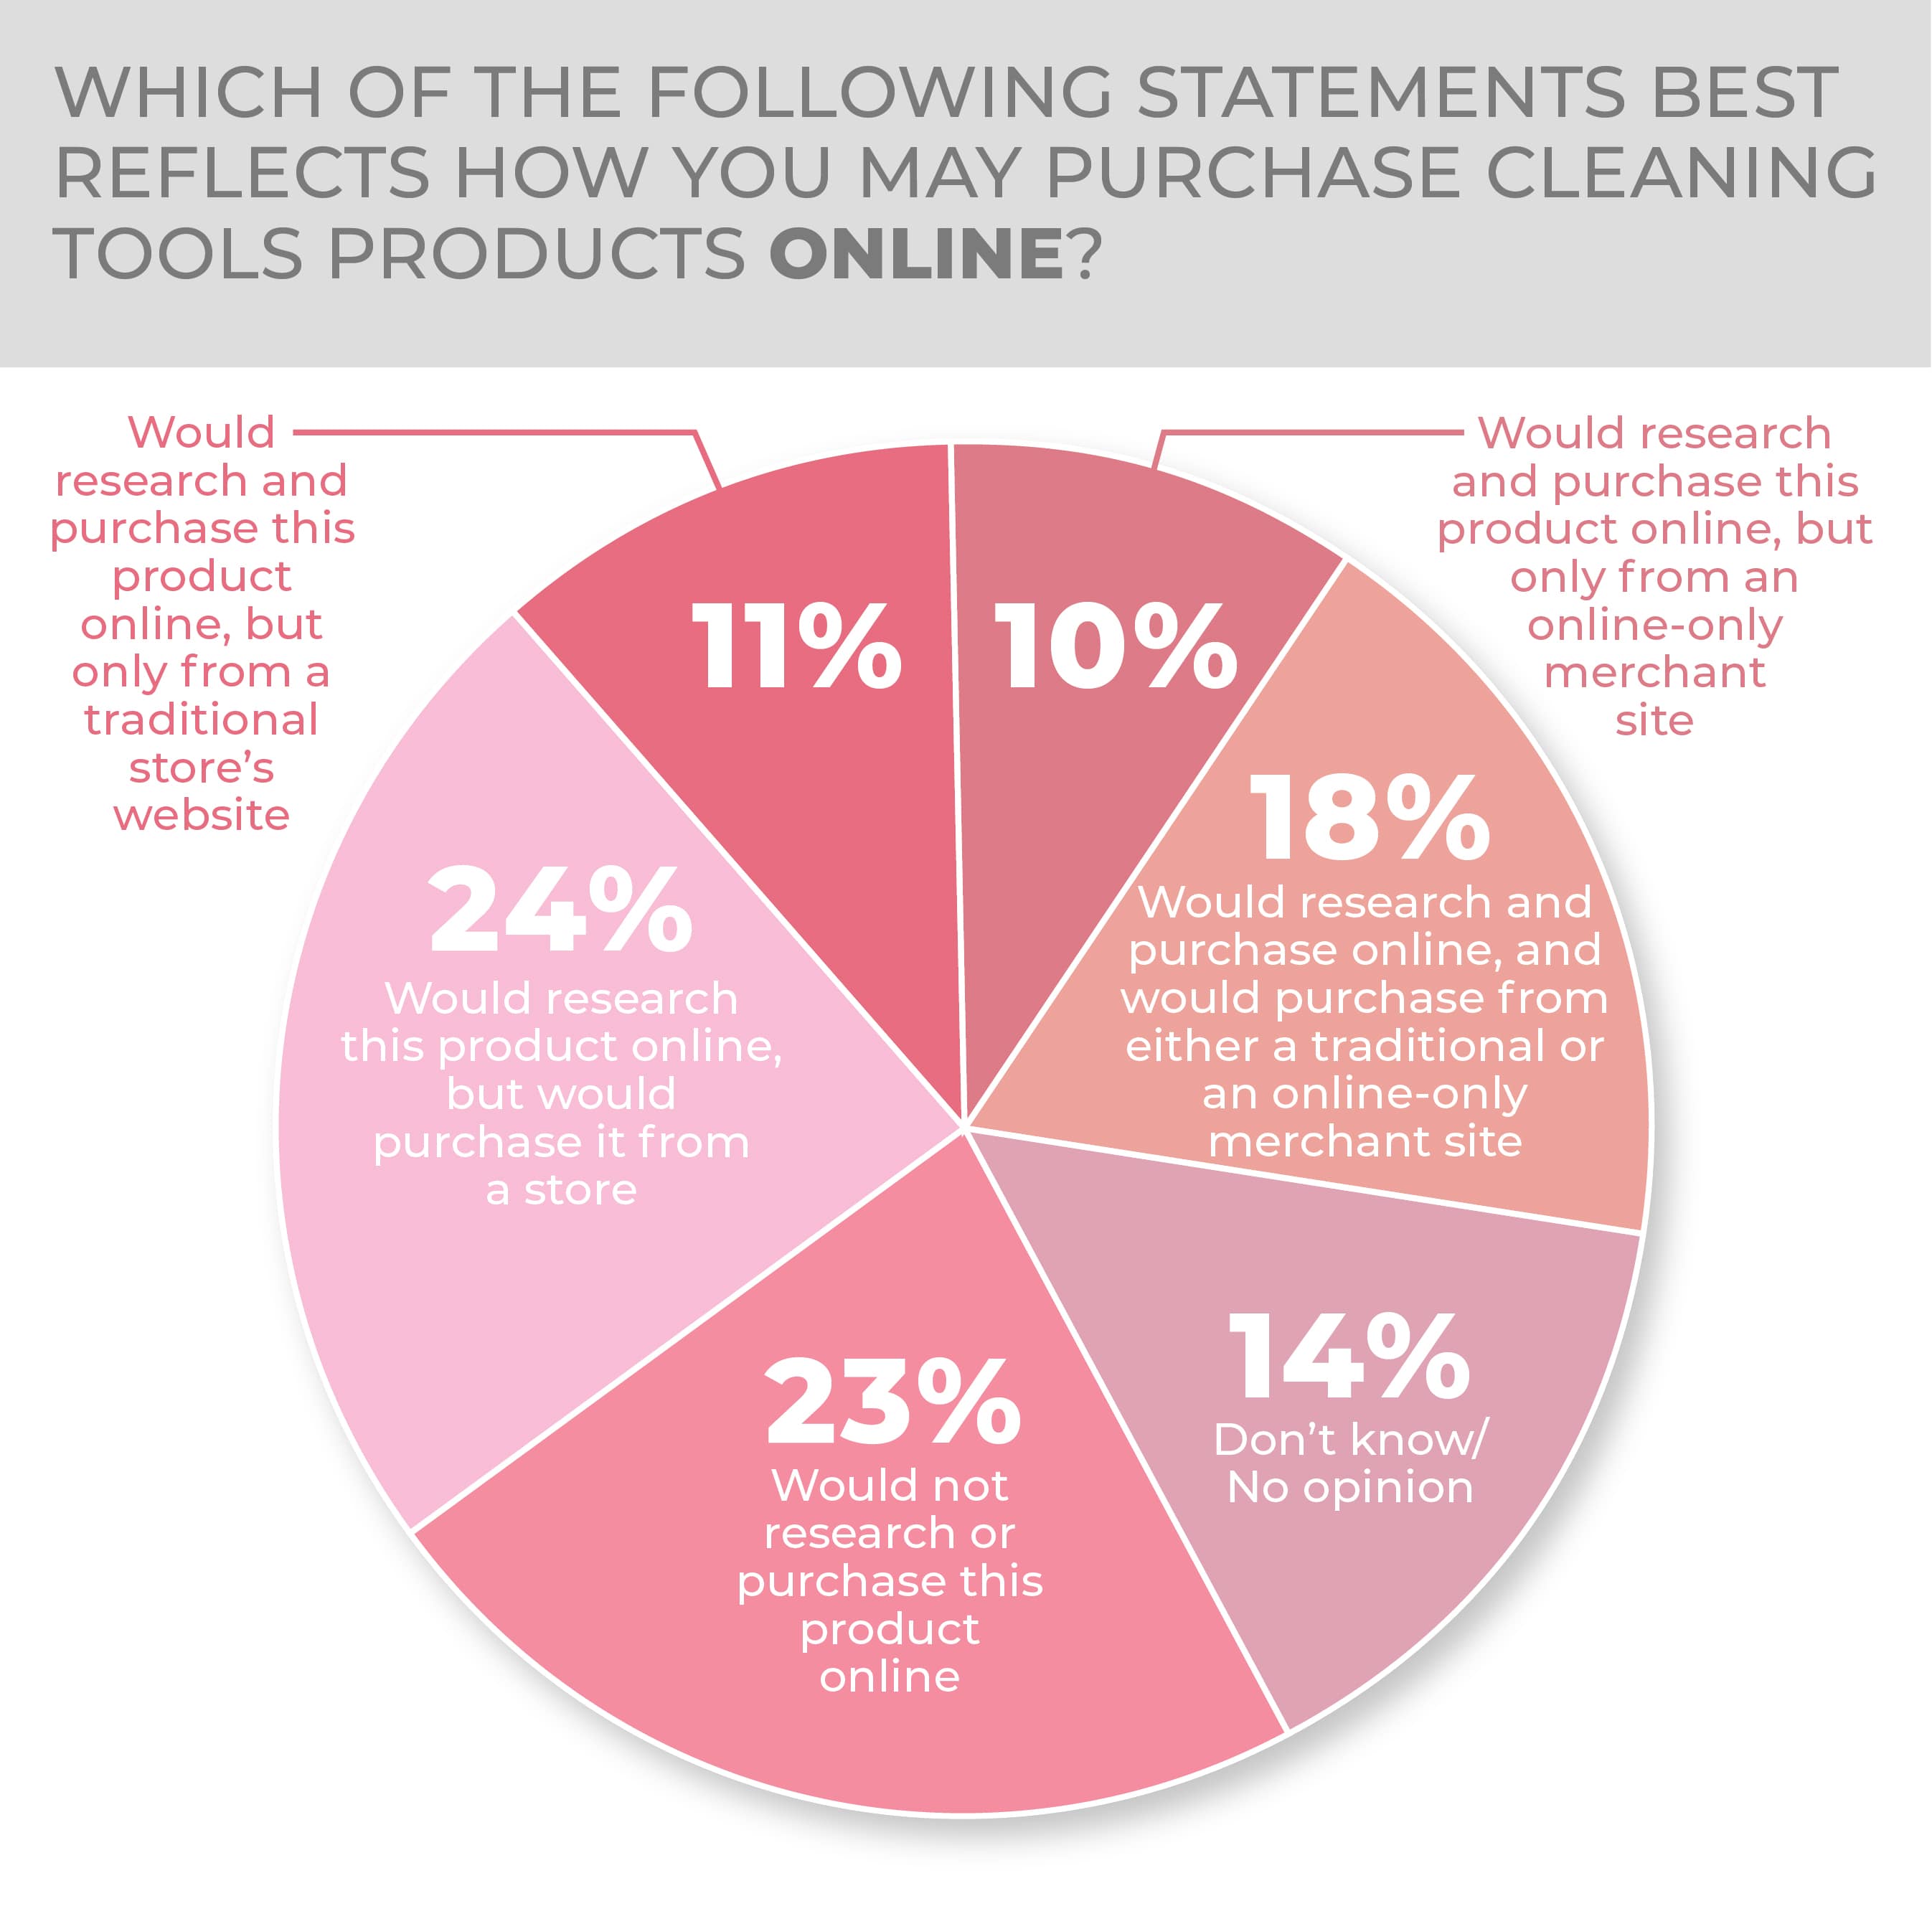
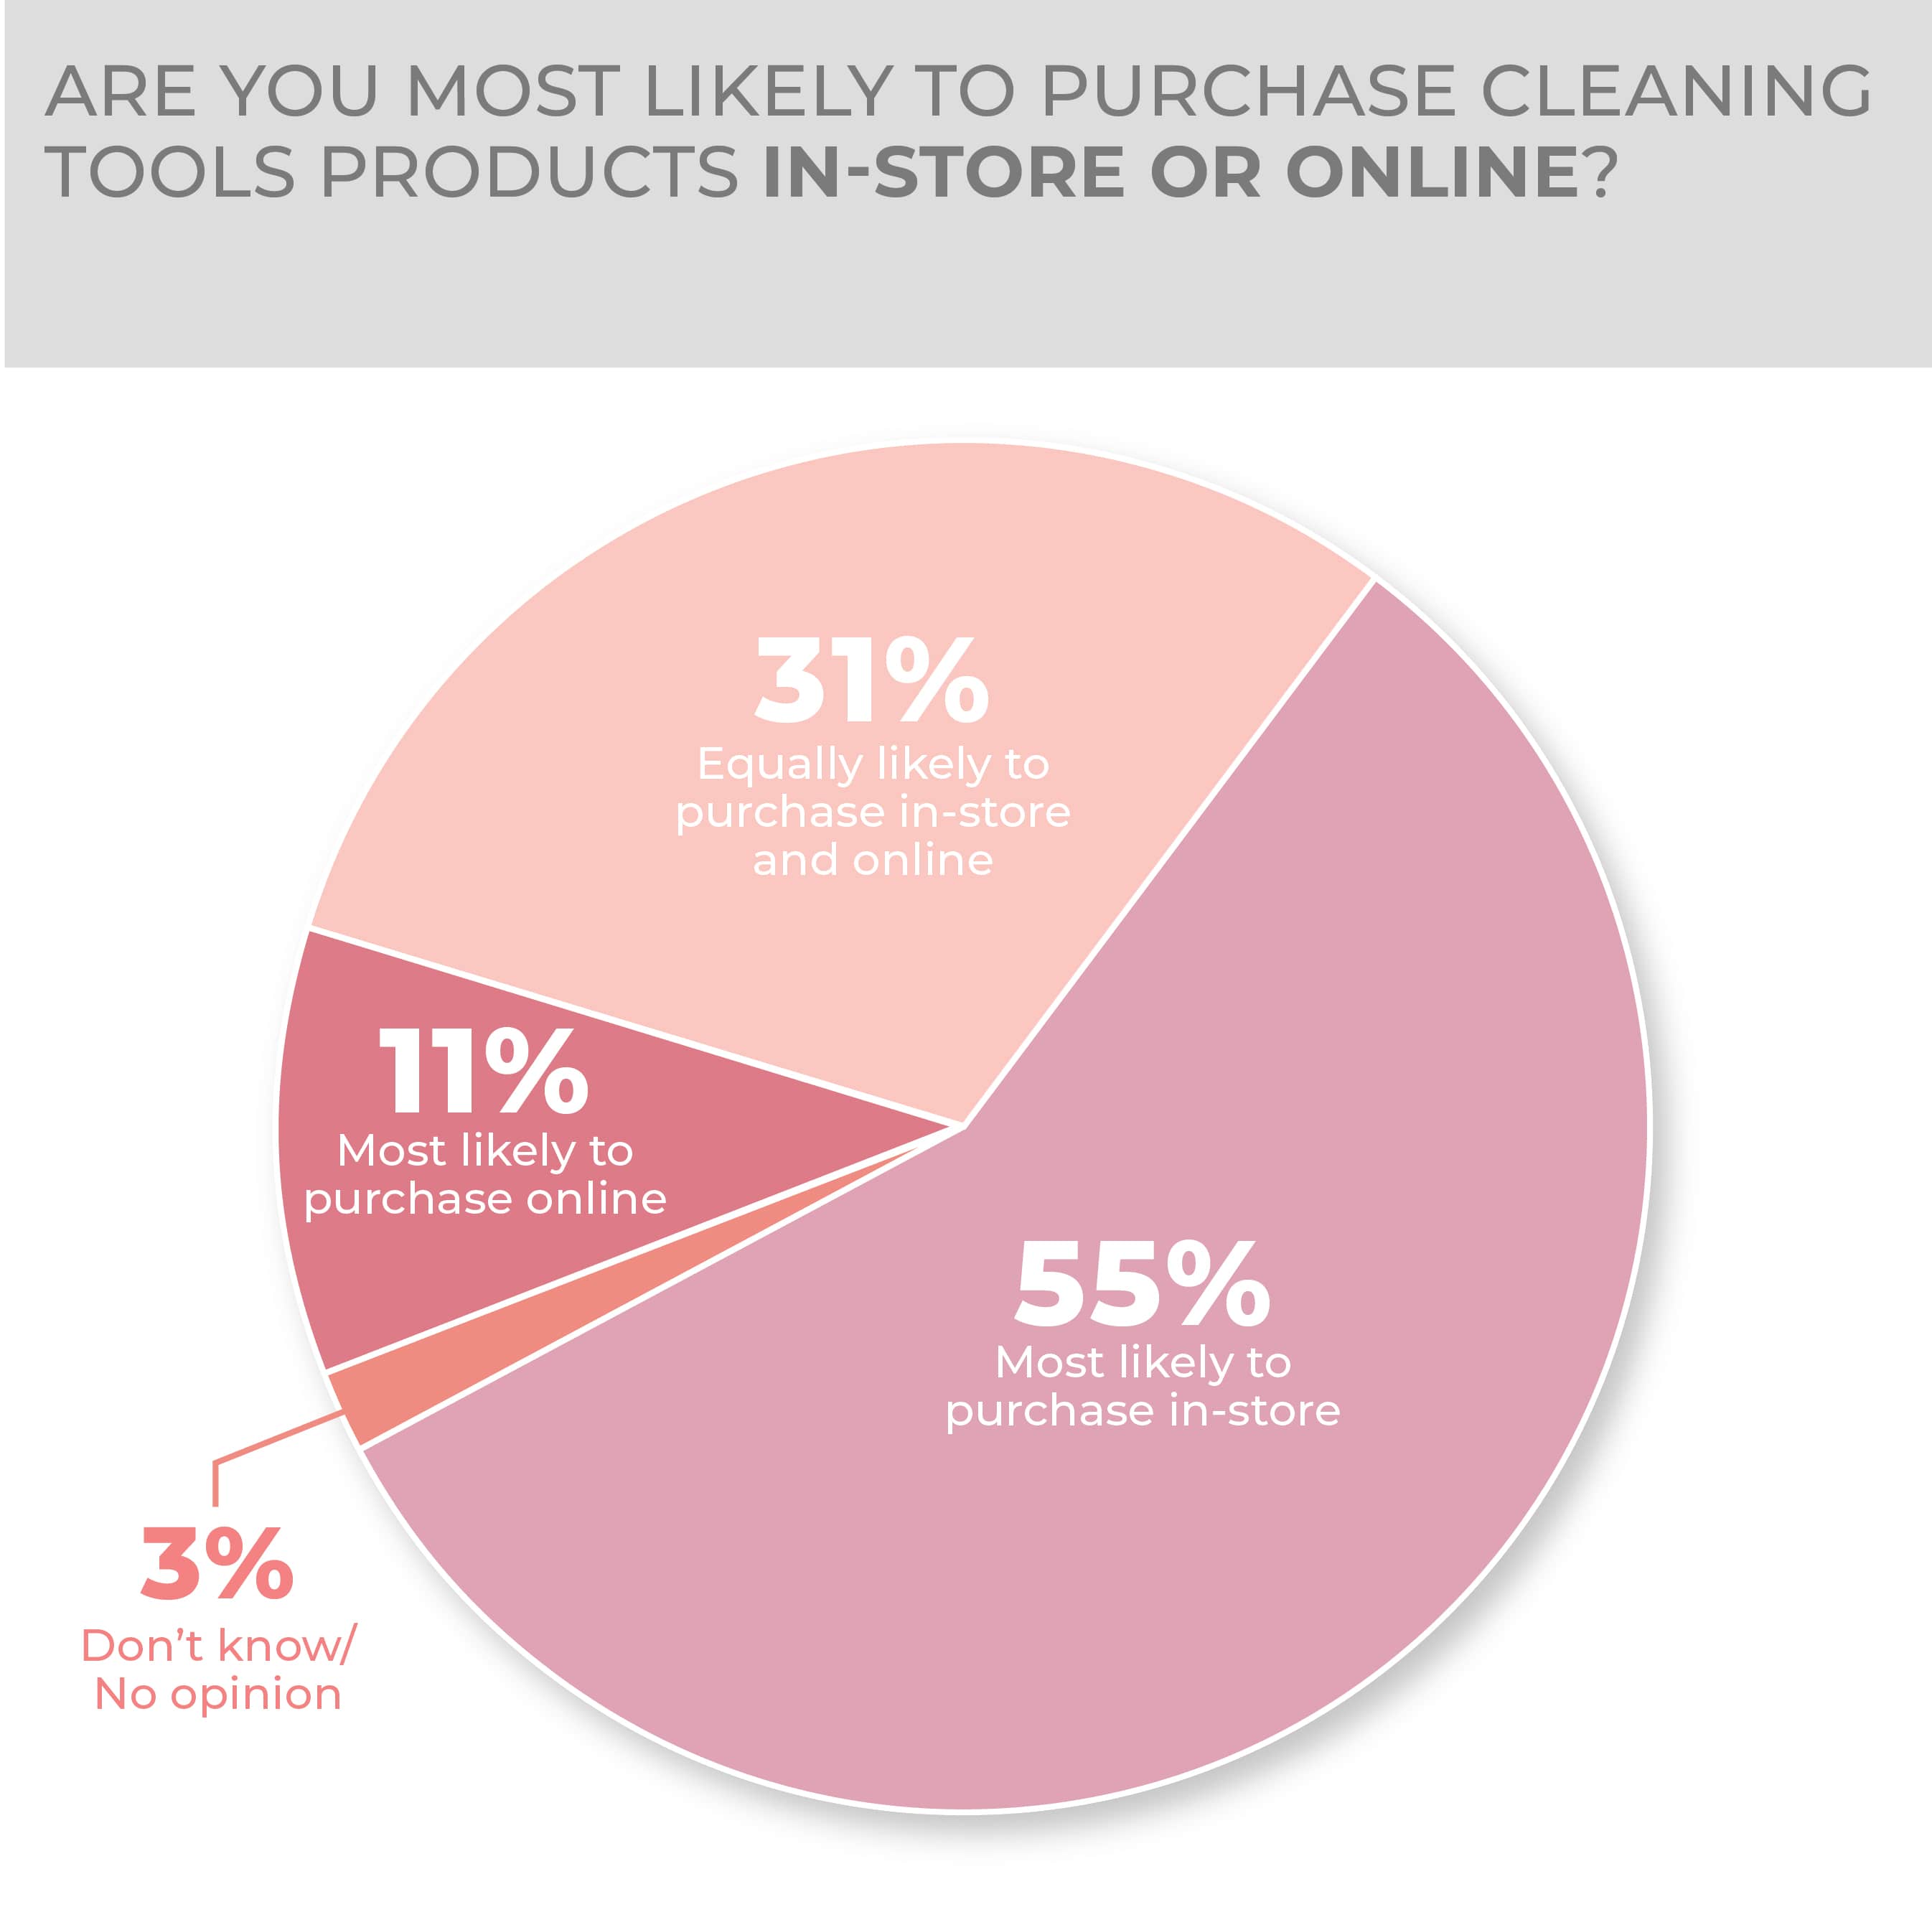
Consumers lean a bit toward in-store purchasing of cleaning tools, so, when asked where they would research and buy, 23% of respondents said they wouldn’t do either online and 24% said research online, buy from a store. In contrast, 11% of consumers said they would research online and purchase from a traditional store website, 10% said they would research online and purchase from an online-only merchant site and 18% said they would research online and purchase from either a traditional or online store website. Research and purchasing sentiments were little changed year over year. Then, when asked to address their preference plainly, 55% of consumers said they would most likely purchase in-store, 31% either online or in-store and 11% online.
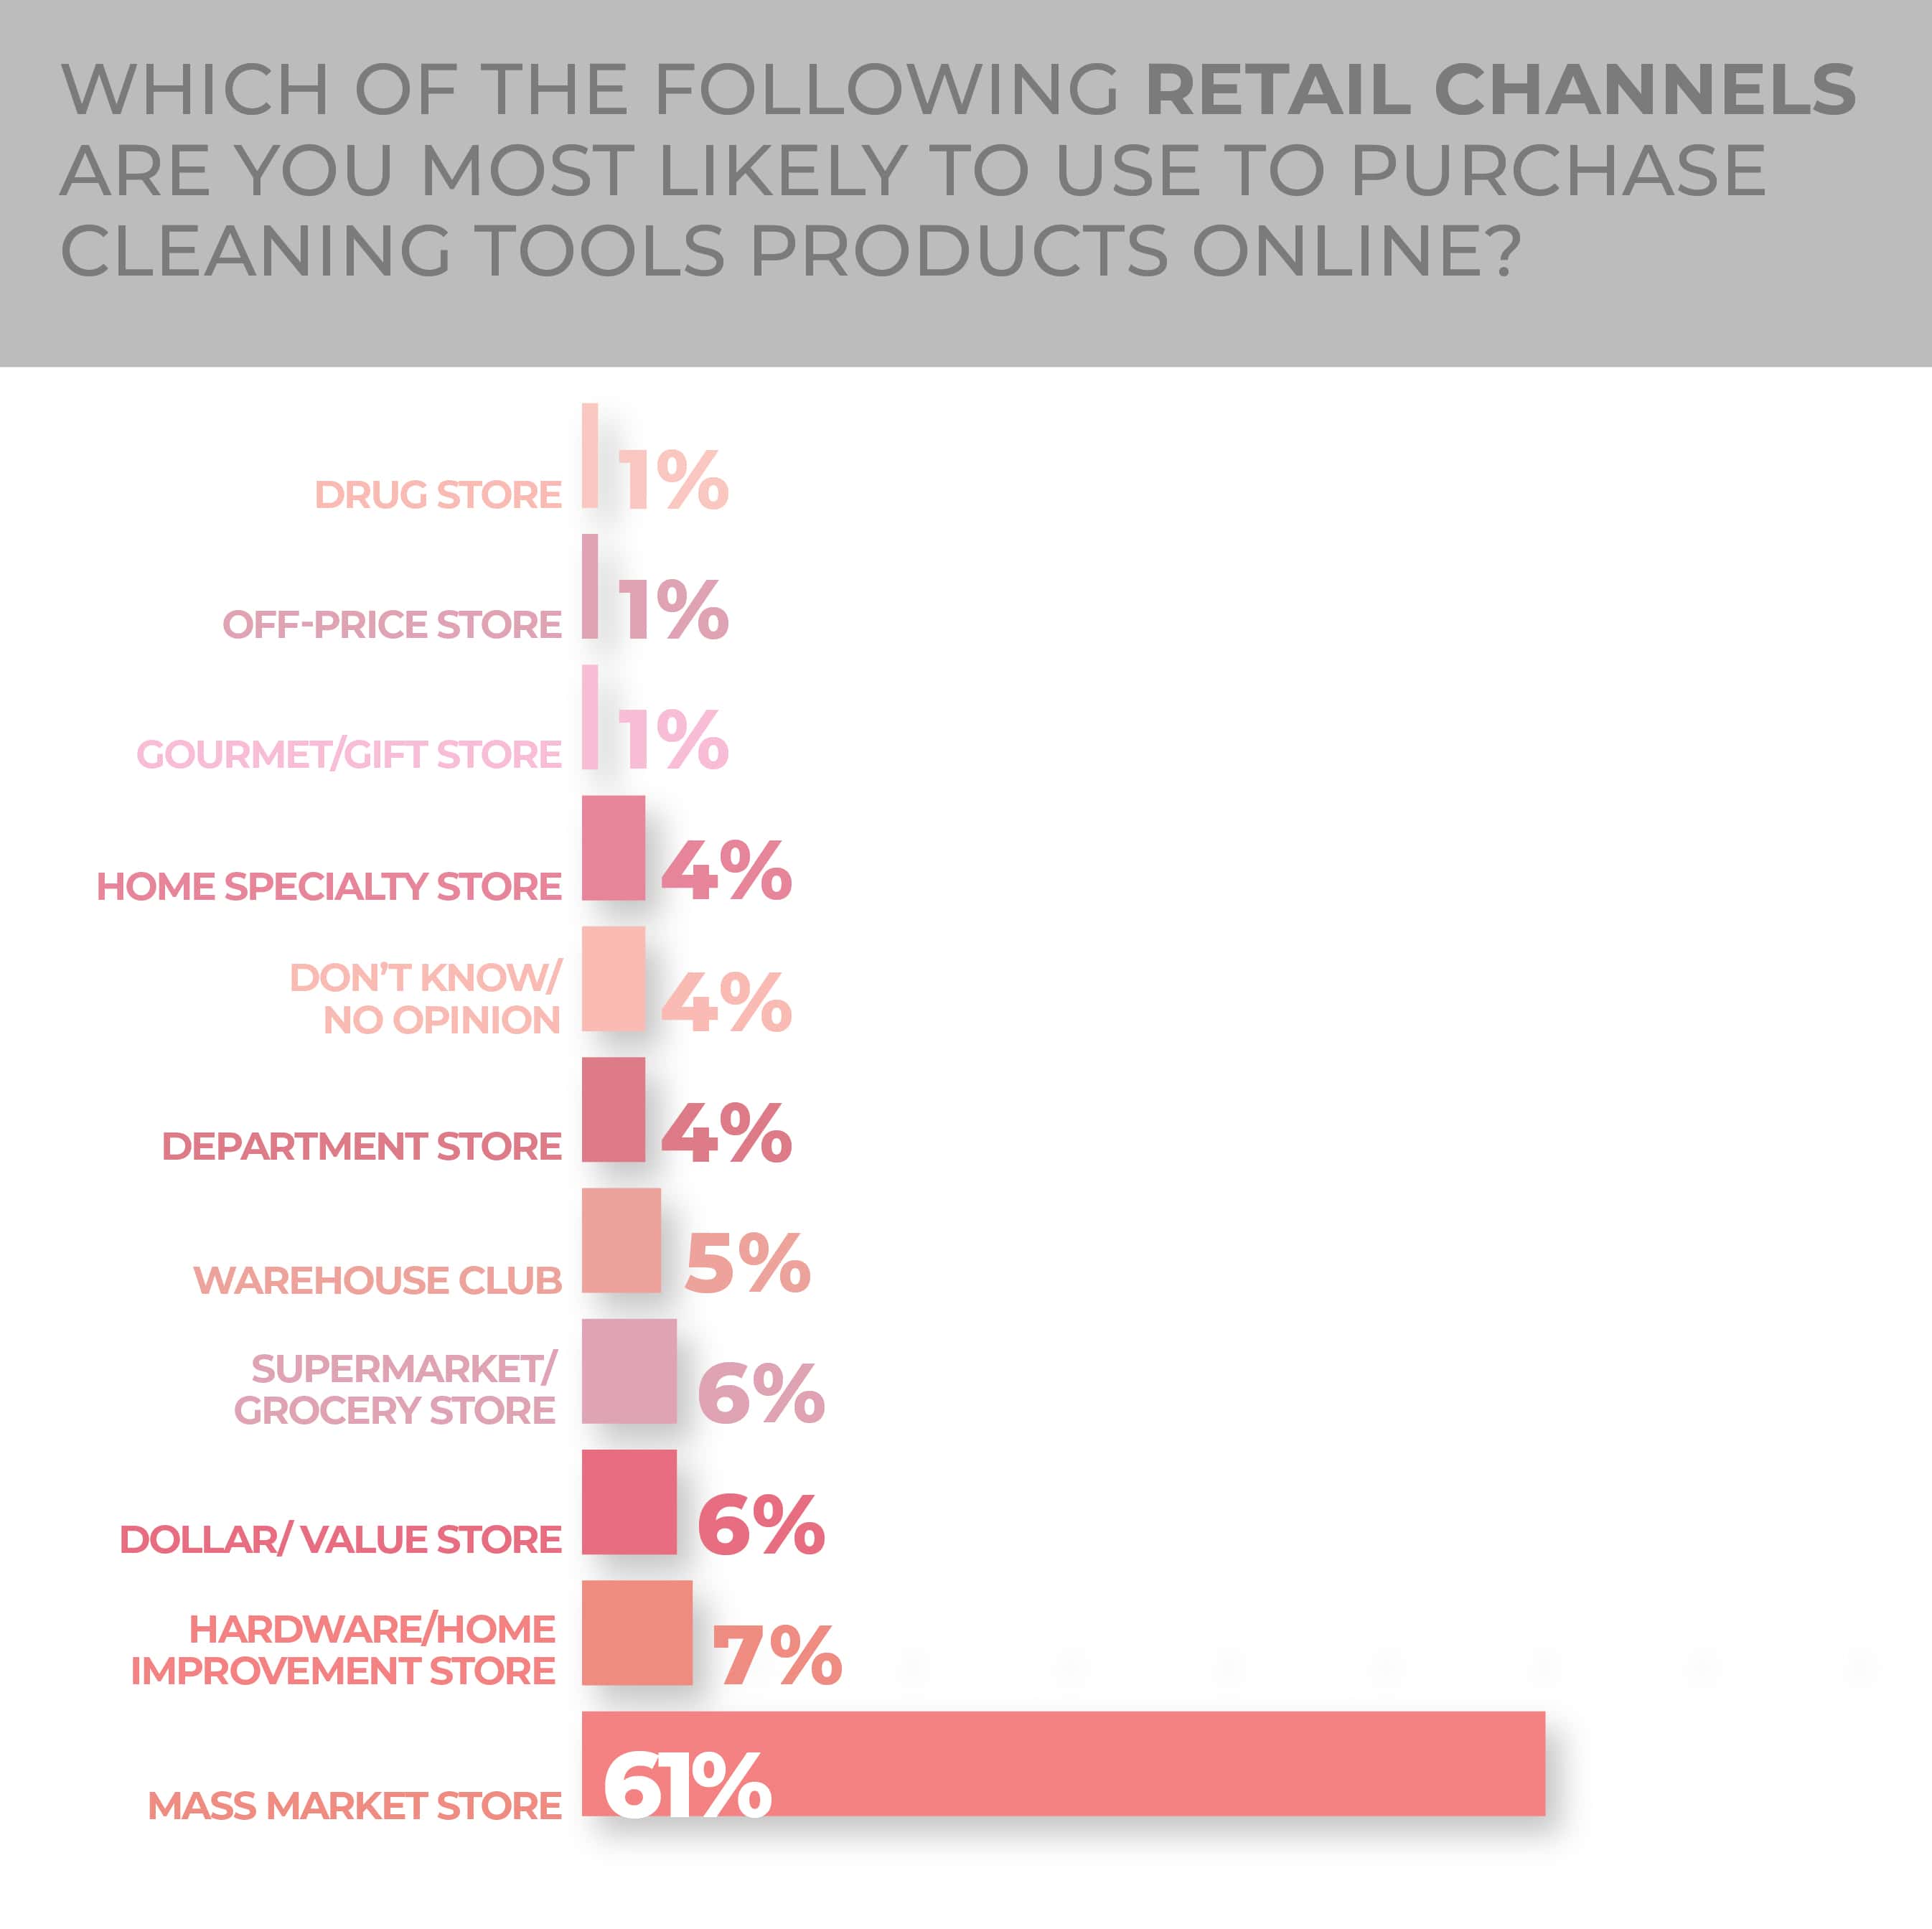
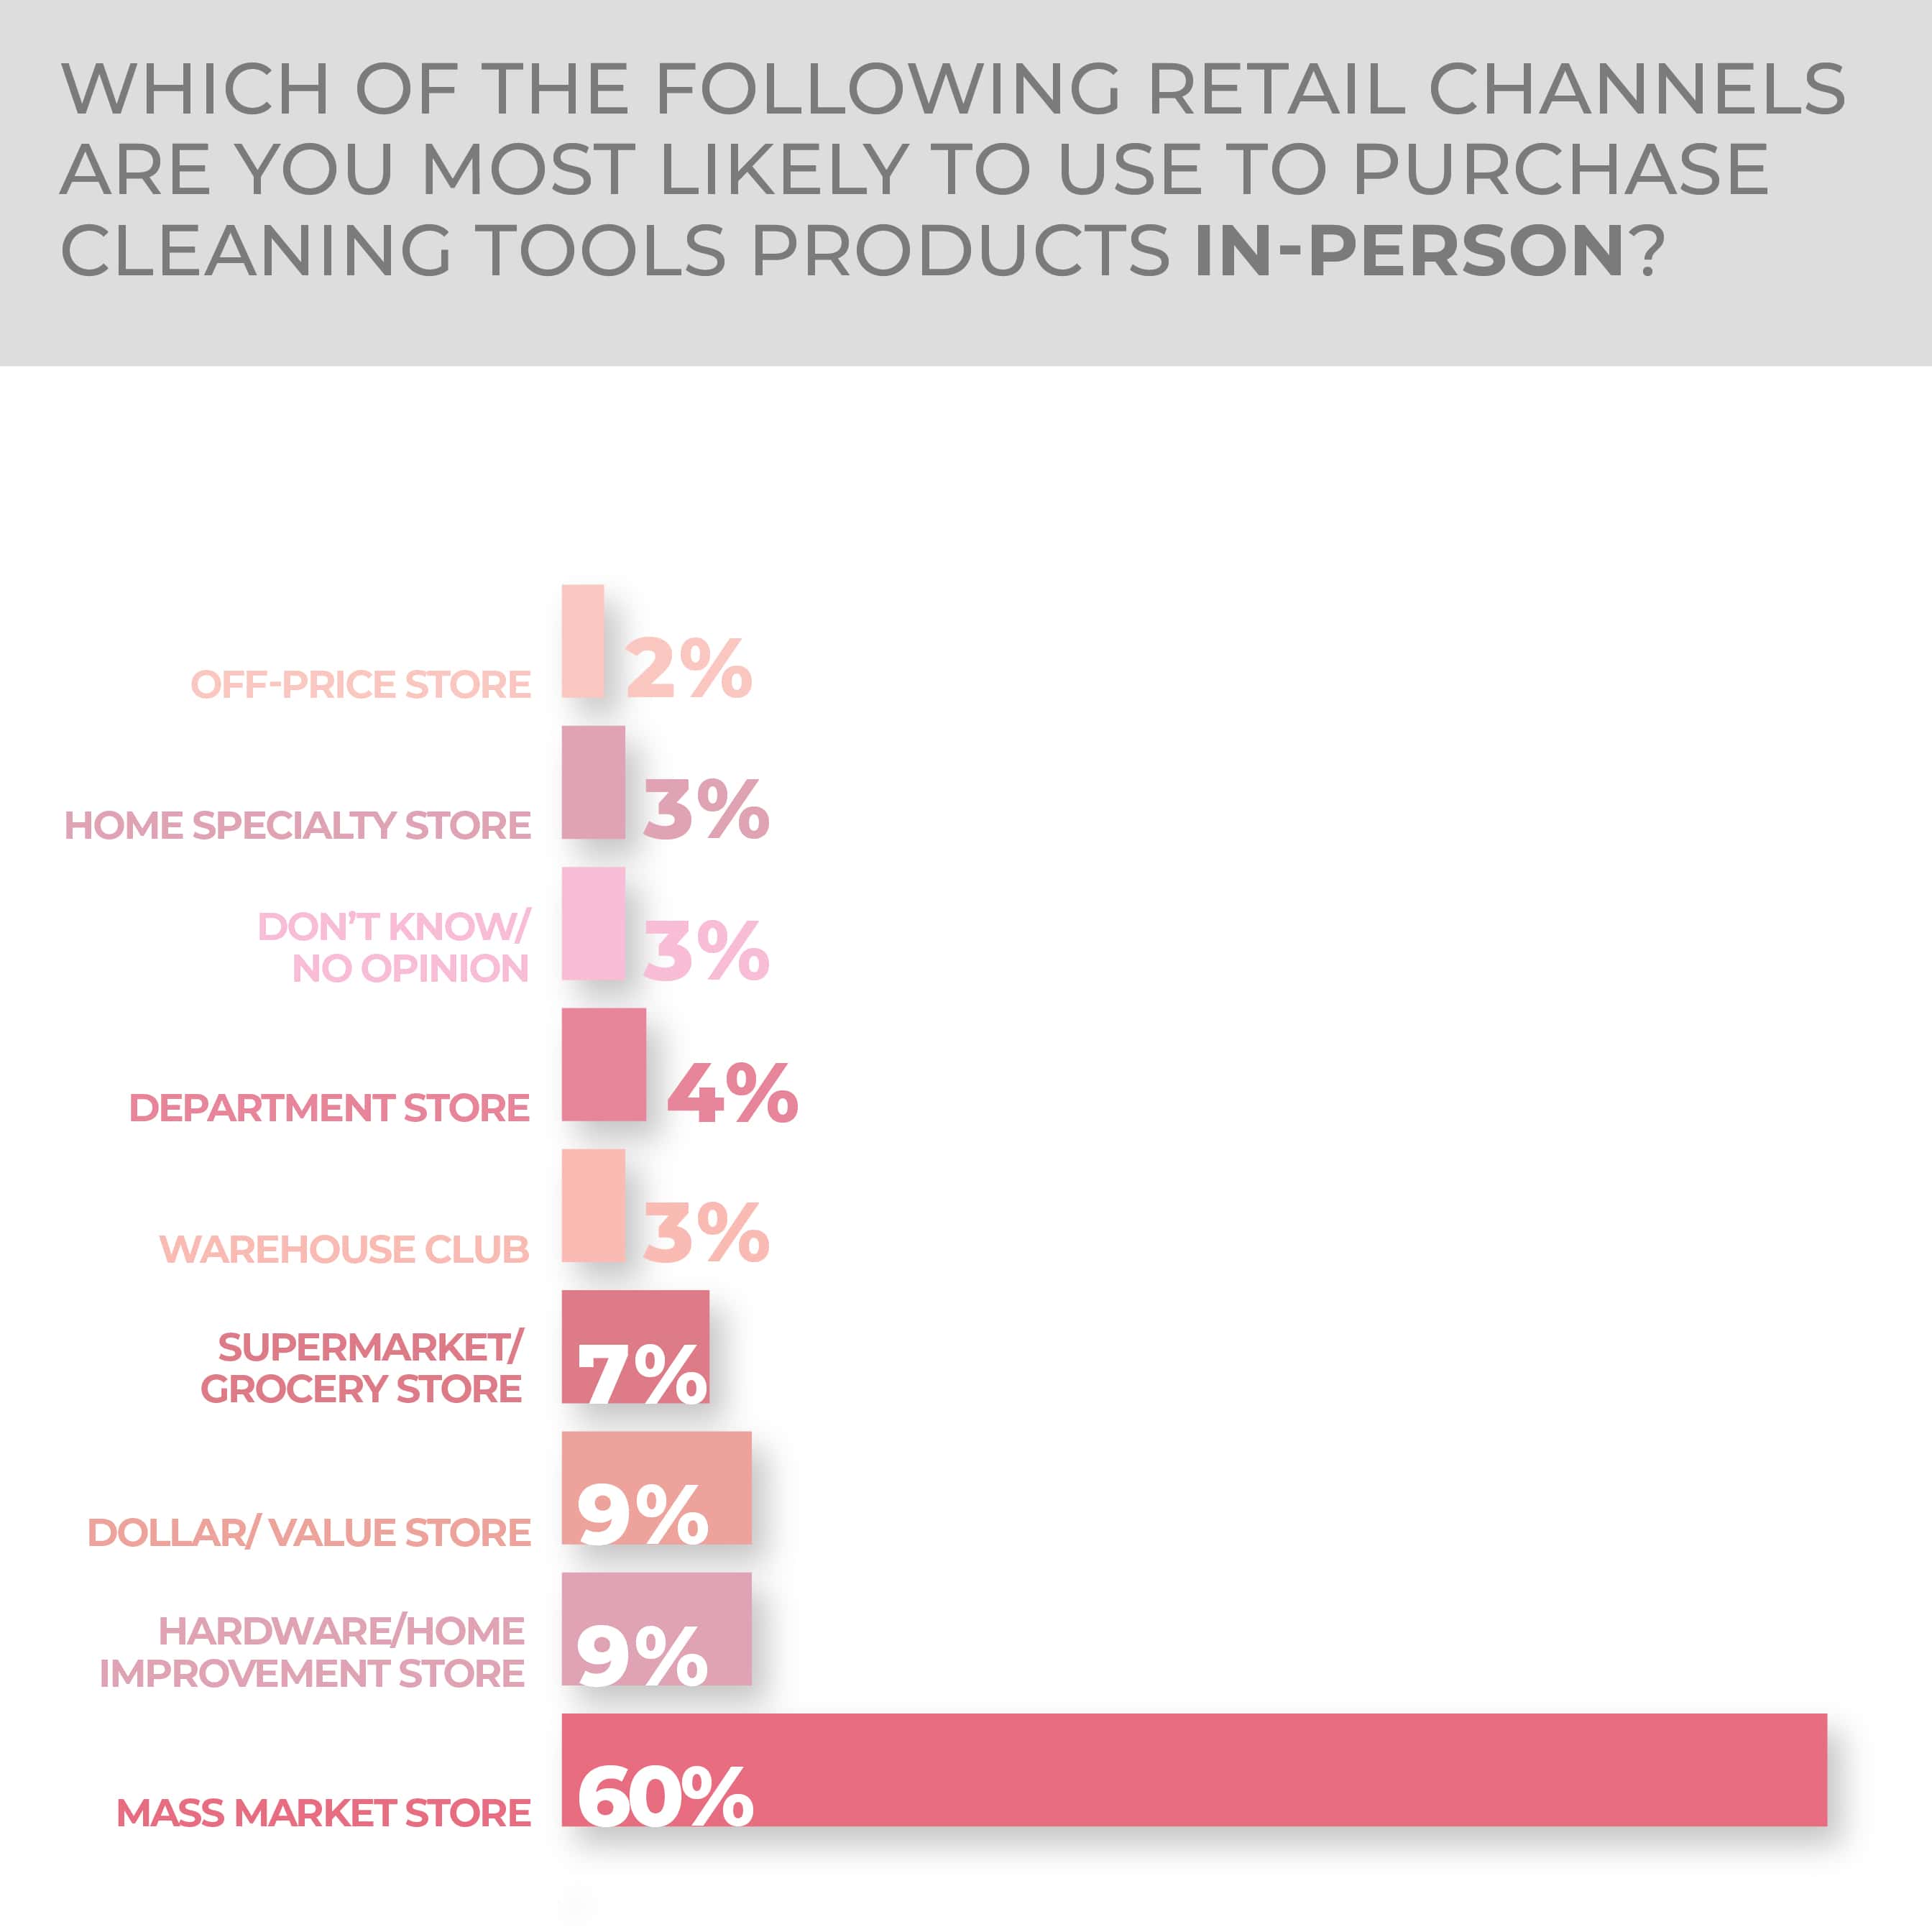
Mass marketers have a dominant portion of the cleaning tools consumer purchase intentions at 60% for in-person buying, then a distant second and tied were hardware or home improvement stores and dollar or value stores both at 9%. It is just about the same in the digital domain, with 61% of survey respondents saying they would buy online from a mass-market retailer, with hardware or home improvement stores second again at 7%.
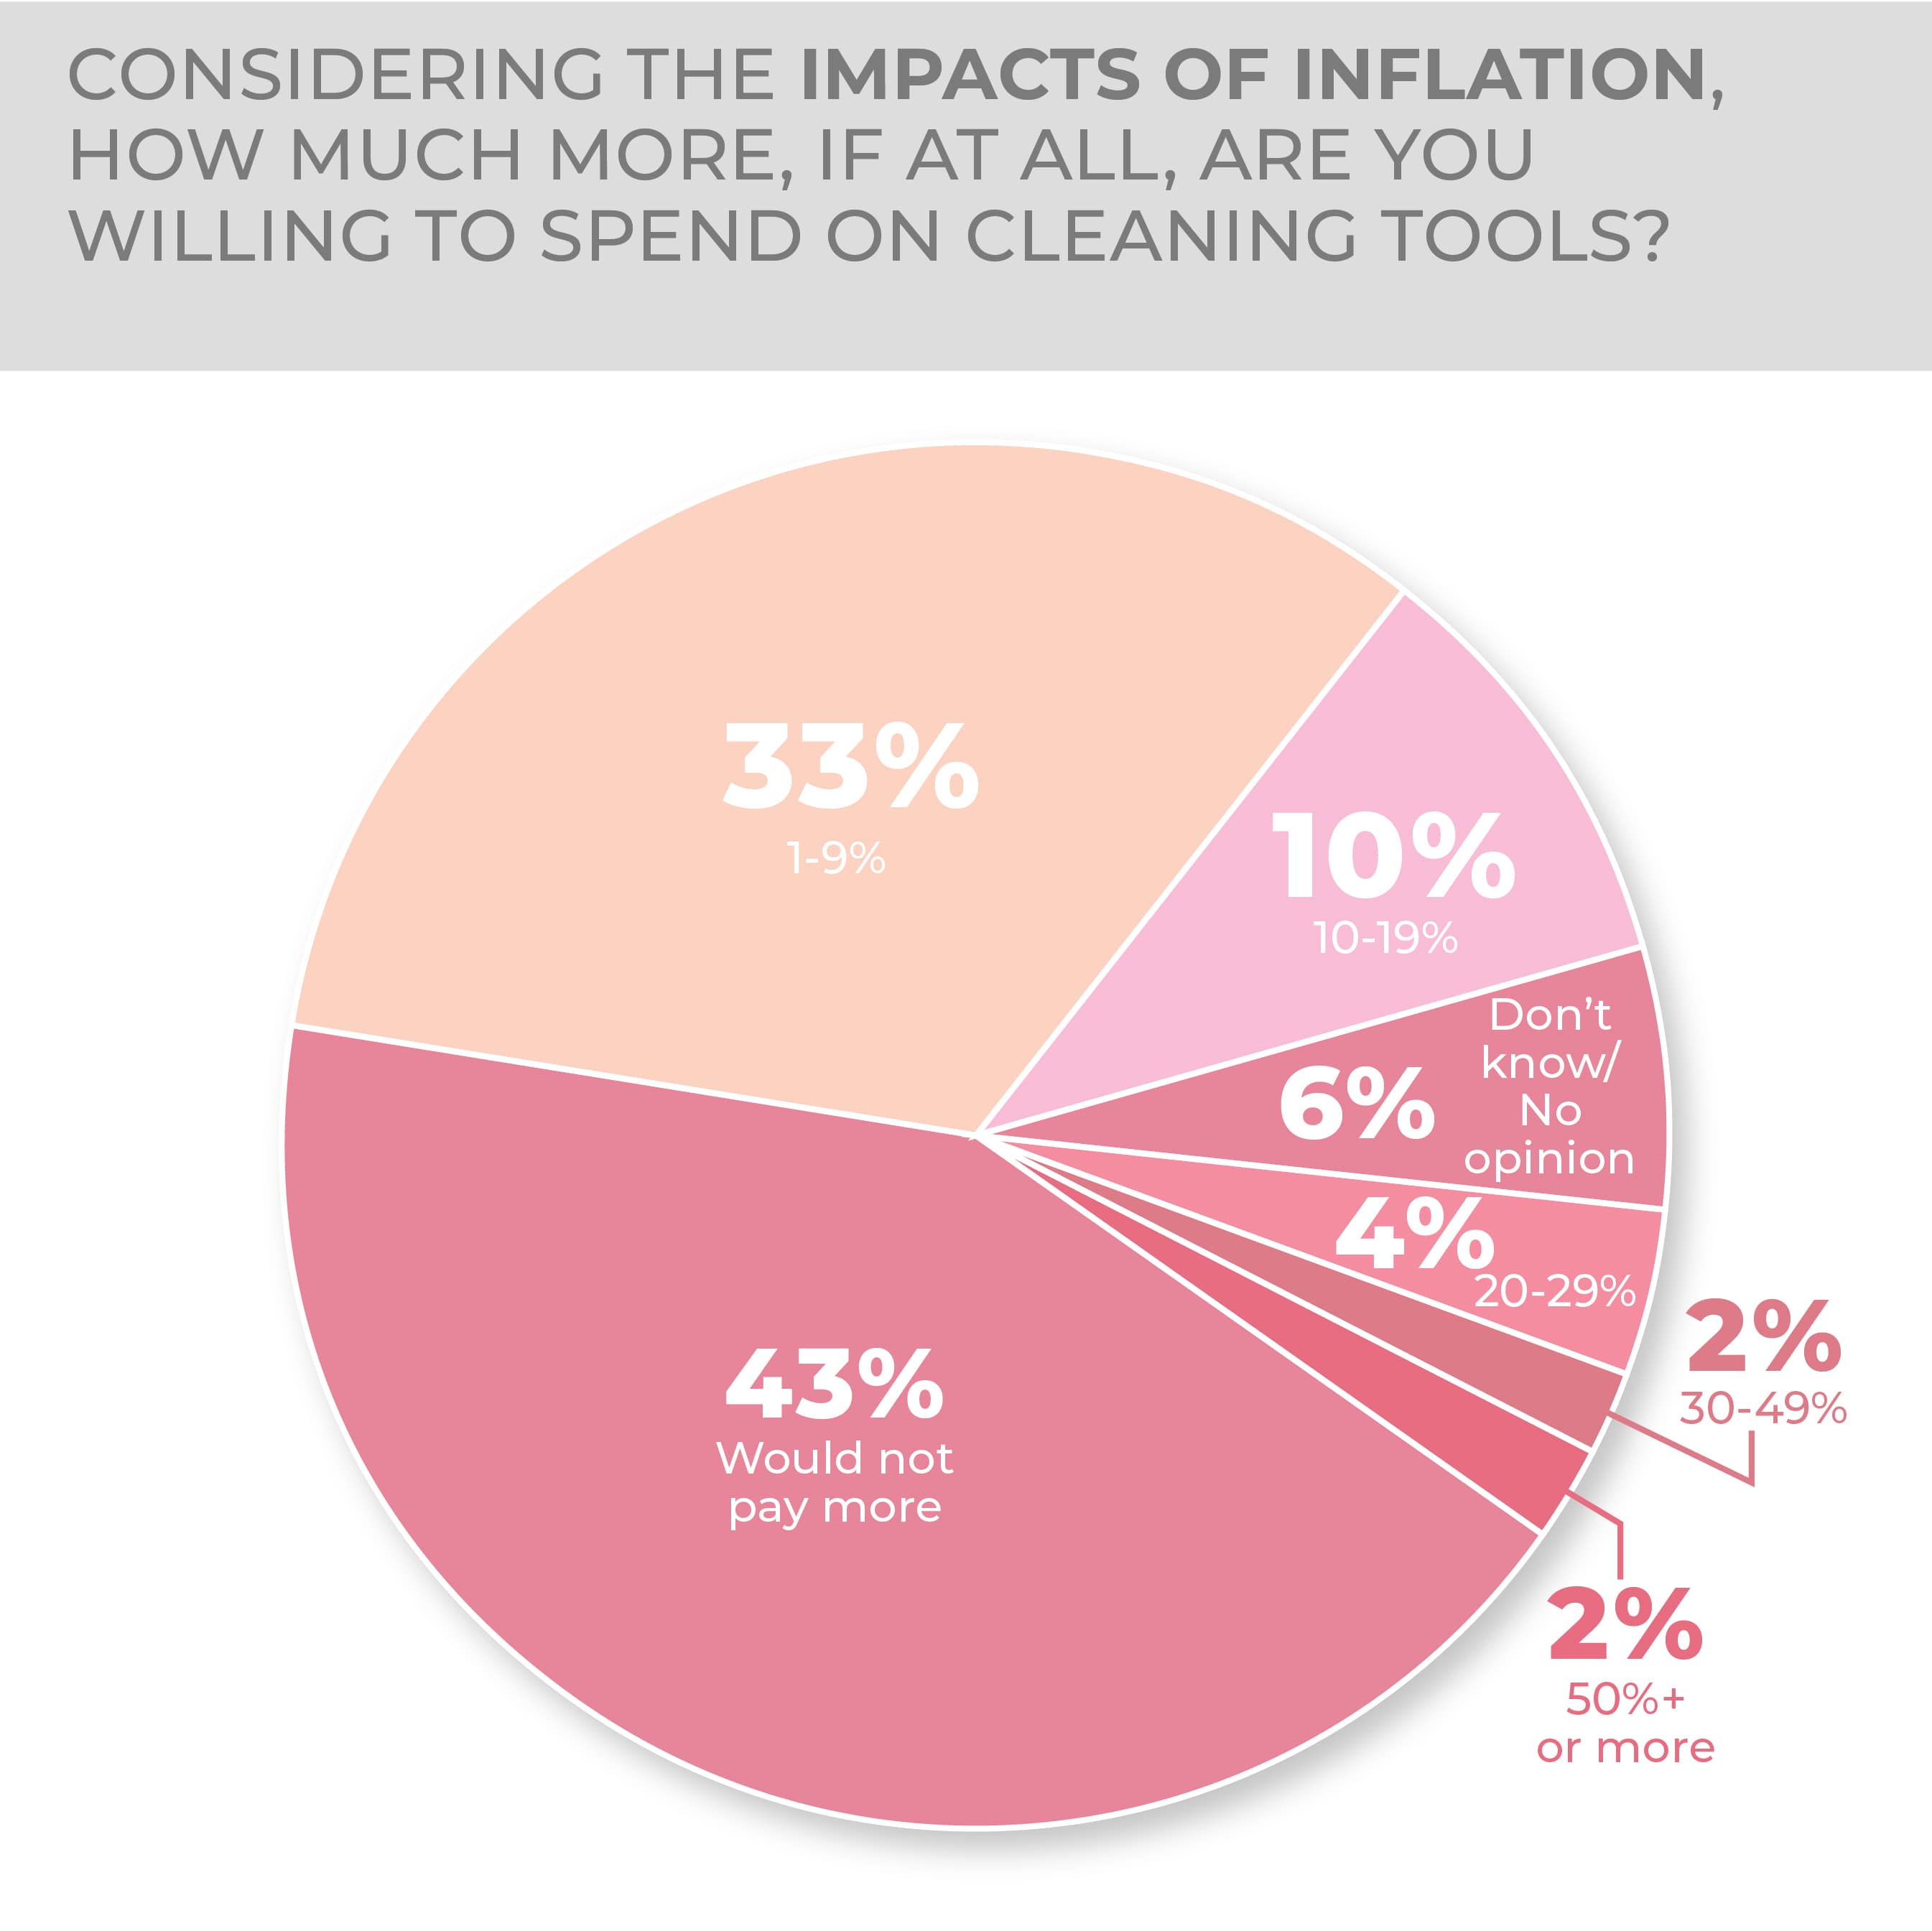
Survey respondents were not giving much into inflation in the cleaning tools category, which does have a wide variety of prices across various formulations and quality levels, therefore providing a choice to trade up or down depending on consumer need: 43% said they would not pay more for products in the category and 33% said they would only pay 1% to 9% more, followed by 10% saying they would pay 10% to 19% more.
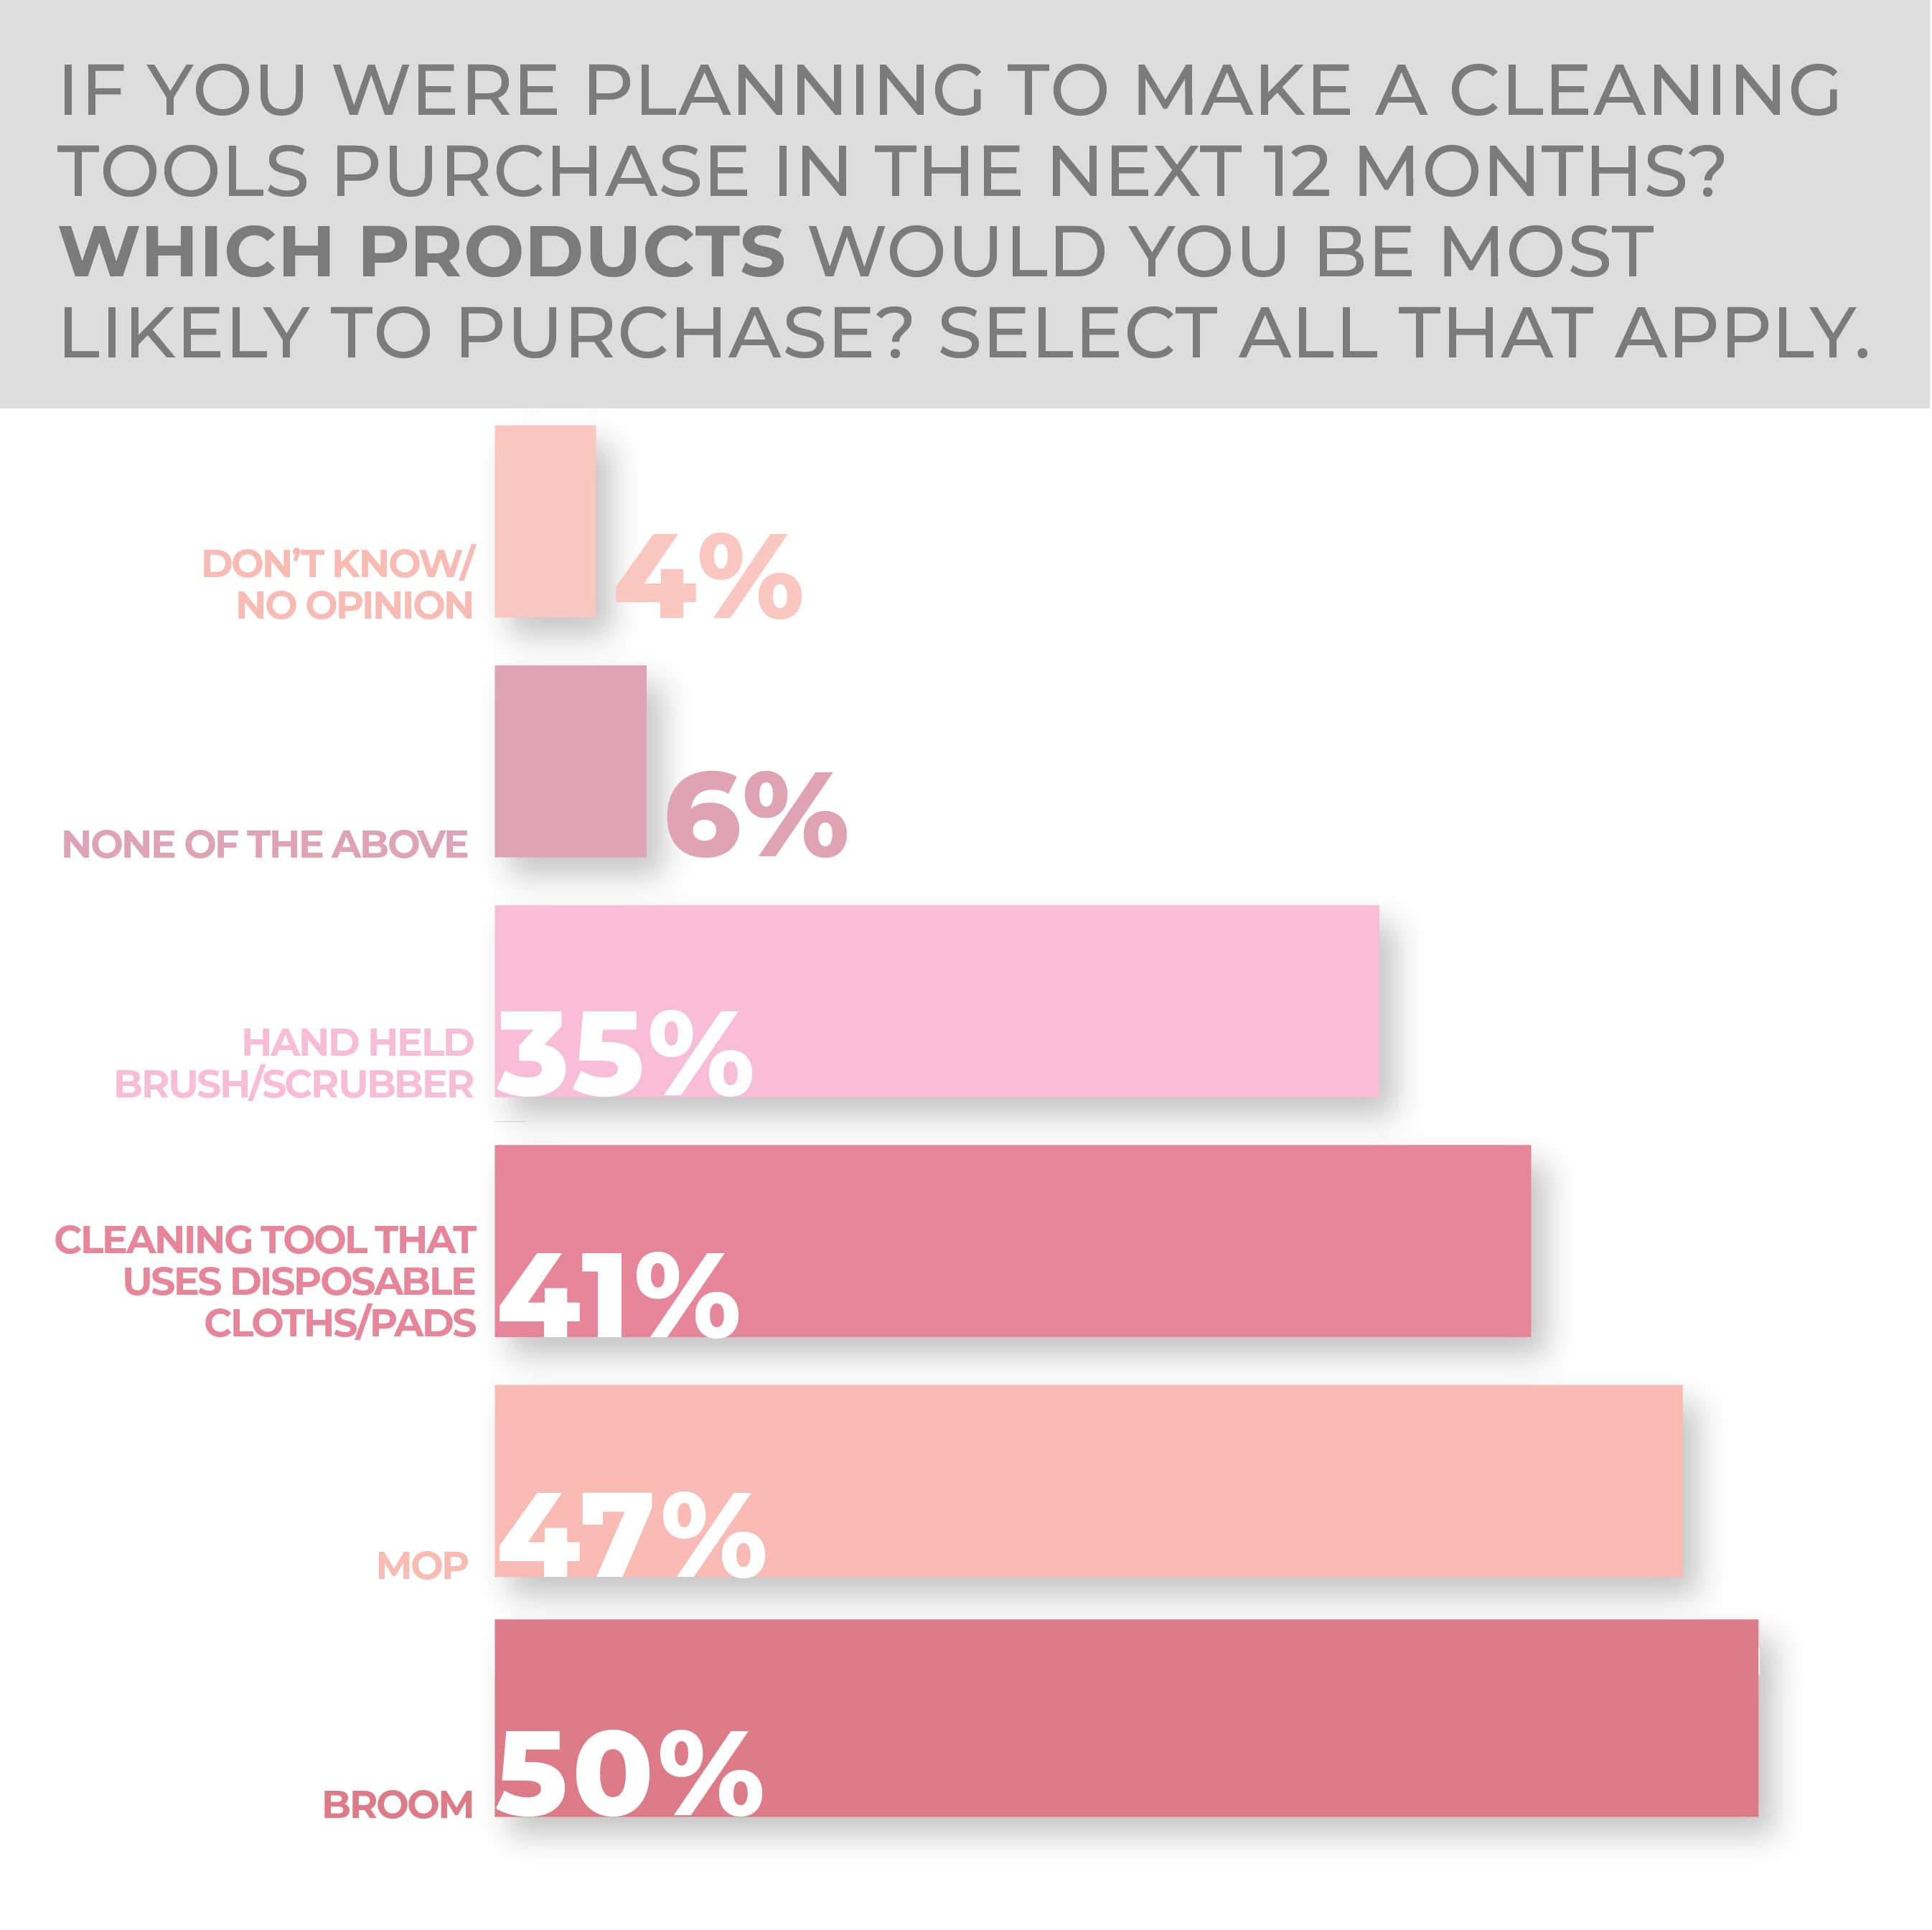
If purchasing a cleaning tool over the next year, half of the survey respondents would buy a broom and 47%, a mop. Cleaning tools that use a disposable pad are the next most popular entry among answers at 41%, with a hand-held brush/scrubber at 35%—again little changed year over year.
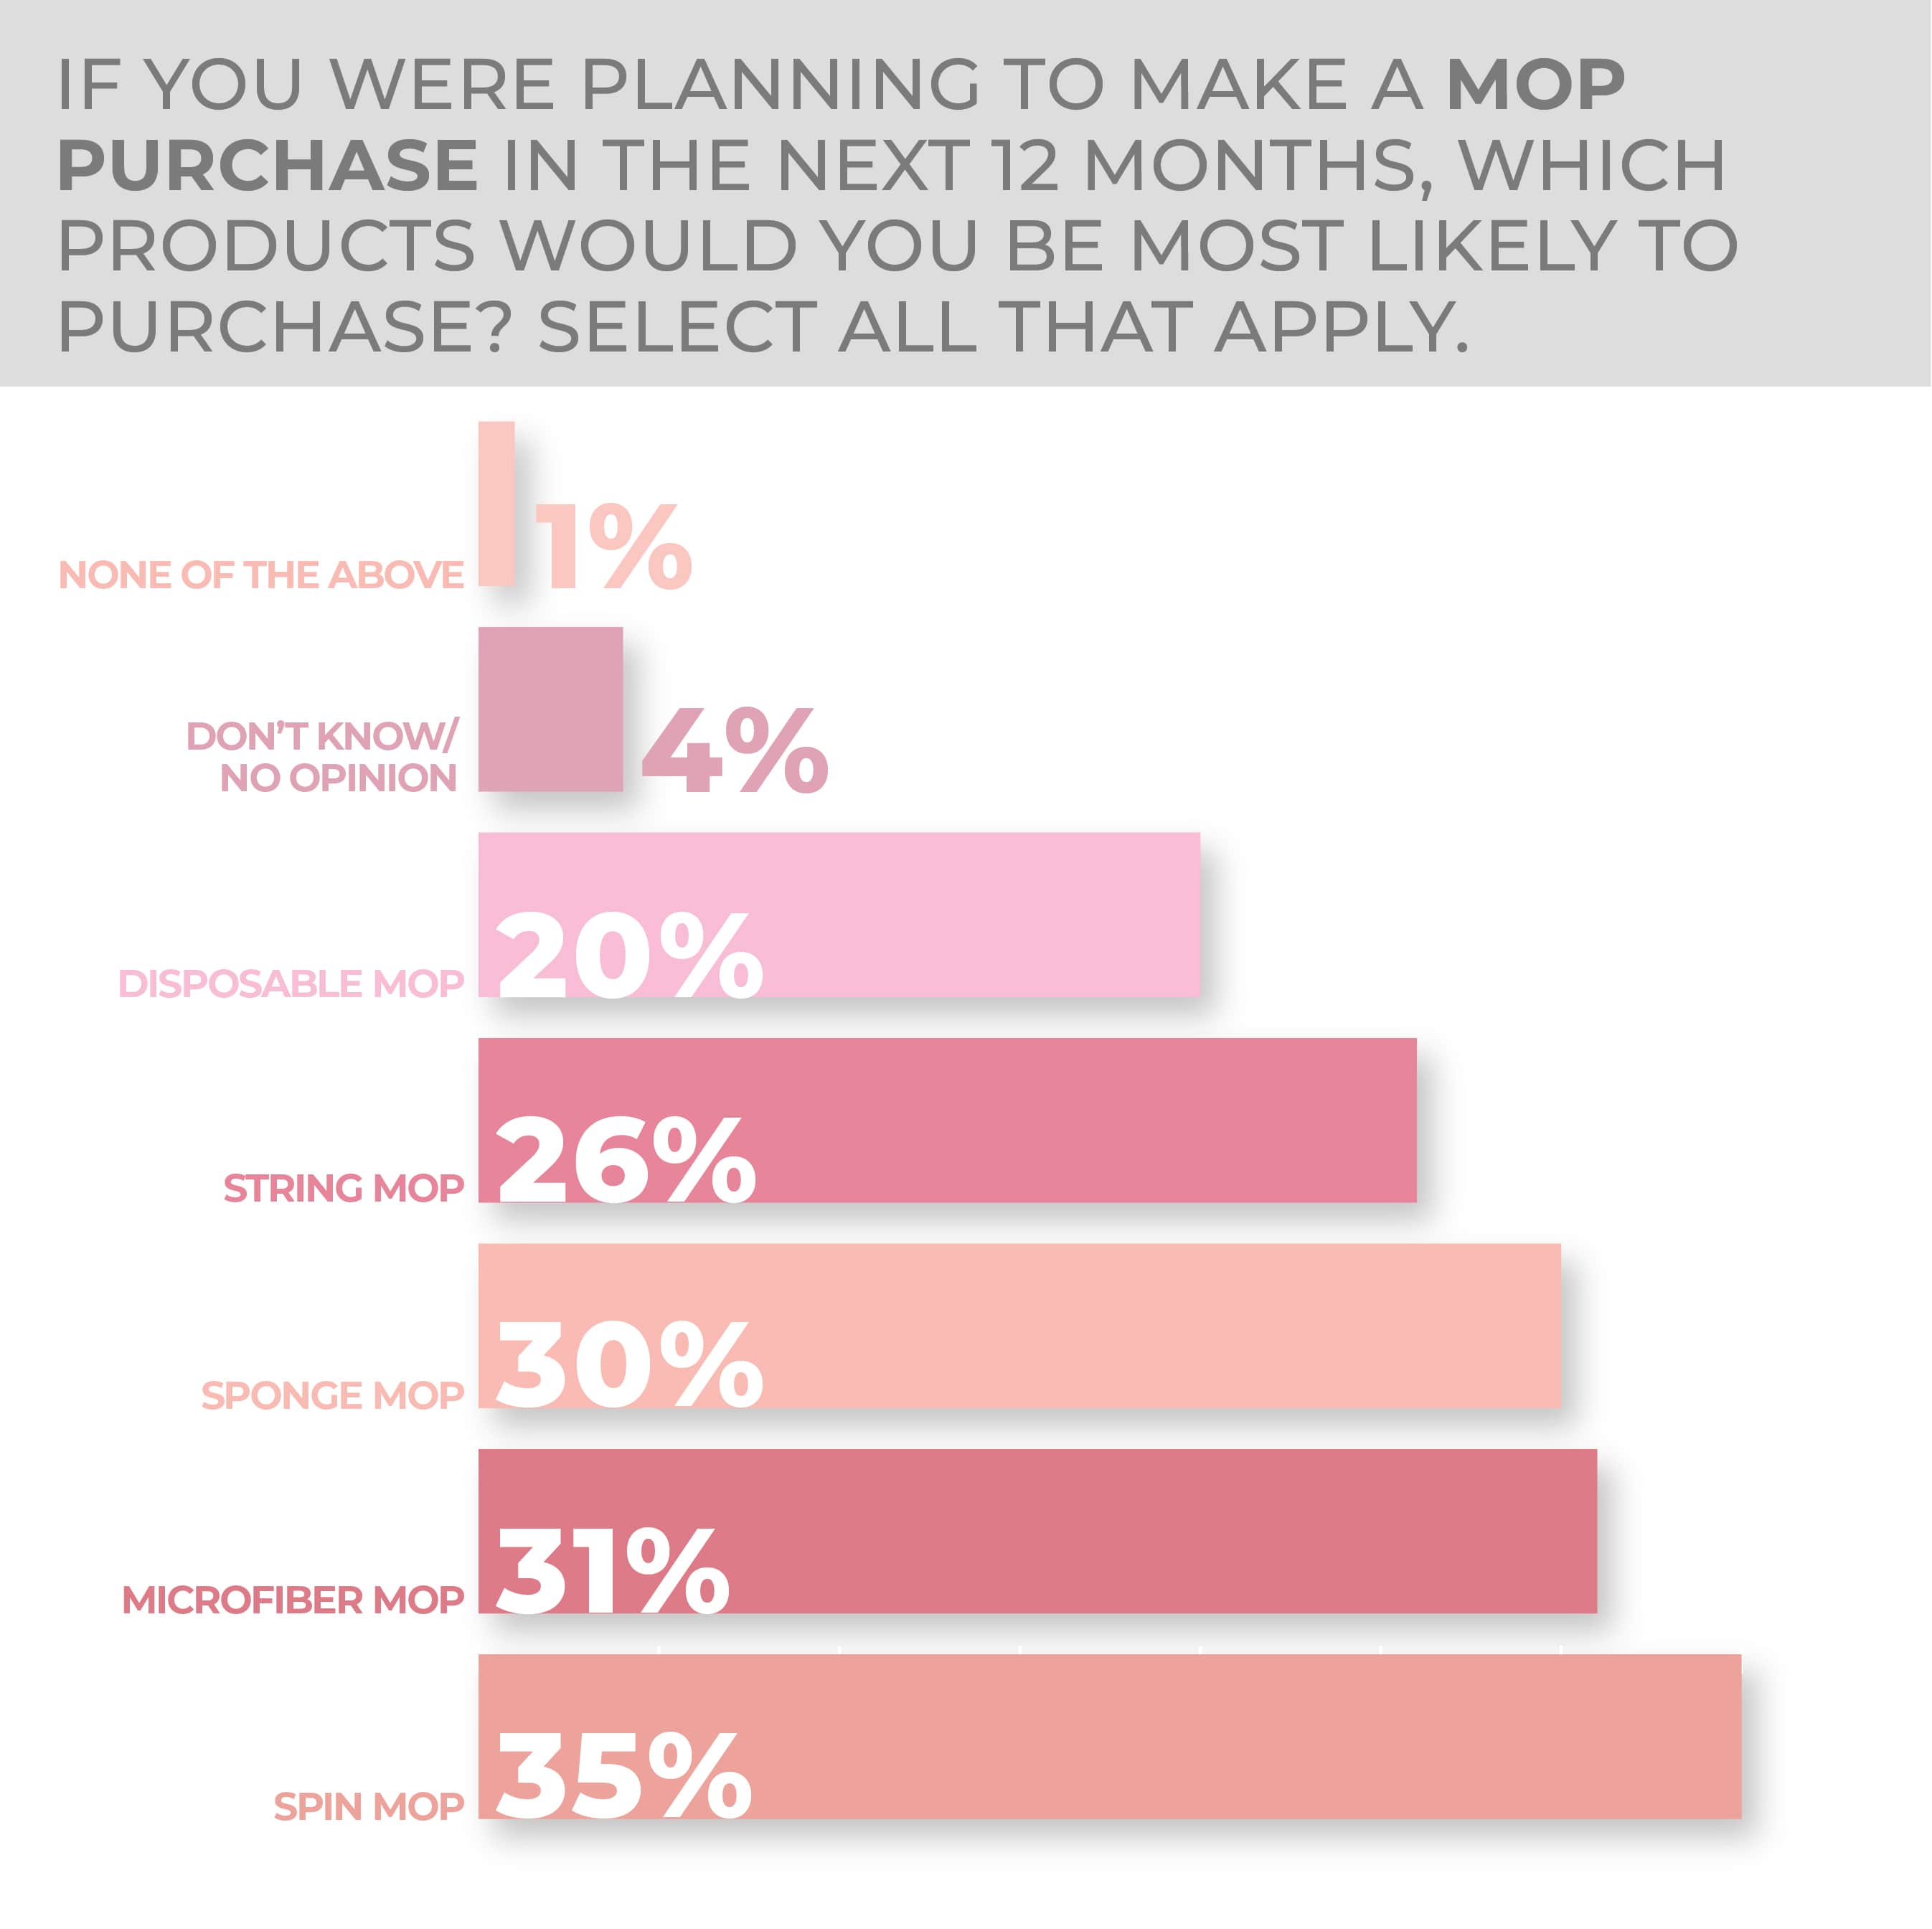
What kind of mop did survey respondents want most? The answer is a spin mop, selected by 35%, followed by a microfiber mop at 31%, a sponge mop at 30%, a string mop at 26% and a disposable mop at 20%.
Women and men were very close in their perspective on potential purchases in the cleaning tools category, with women at 27% very likely and 37% somewhat likely and men at 24% very likely and 40% somewhat likely. As for age, 32% of 18-34-year-olds were very likely and 39% somewhat likely to make a cleaning tools purchase in the months ahead while 35-44-year-olds were 33% very likely and 38% somewhat likely to do so. The older groups trail off in regard to purchasing consideration with 45-64-year-olds 23% very likely and 40% somewhat likely to do so and survey respondents 65 and older at 14% and 36%, respectively.
Potential purchasers in the South are most enthusiastic about a cleaning tools purchase with 30% very likely and 37% somewhat likely to buy, followed by 23% very likely and 41% somewhat likely to buy in the Northeast. As for the Midwest, 23% of consumers are very likely and 36% are somewhat likely to purchase cleaning tools with those out West at 22% and 41% respectively.
More Cleaning Tools Findings:
Cookware
Cookware was one of the champions of the pandemic-driven housewares surge. The category, ripe with lots of new product activity among retail and direct-to-consumer suppliers, is well positioned to retain strong sales potential as consumers continue to work on advancing cooking skills while cutting back amid inflation on costly restaurant visits.
-
- Outlook Survey results indicate consumers remain almost equally likely to purchase cookware during the next year when compared to last year’s survey.
- More than half of the respondents chose frying pans/skillets as the type of cookware they were most likely to purchase.
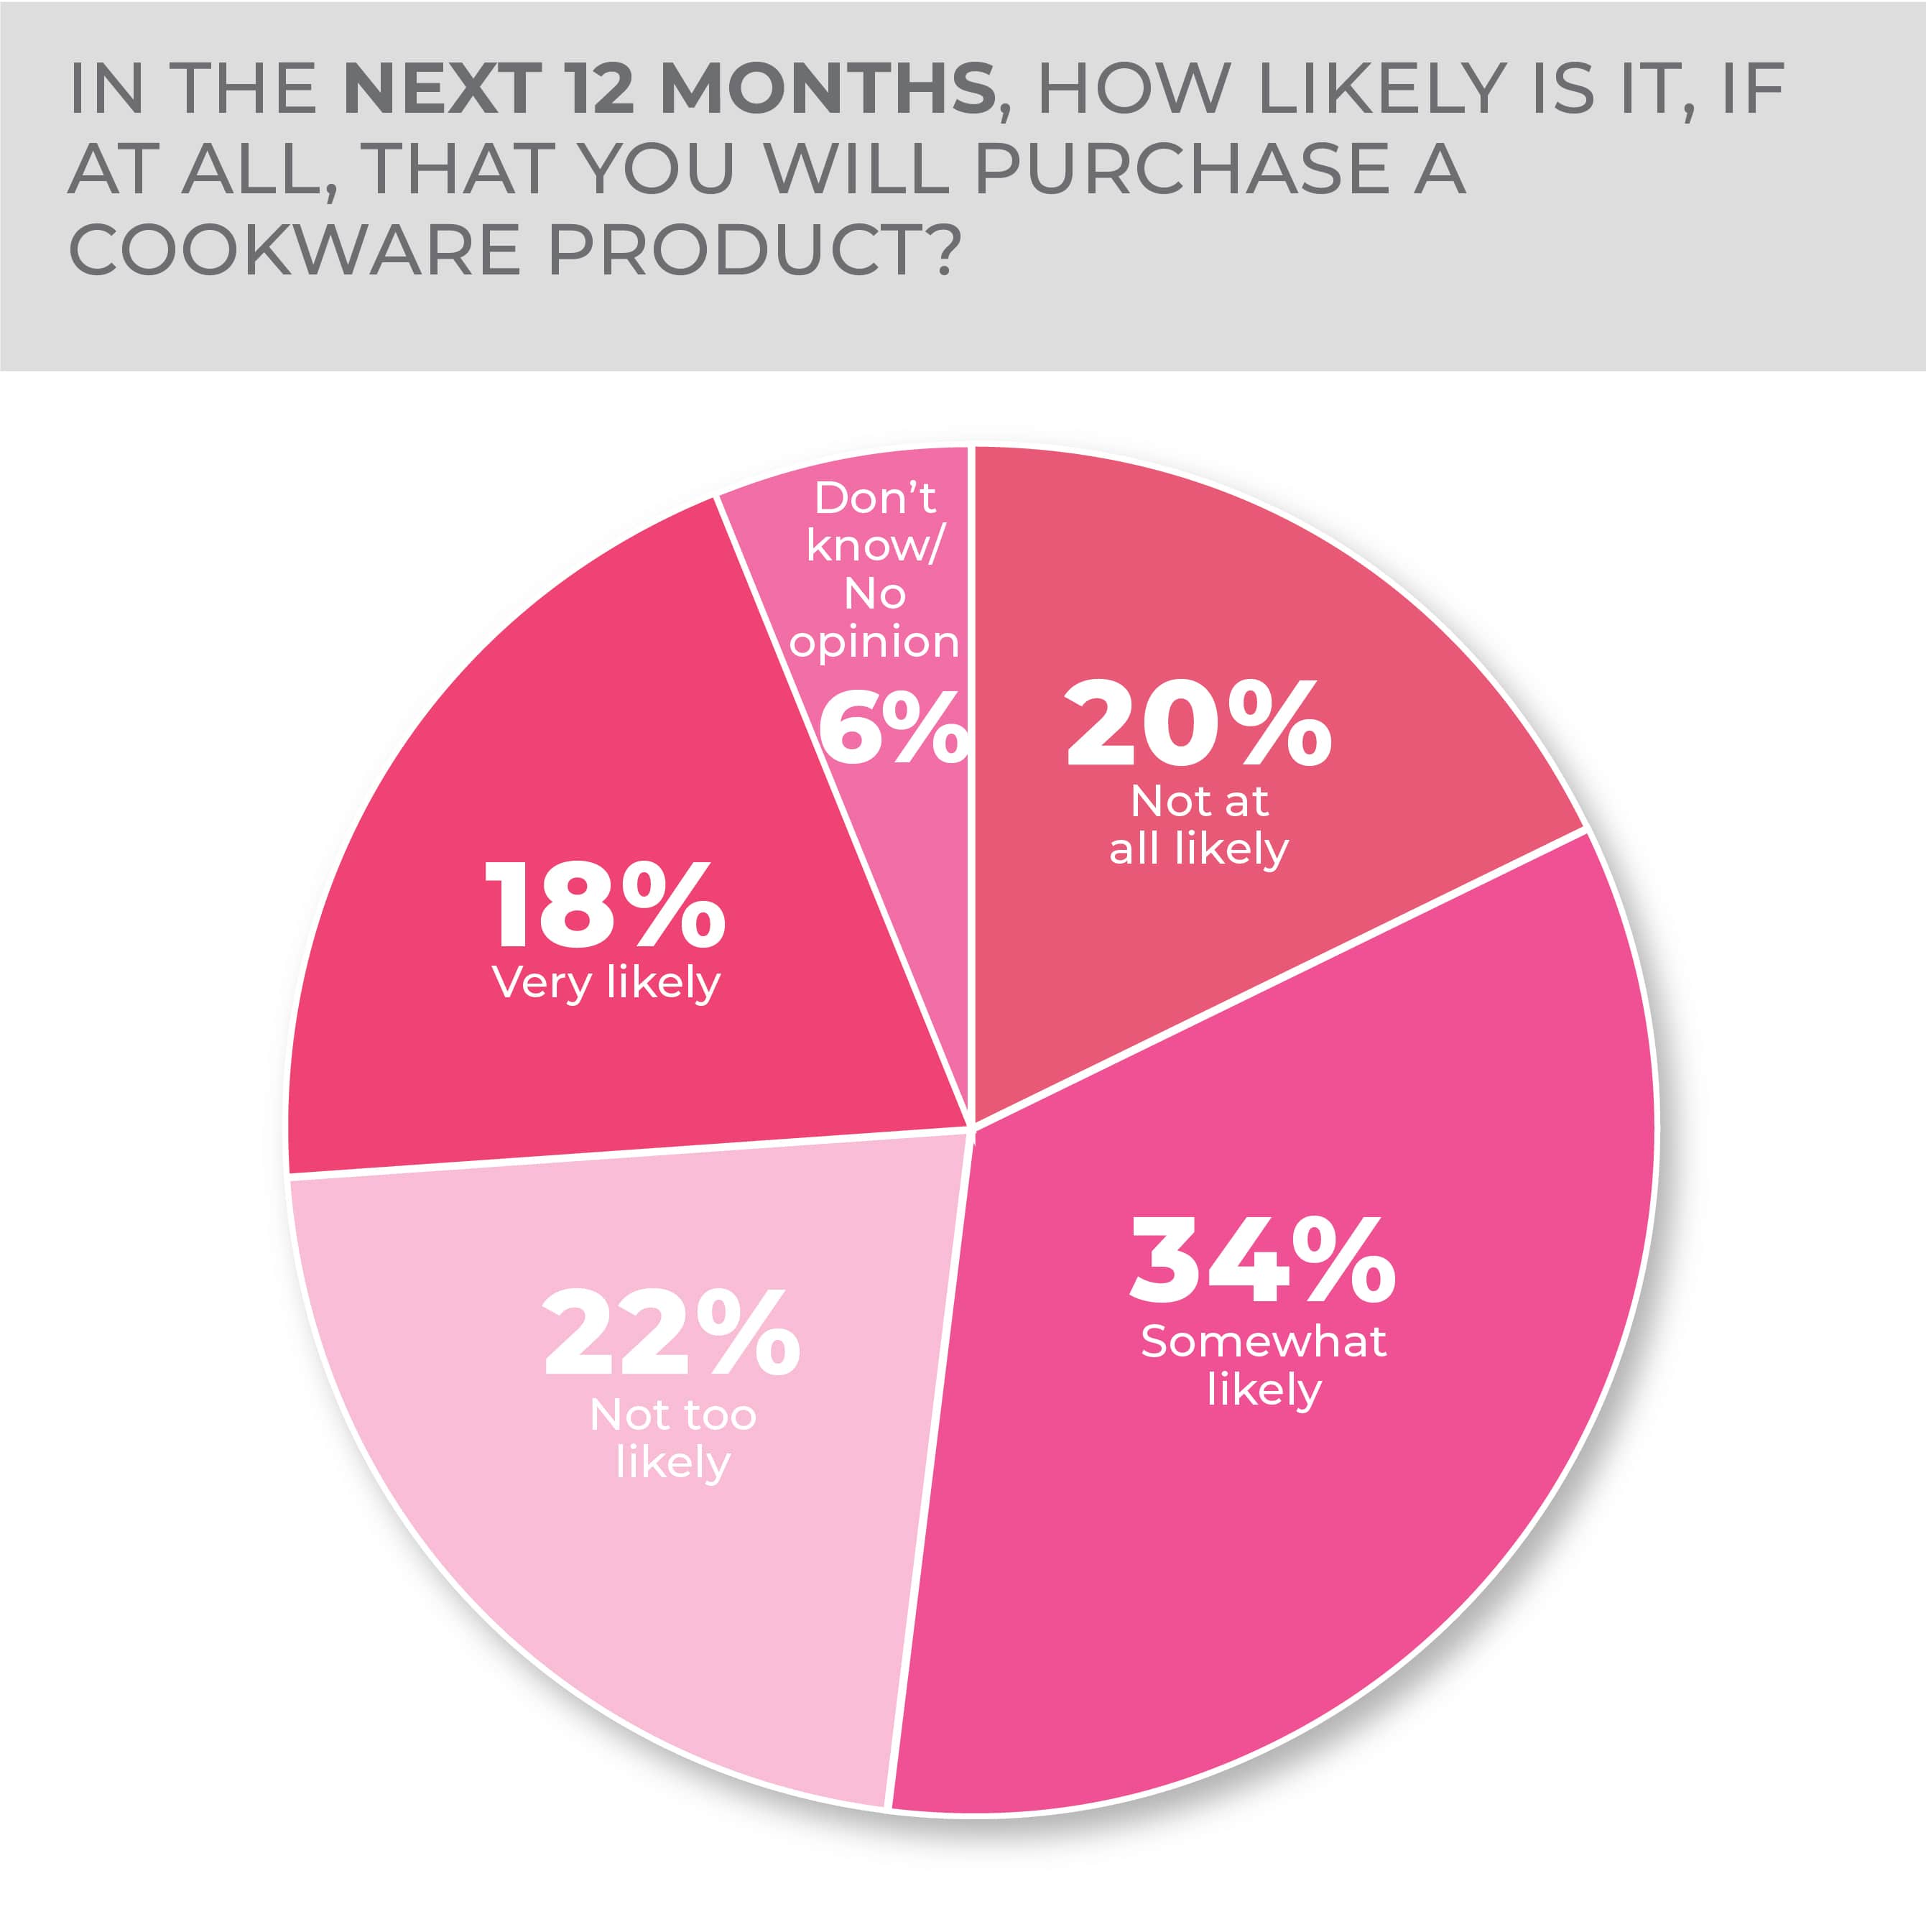
Results of the HomePage News 2023 Consumer Outlook Survey indicate consumers remain almost equally likely to purchase cookware during the next year when compared to last year’s survey. Survey respondents answered they were 34% somewhat likely and 18% very likely to purchase cookware, while 22% were not too likely, and 20% were not at all likely.
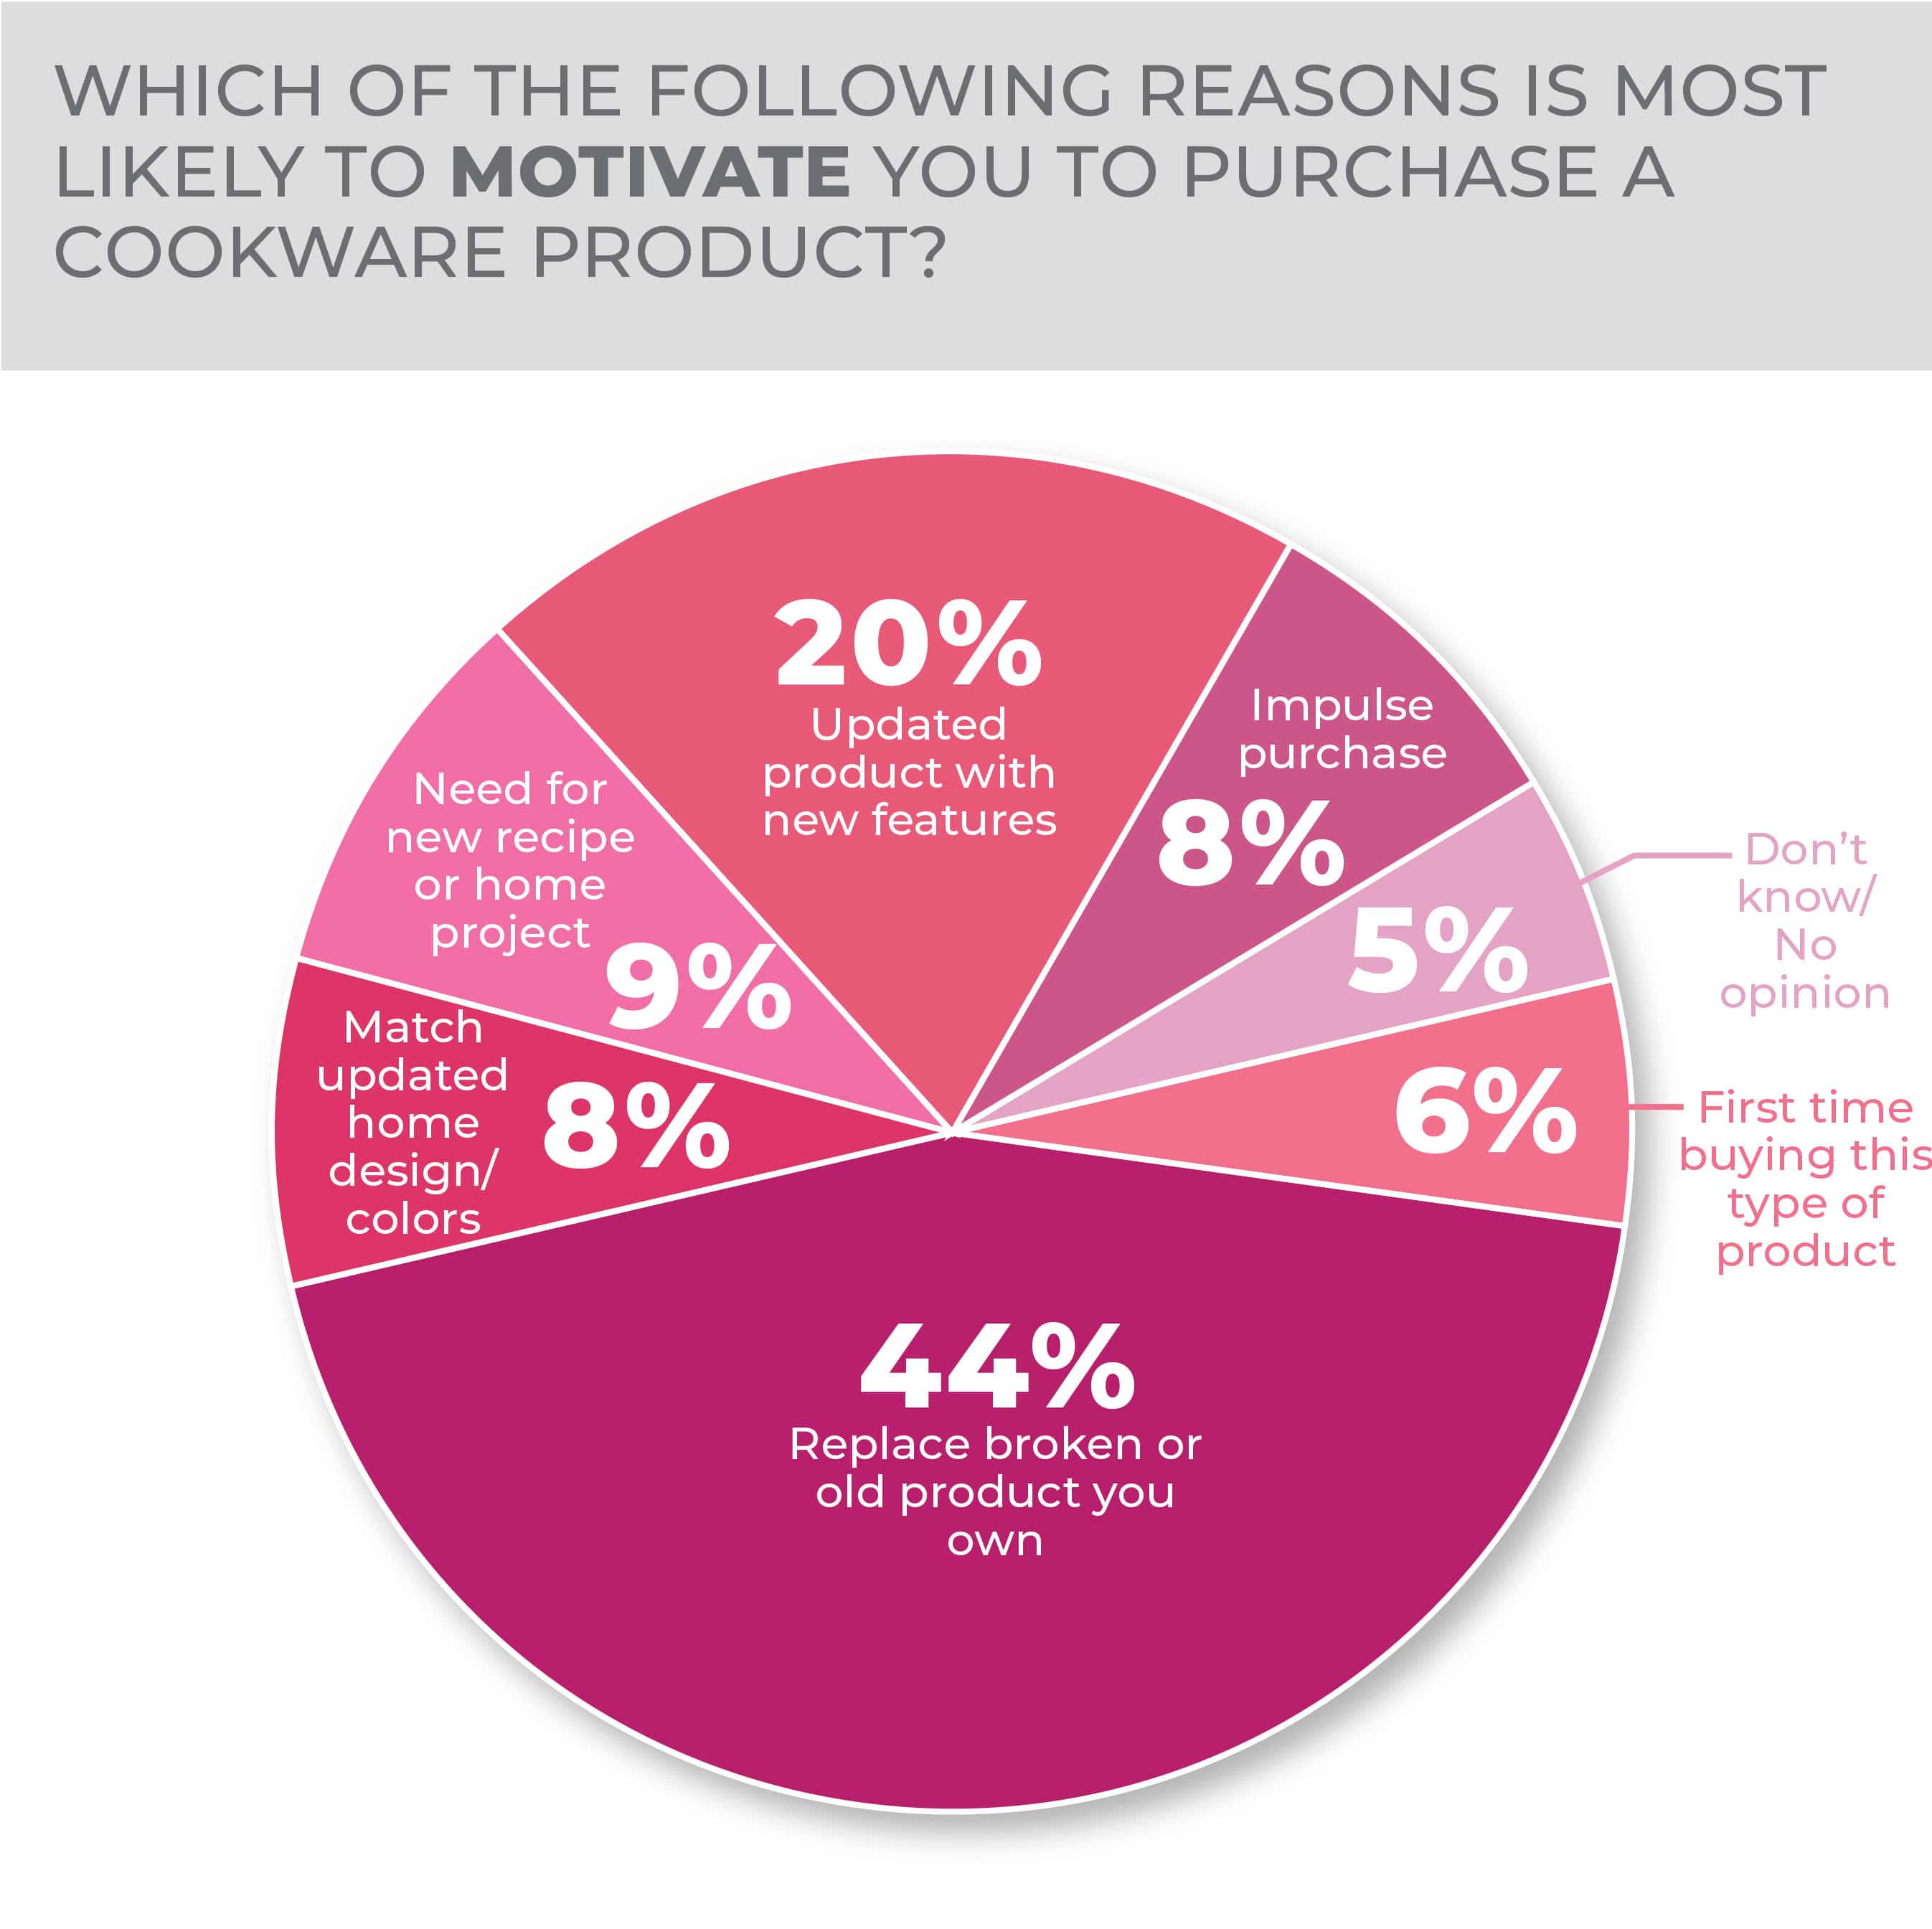
If they were to purchase a cookware product, most consumers would do so to replace a broken or old product (44%), followed by an updated product with new features (20%). Other options were all under 10%, including first time cookware buying, to match updated home design/colors, impulse purchases and need for a new recipe or home project.
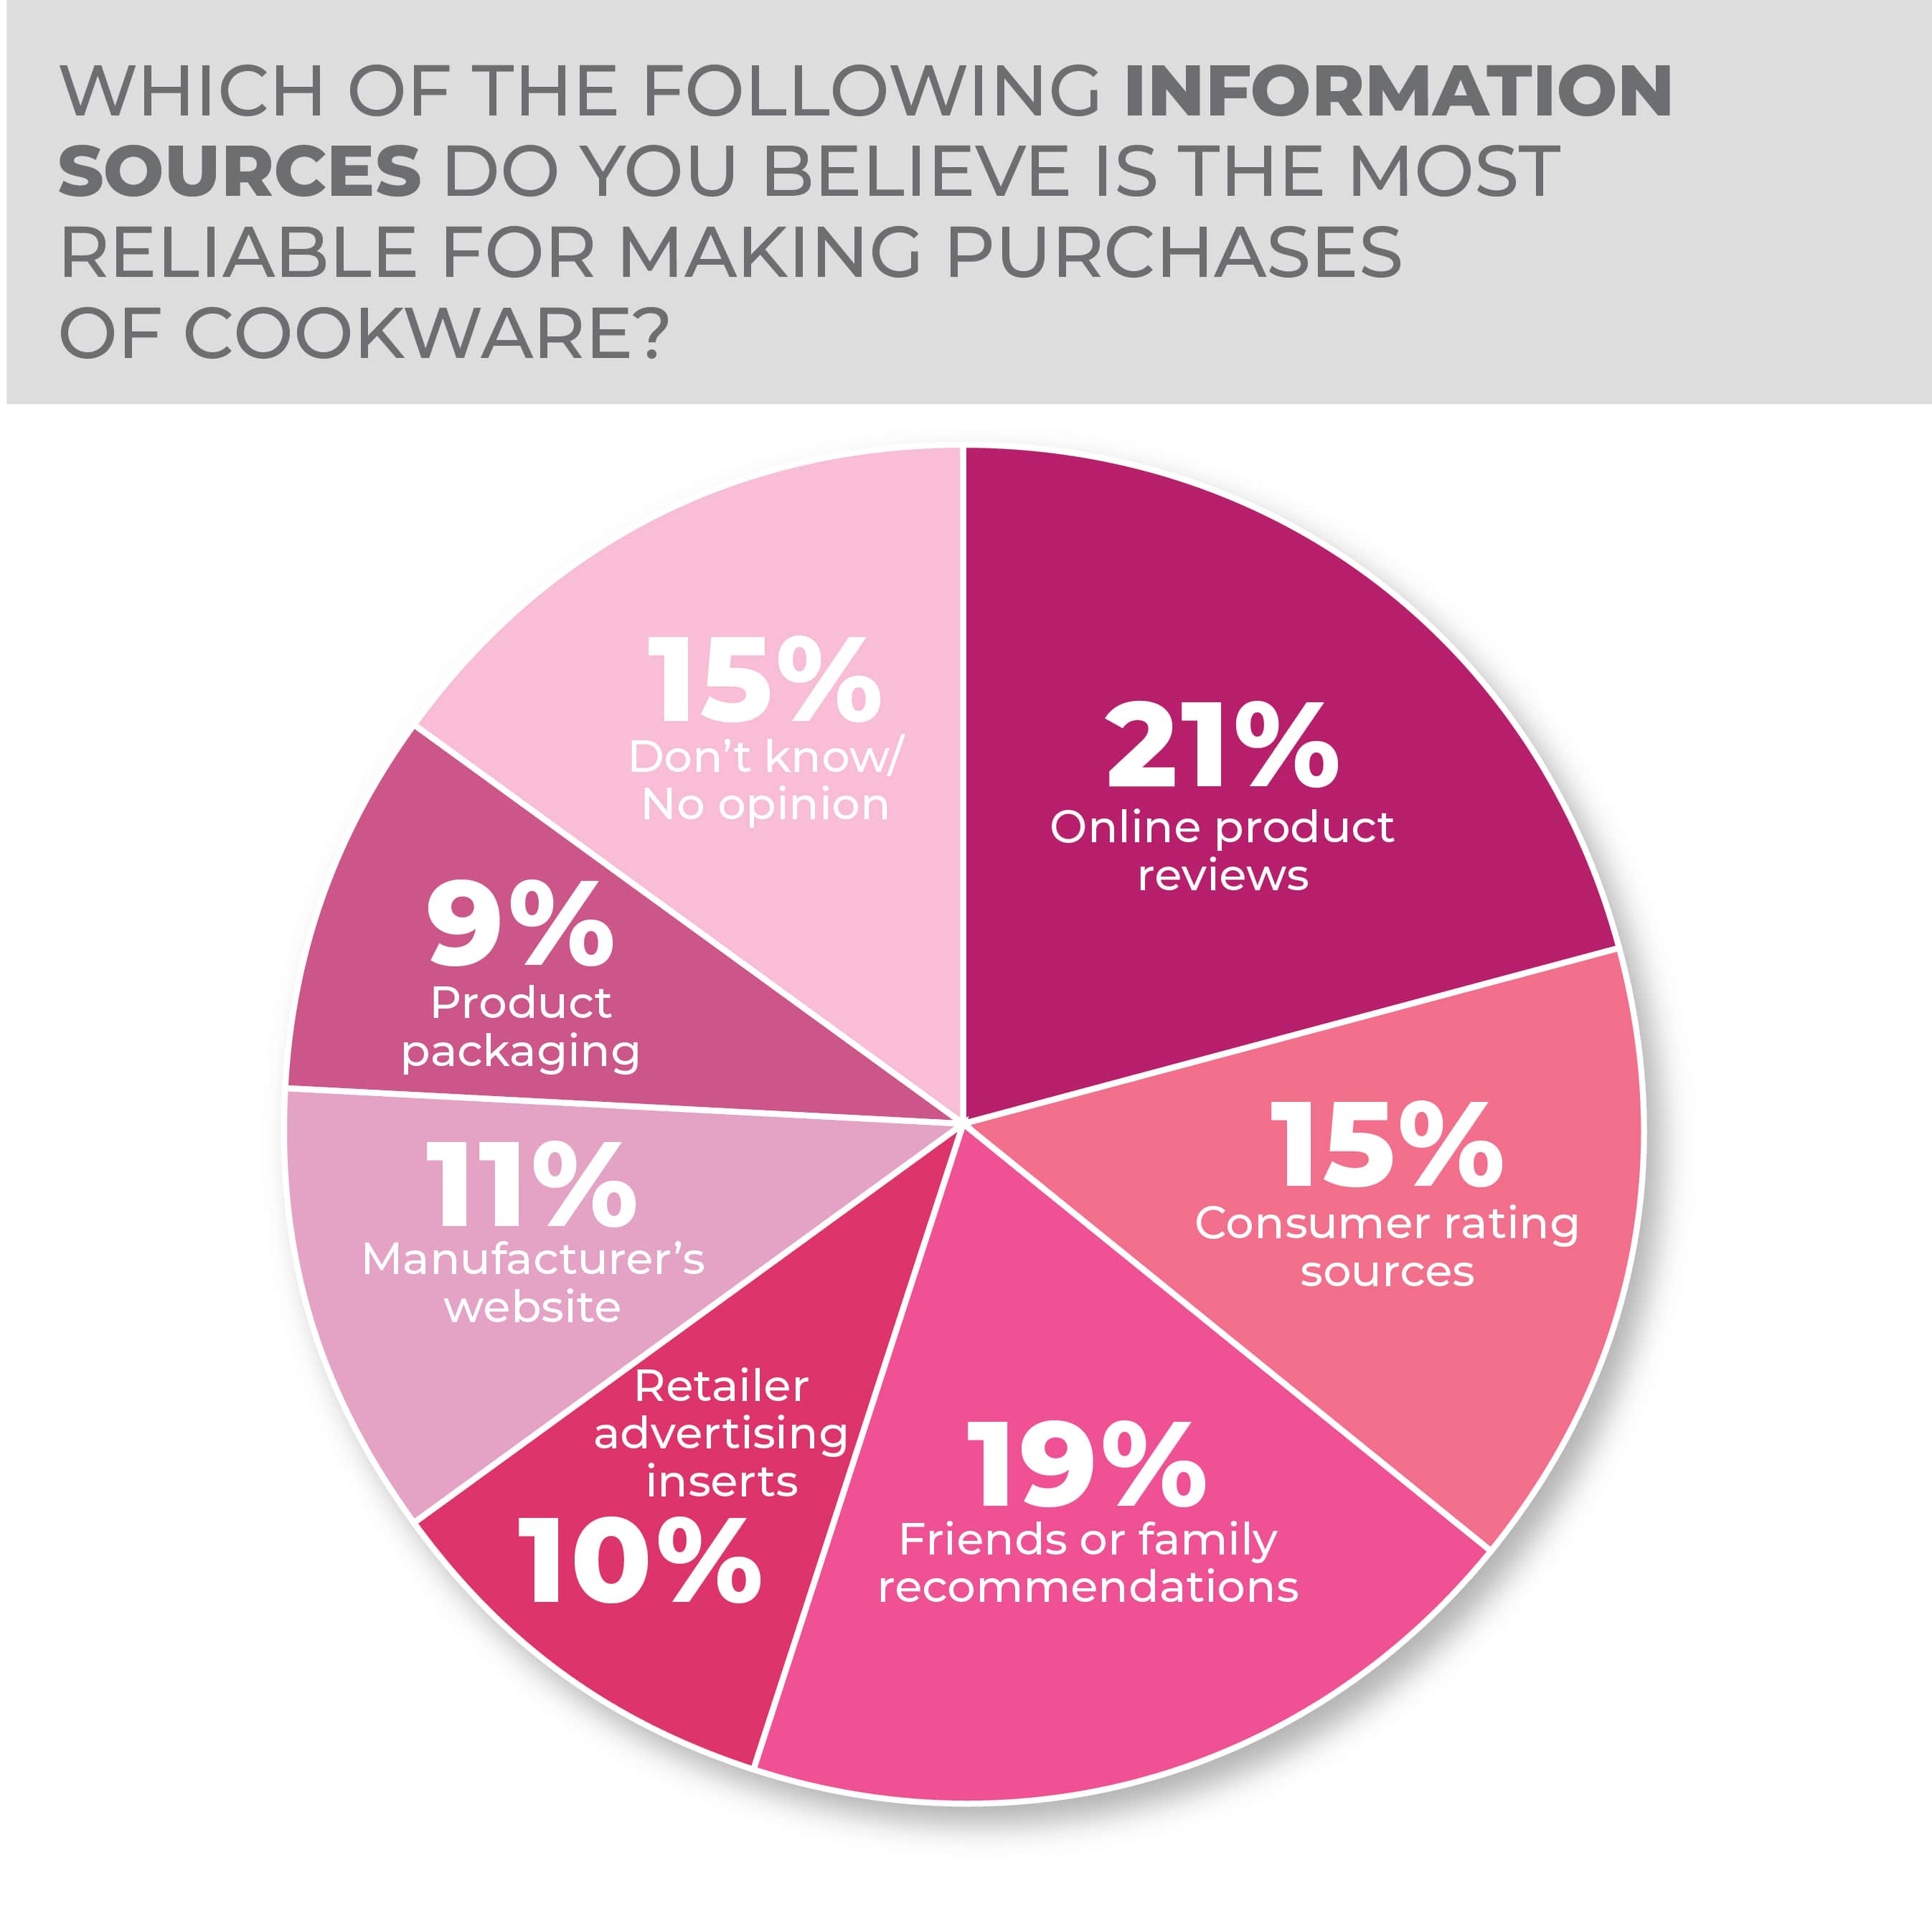
Online product reviews and friends or family recommendations were the most reliable information sources by consumers for advising cookware purchases.
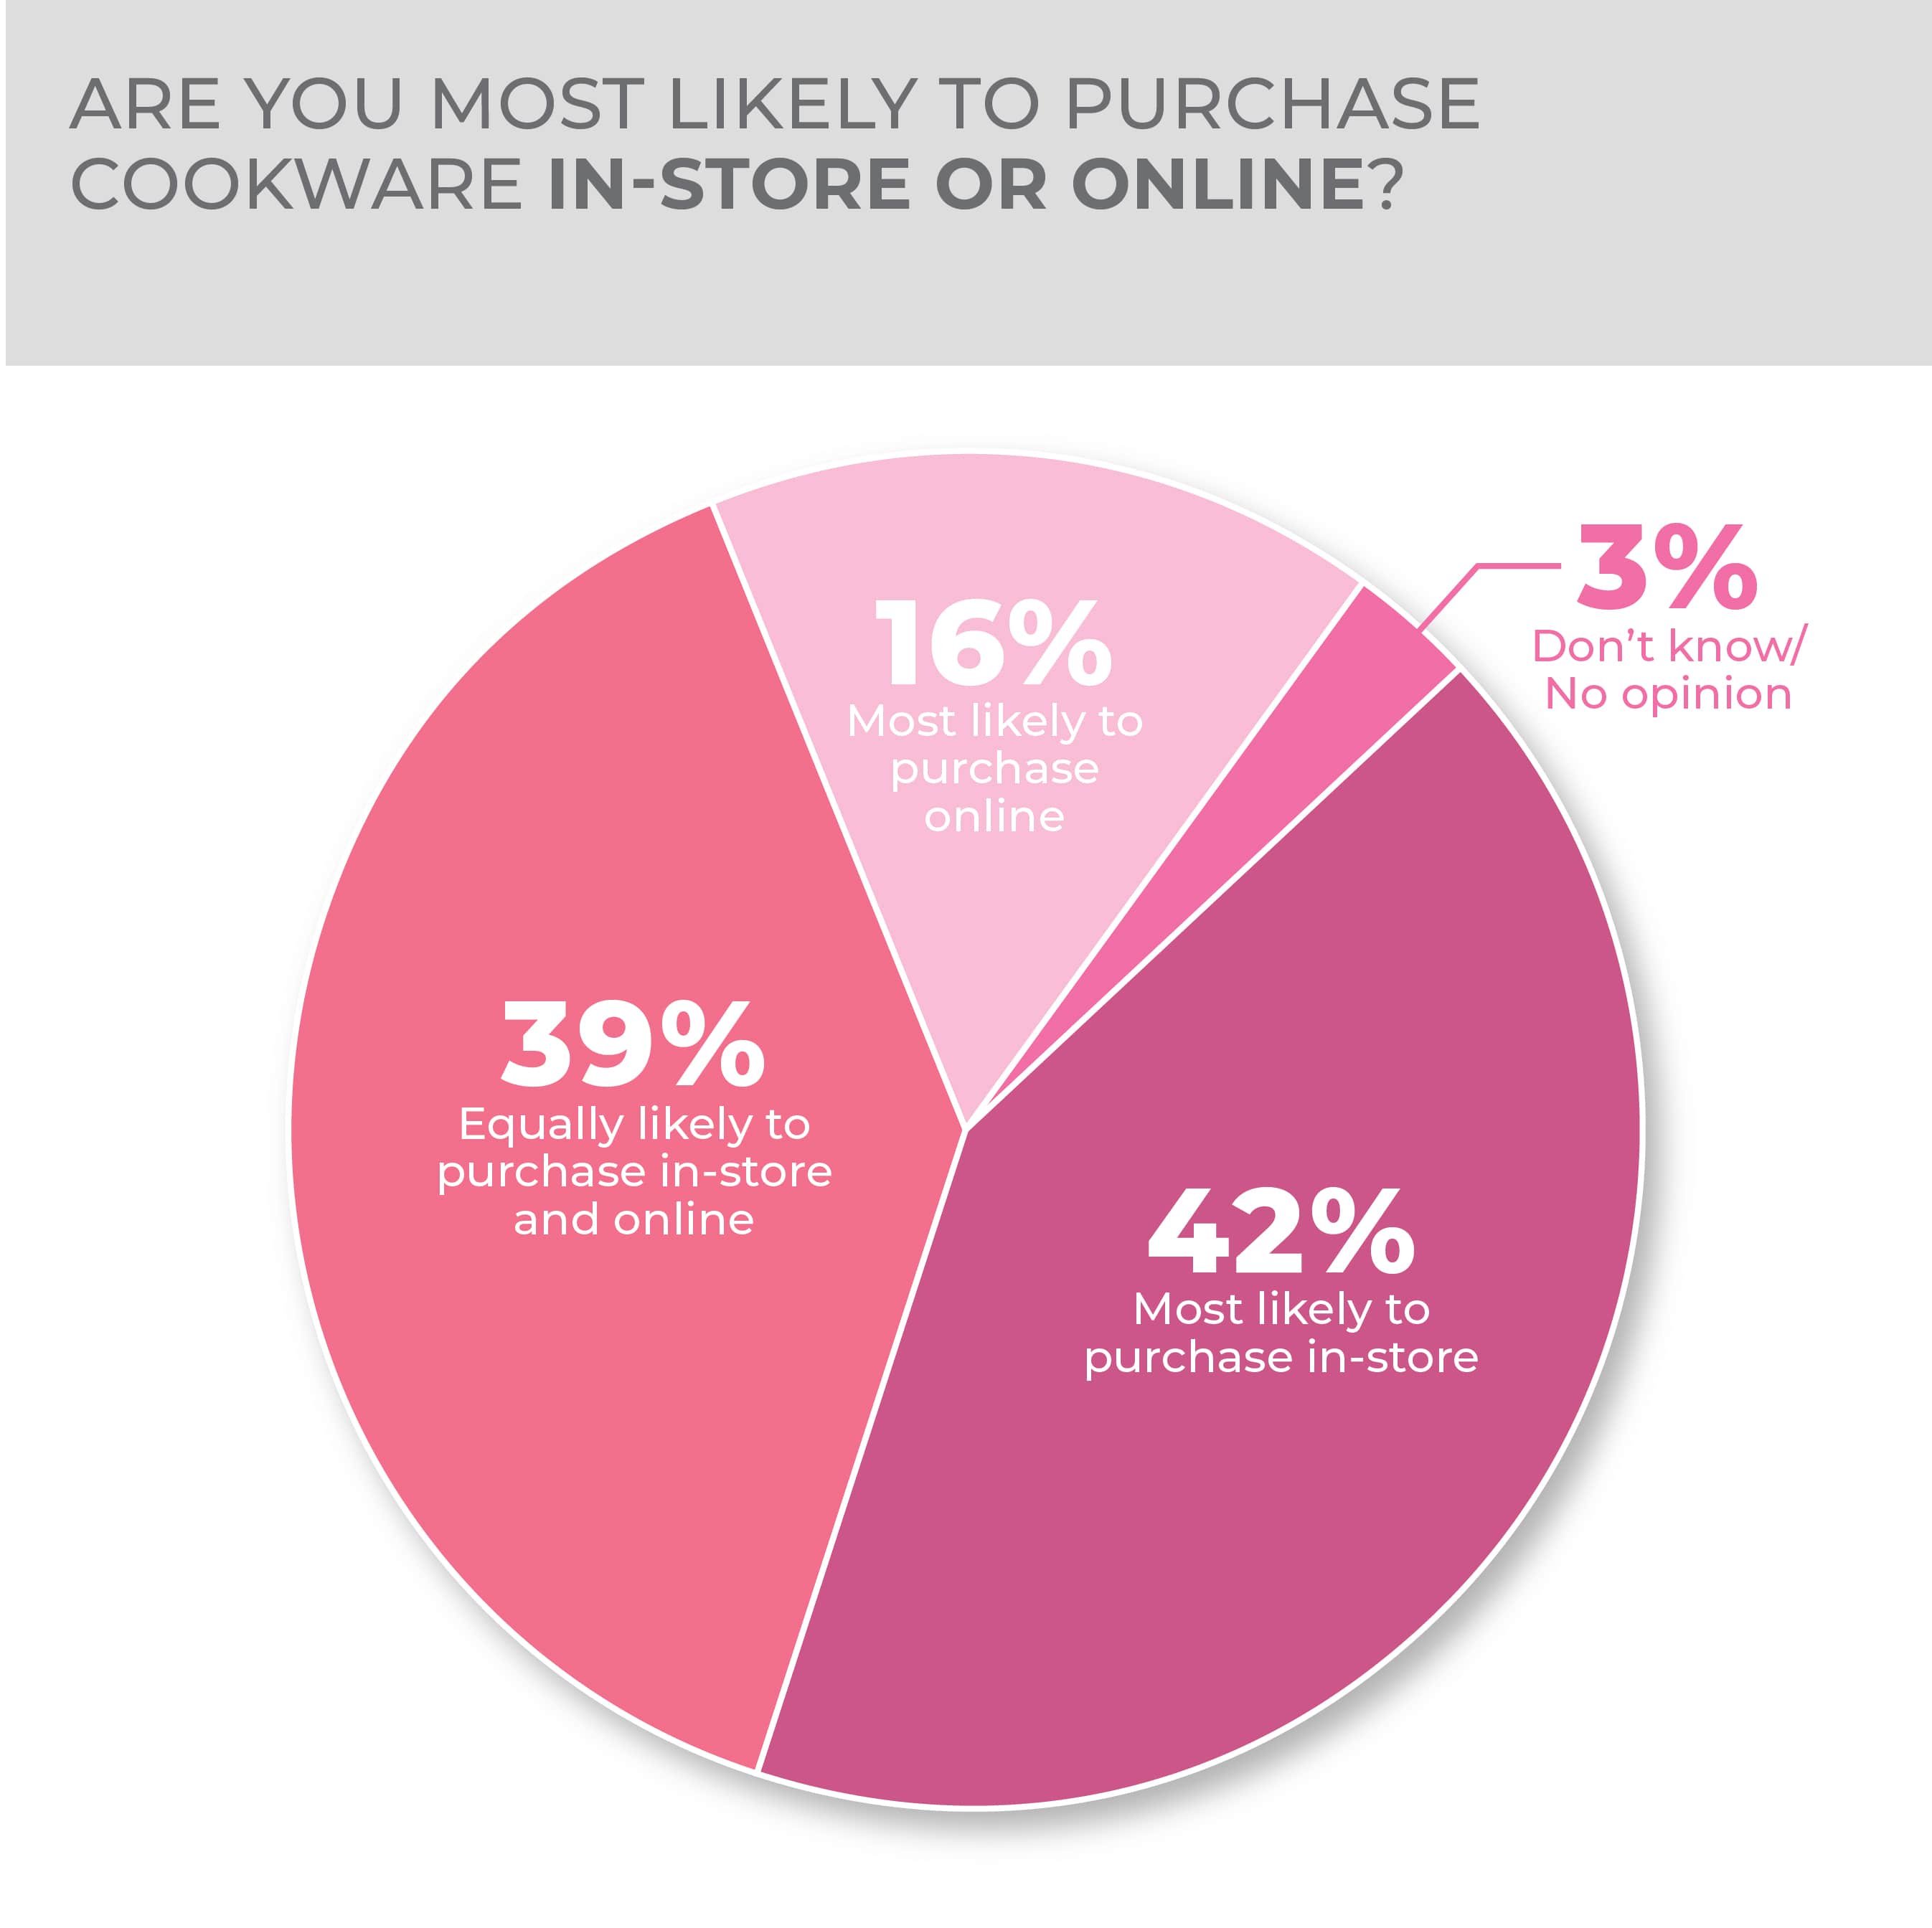
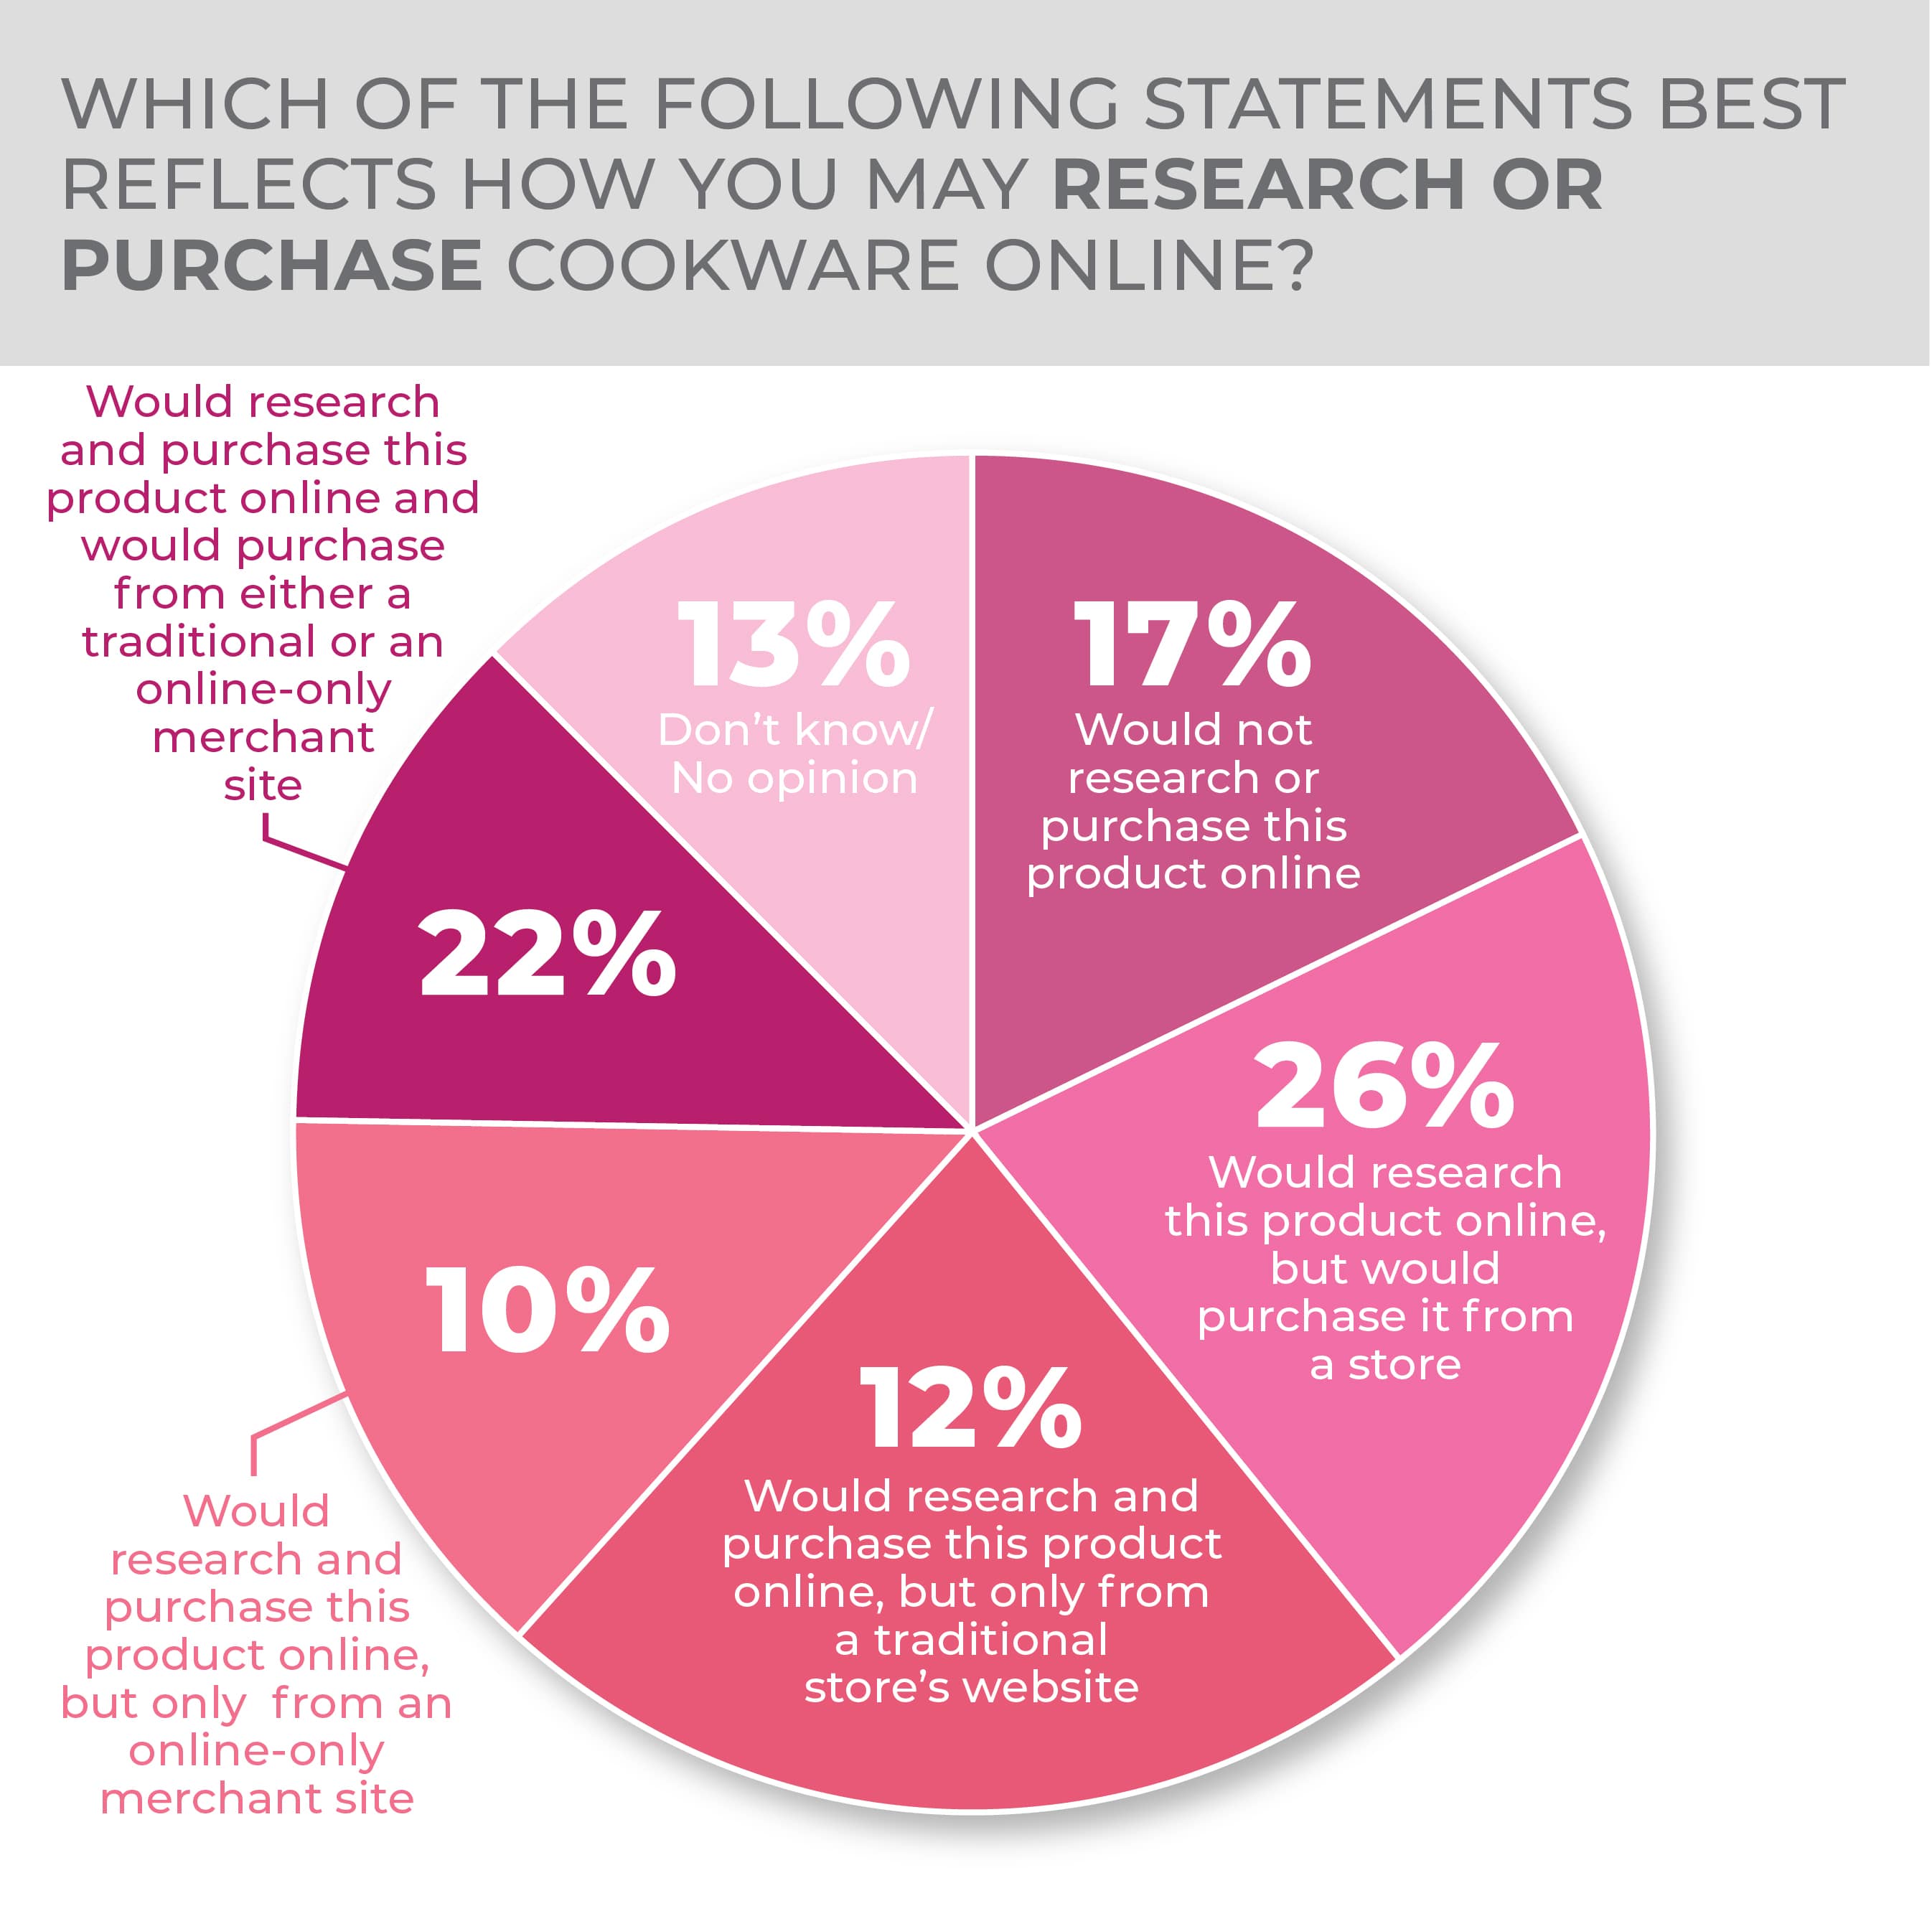
Respondents stated they were most likely to purchase cookware in-store at 42%, coming in slightly above equally likely to purchase in-store and online at 39%. In line with those answers, when asked about researching or purchasing cookware online 26% said they would research the product online but purchase from a store. That was followed by 22% who said they would research and purchase the product online from either a traditional retailer or online-only merchant site.
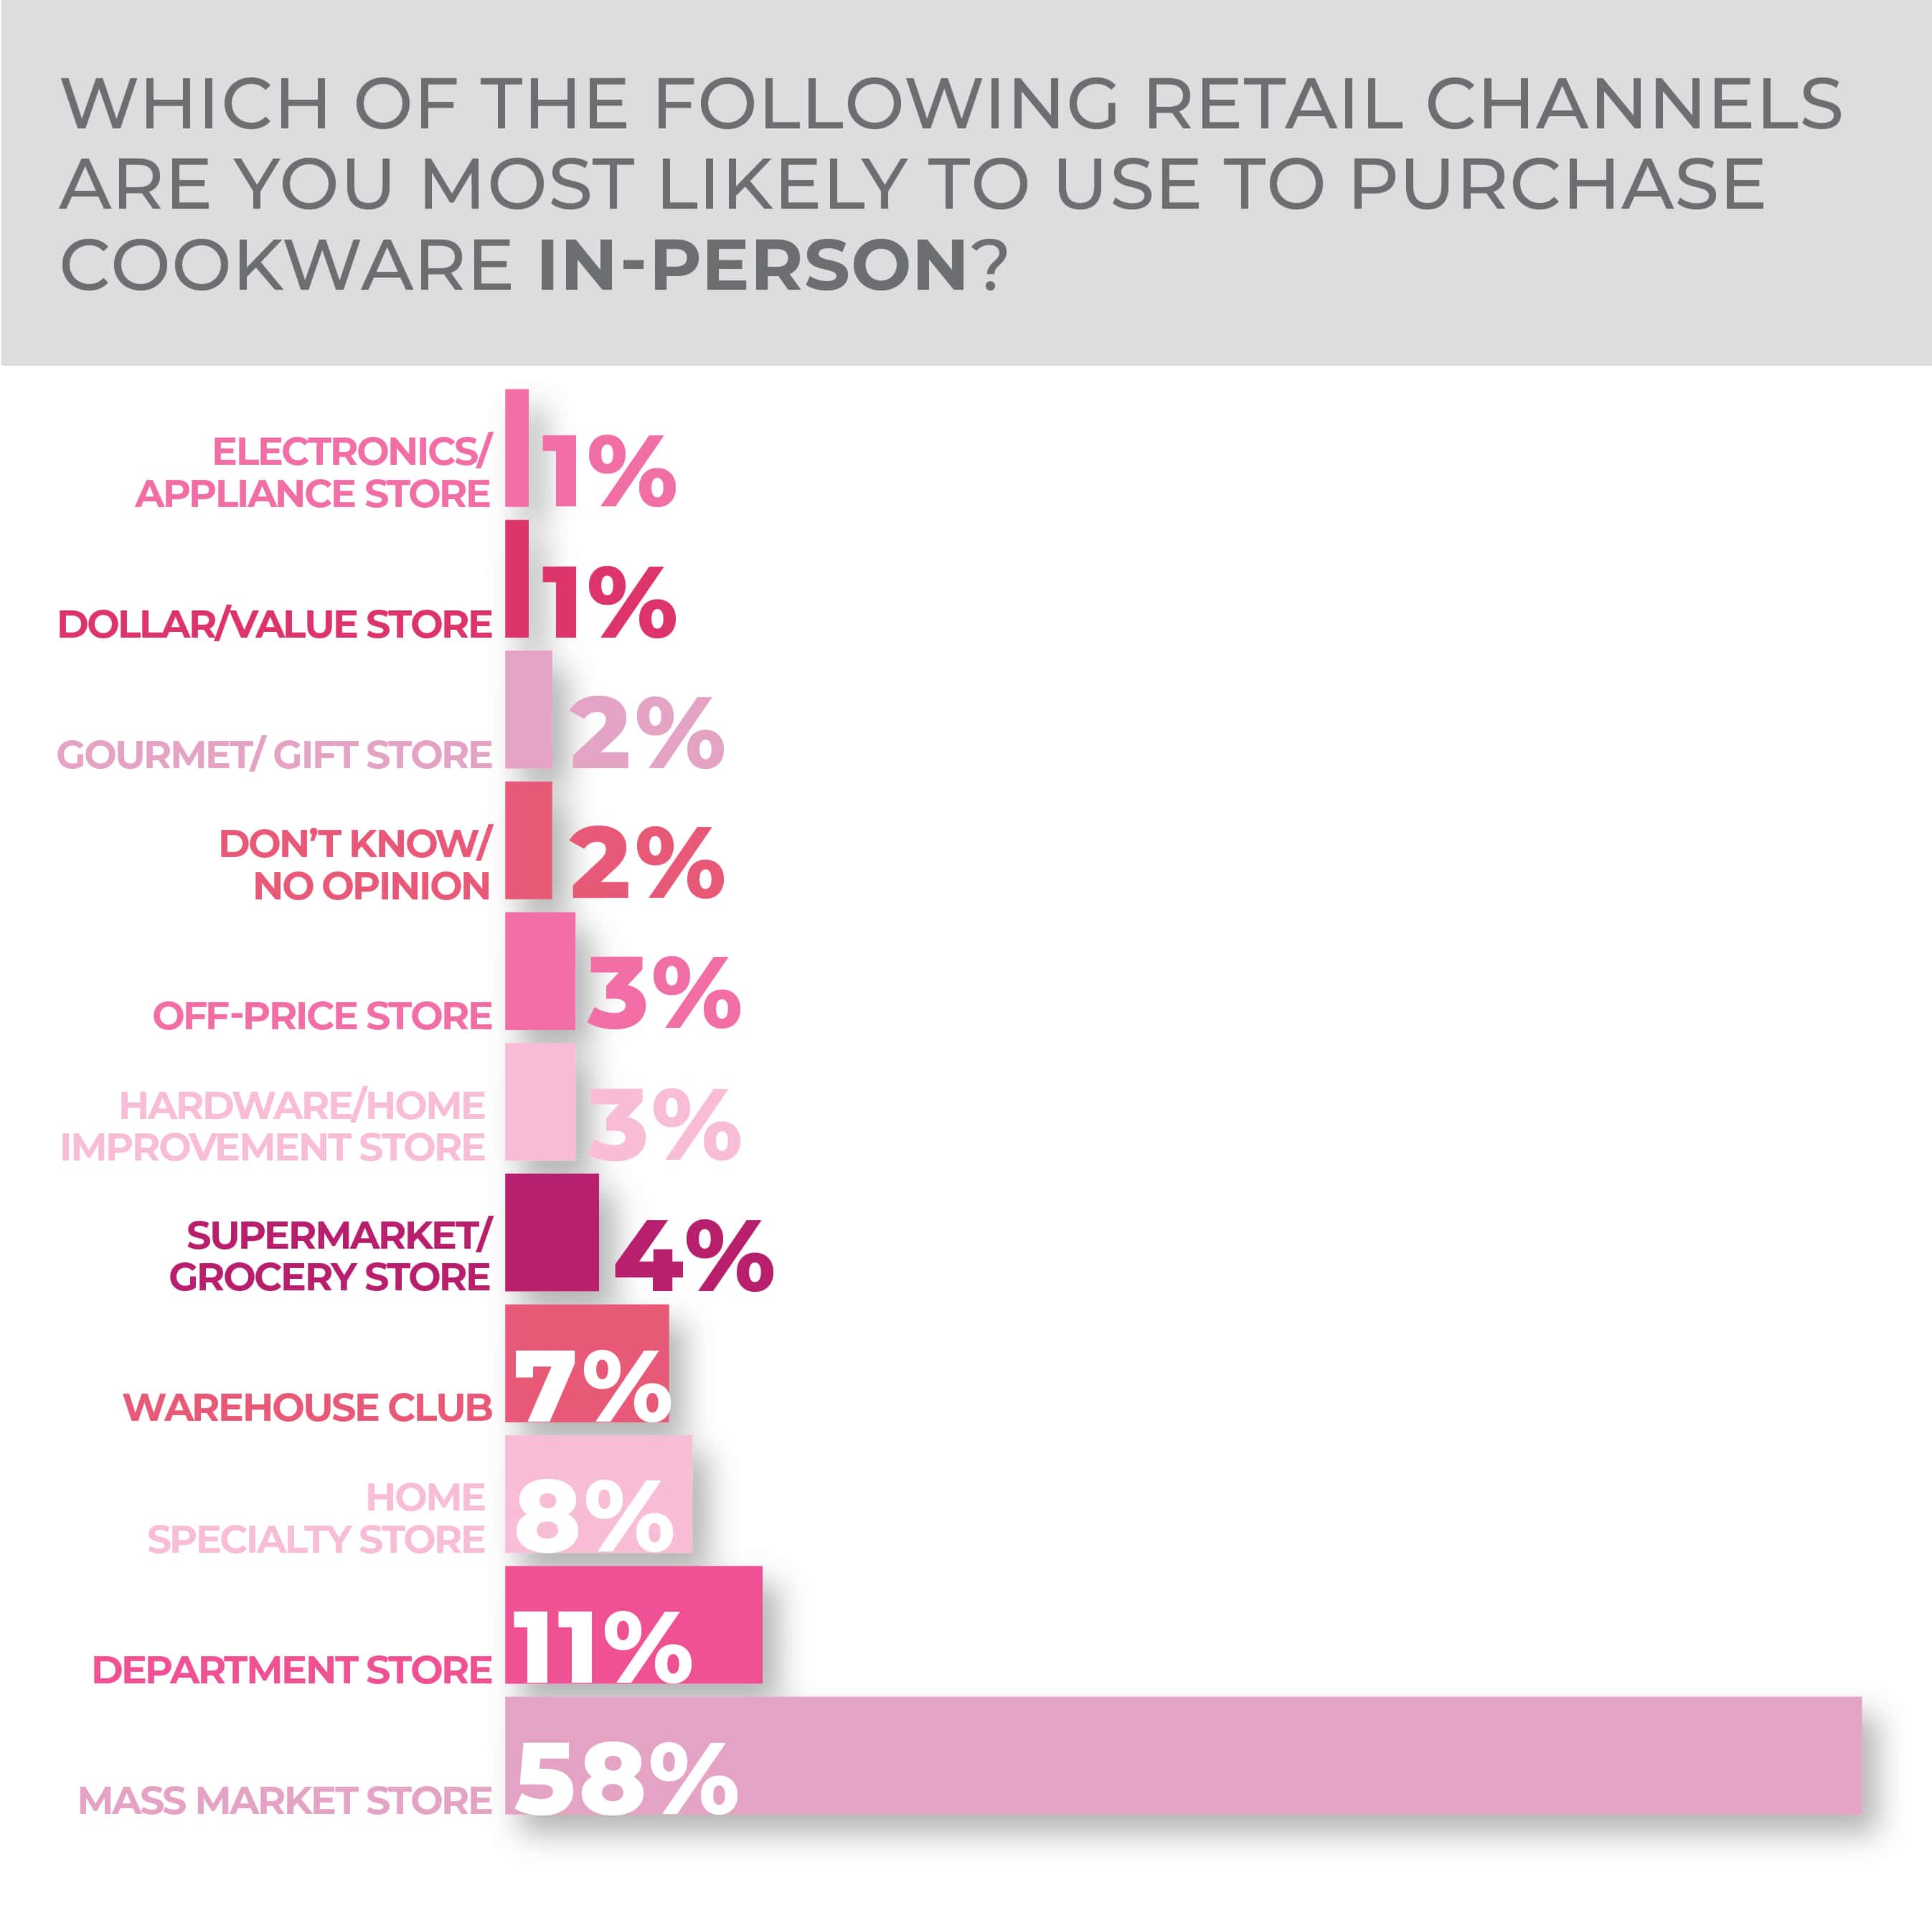
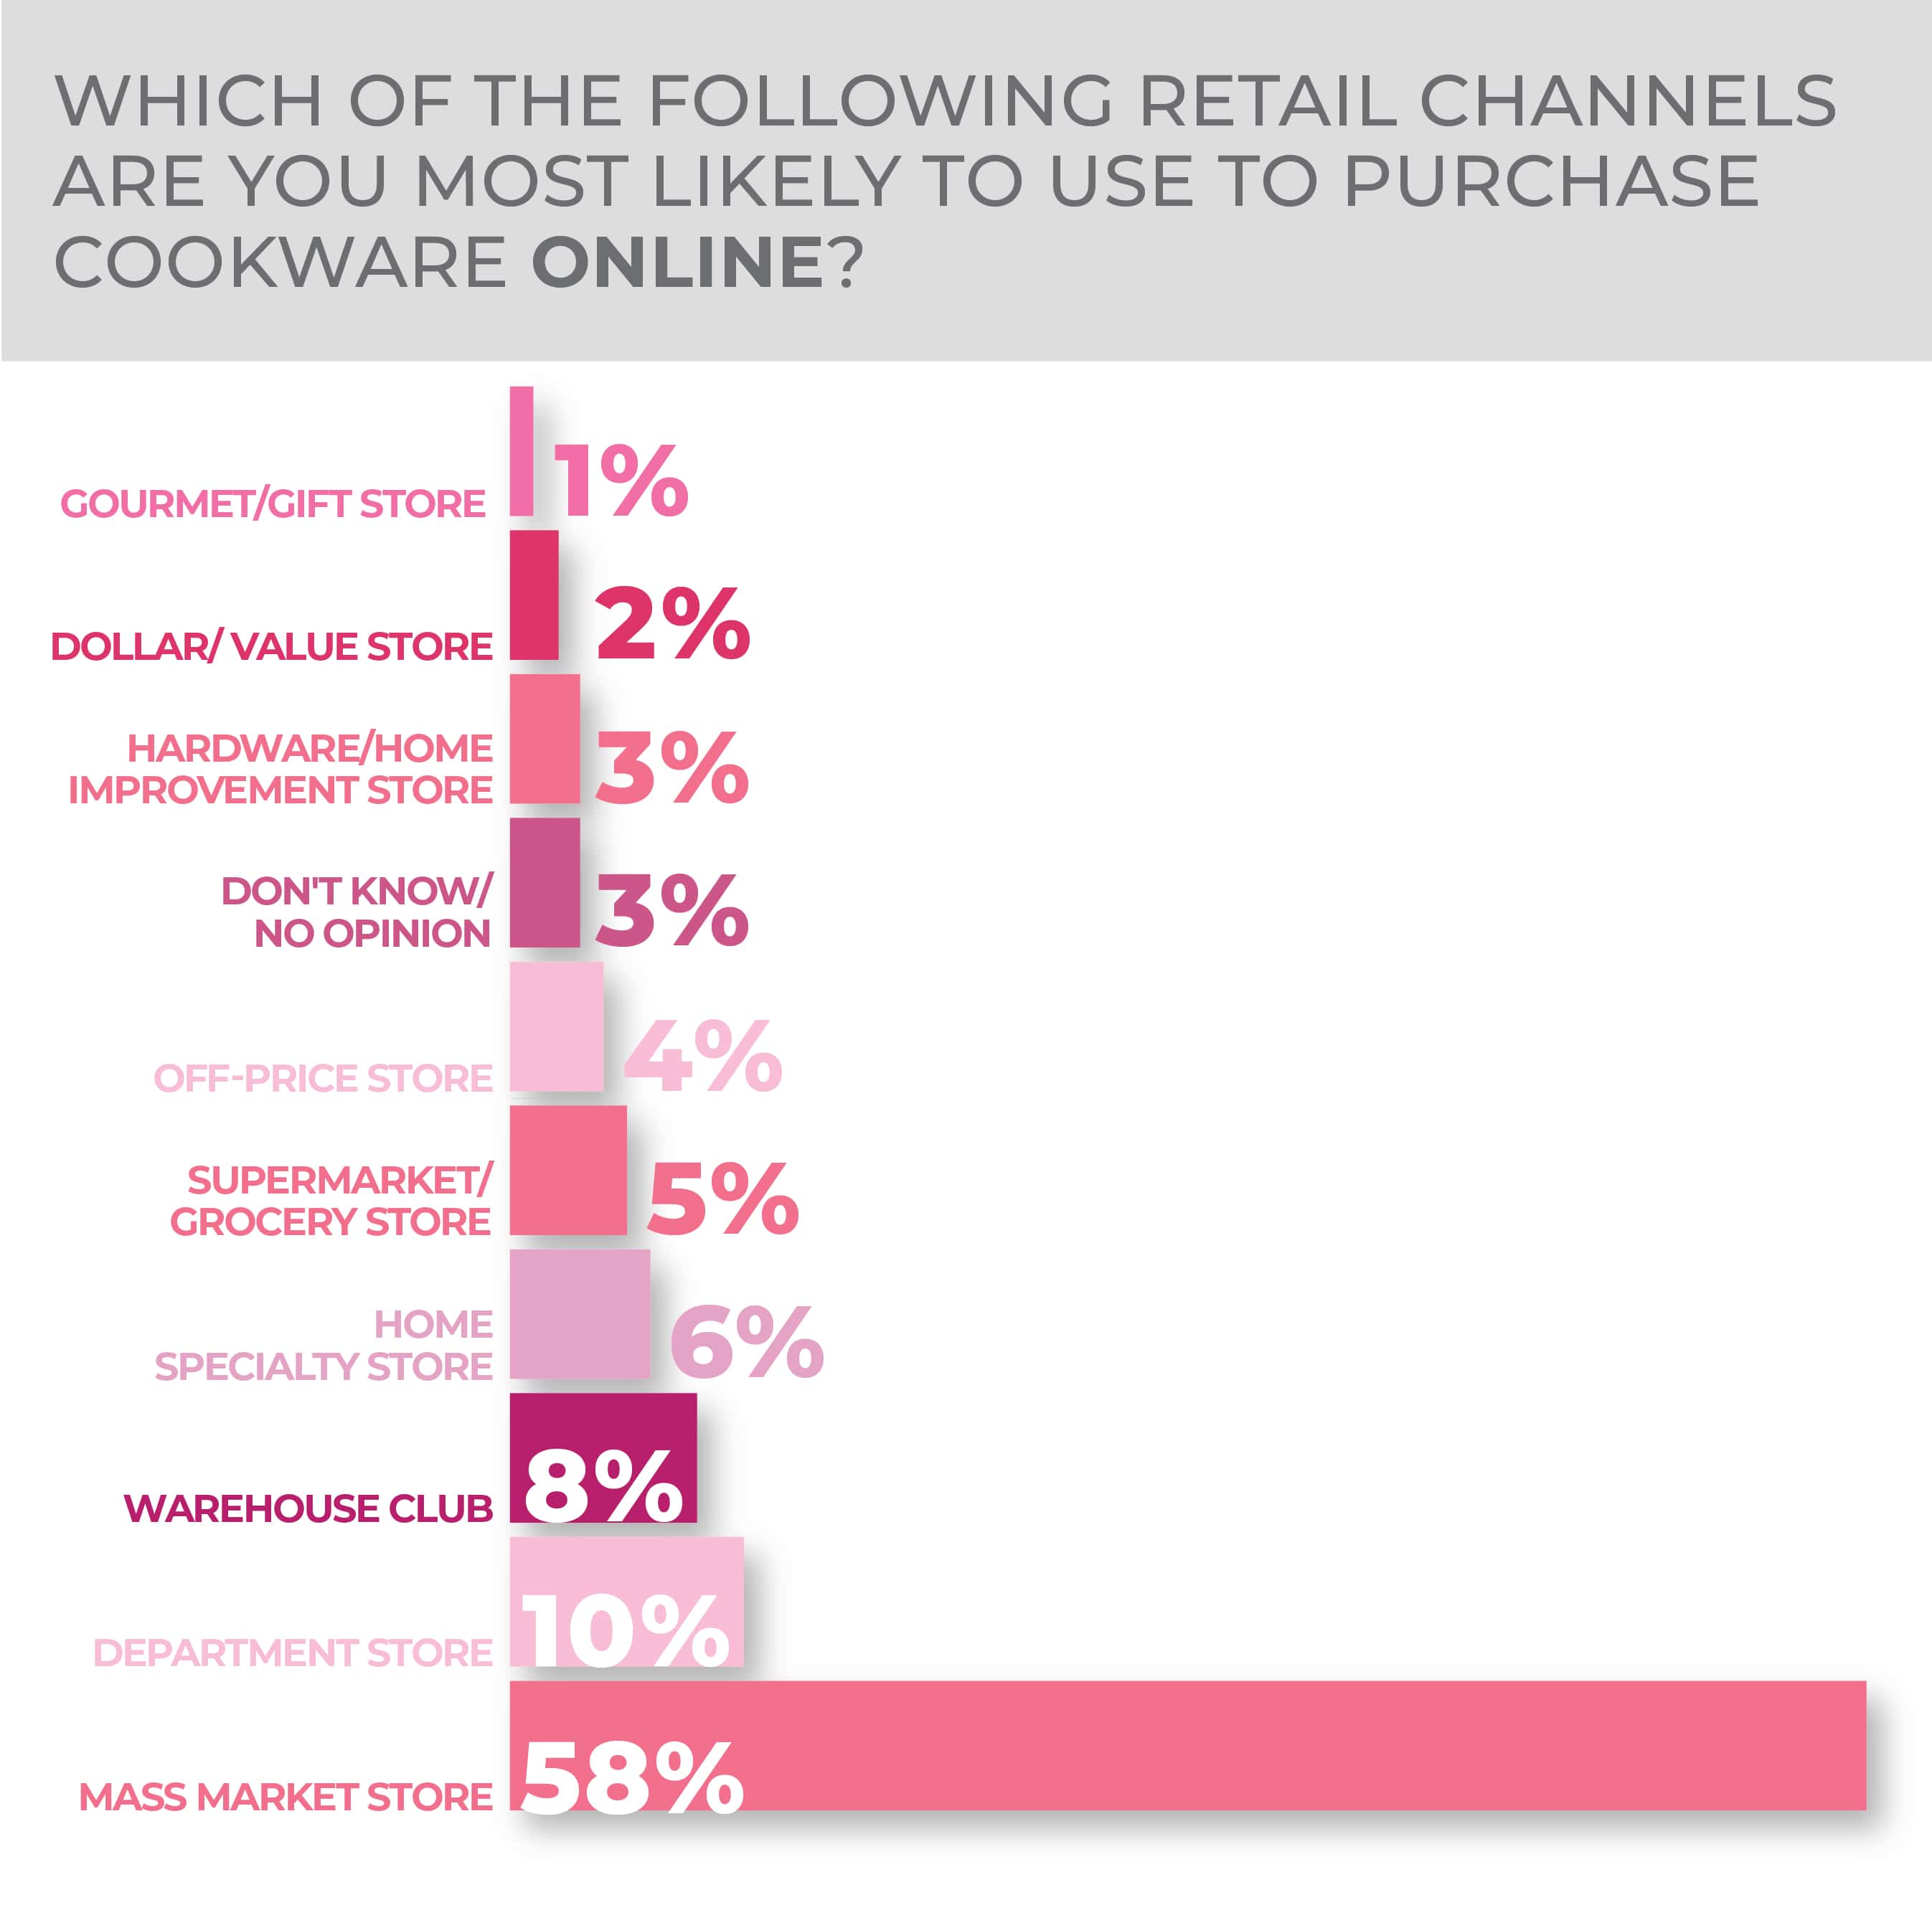
Consumers were equally likely to purchase cookware from a mass market store in-person and online at 58% in both categories. Purchasing from a department store was the next at both, at 11% for in-person and 10% for online.
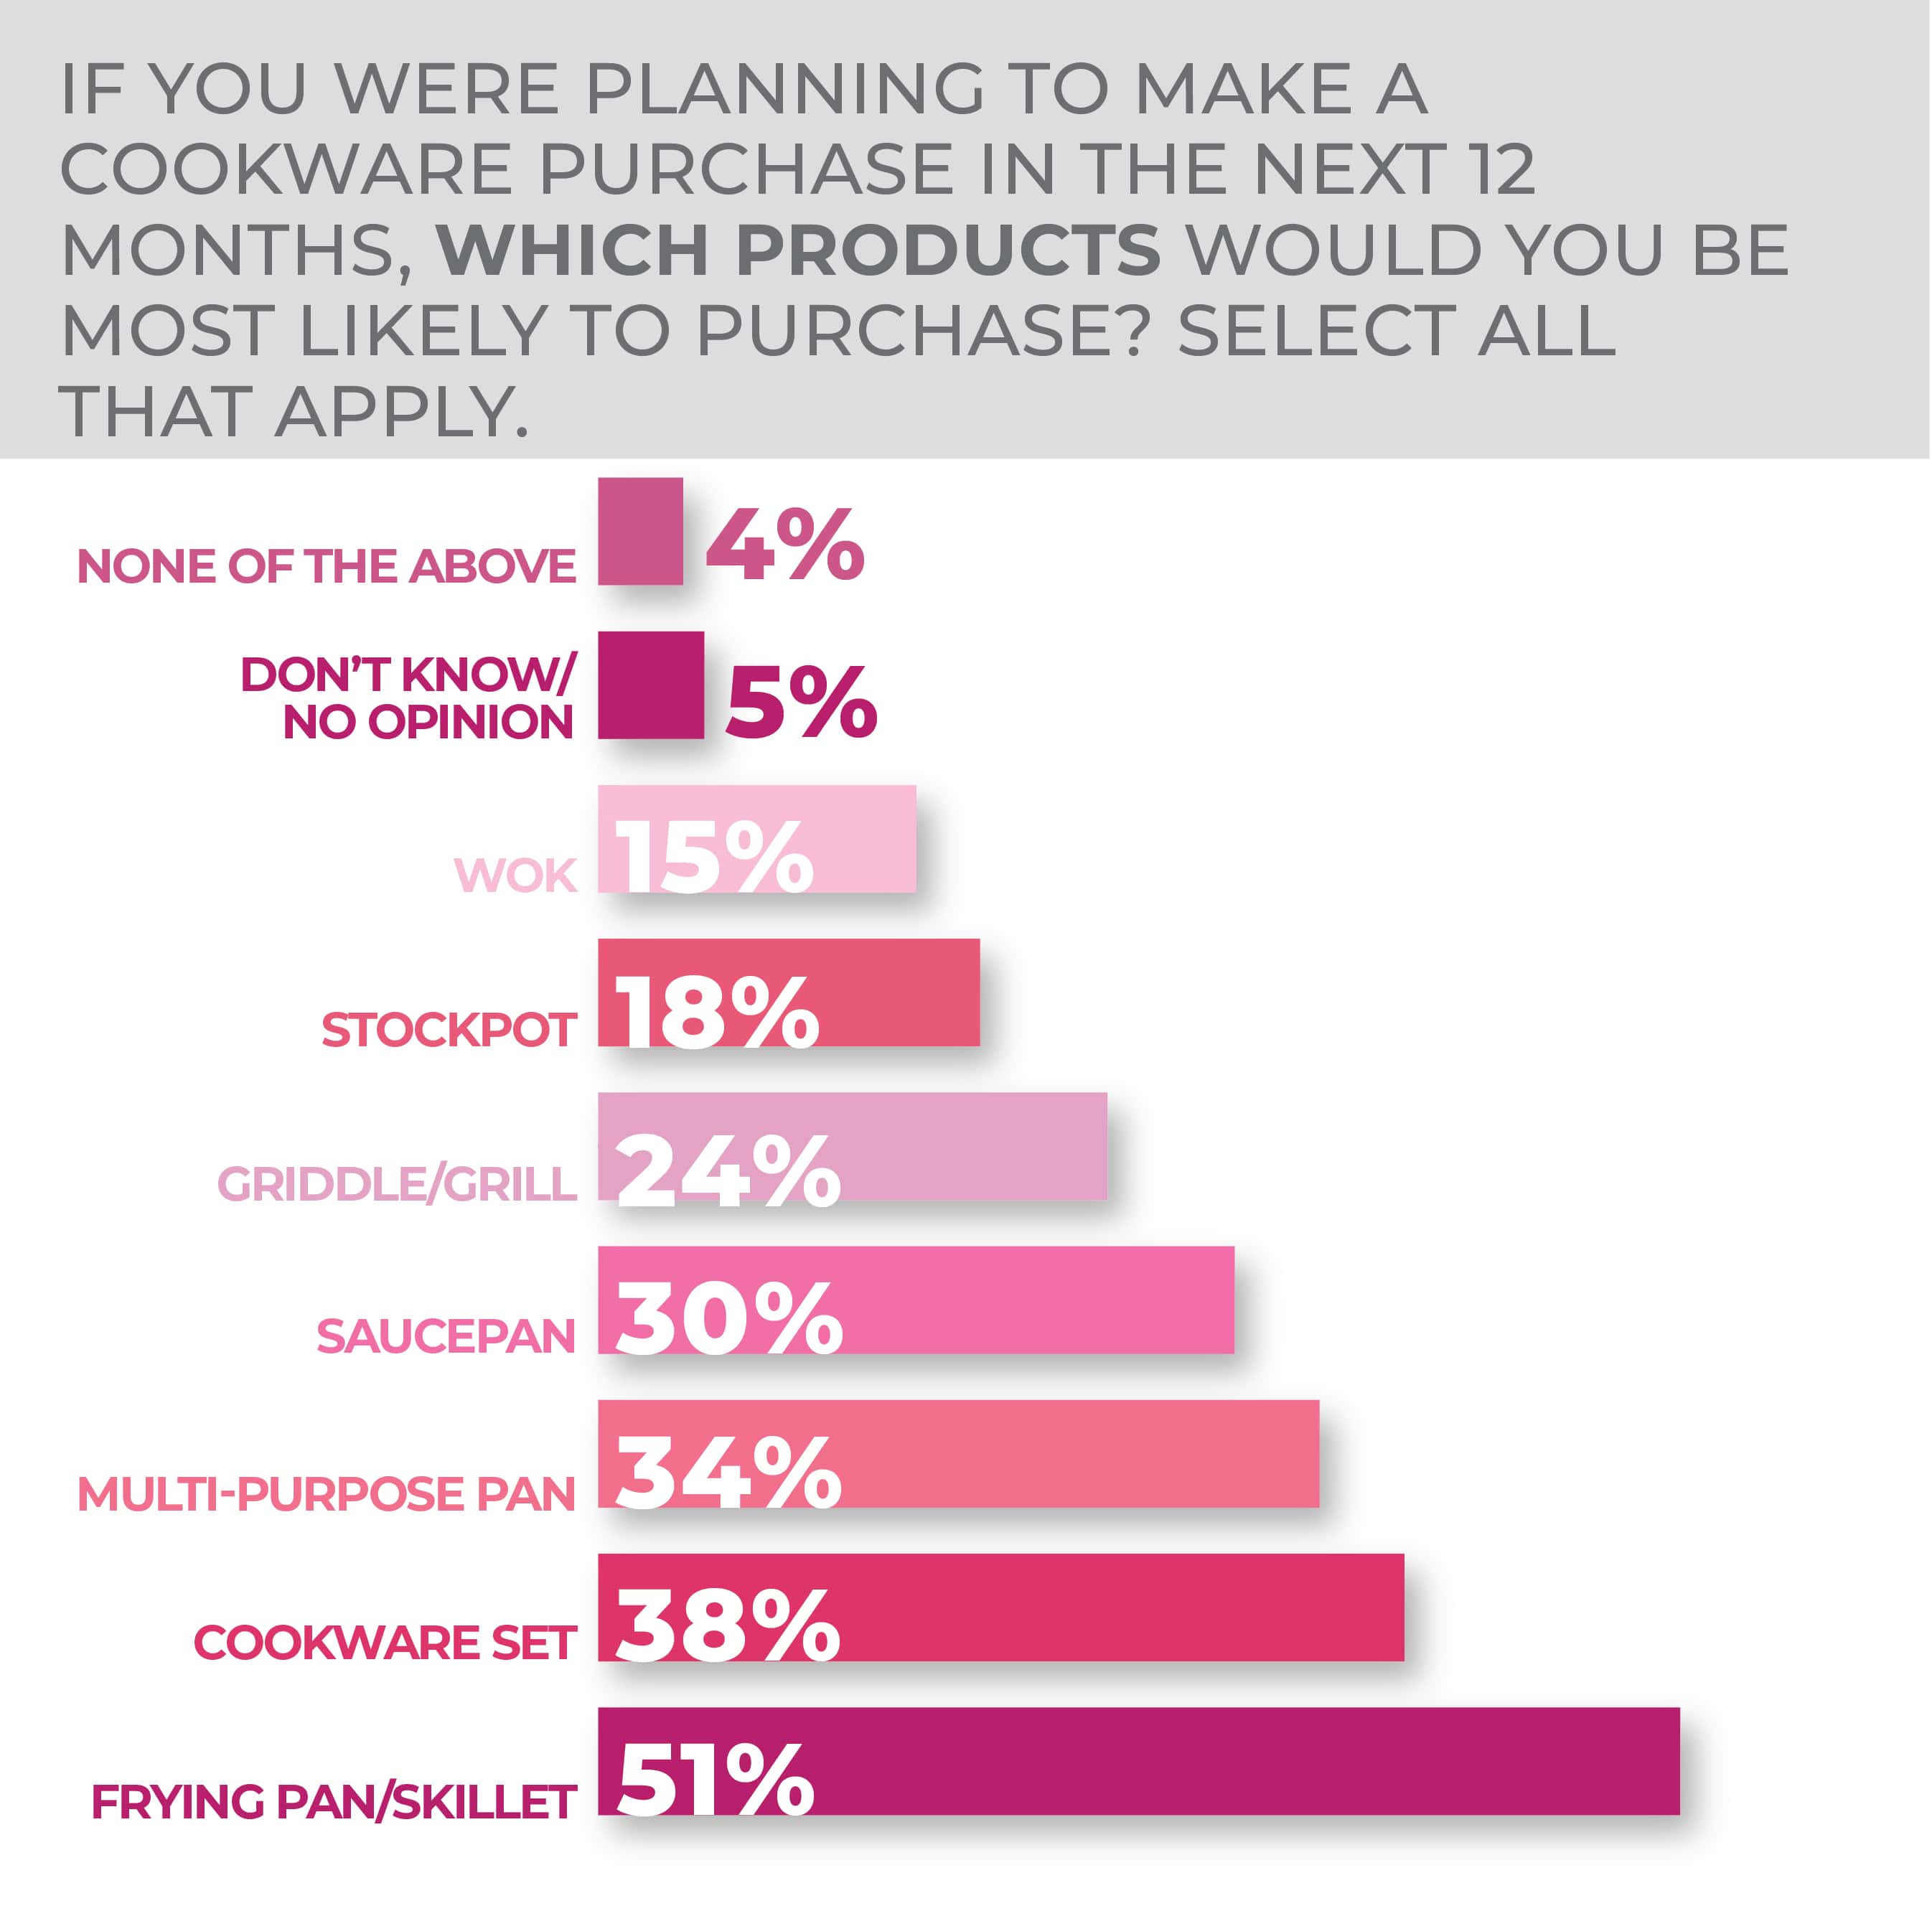
More than half of the respondents chose frying pans/skillets as the type of cookware they were most likely to purchase at 51%. Cookware sets (34%), multi-purpose cookware (34%), saucepans (30%), griddles/grills (24%), stockpots (18%) and woks (15%) rounded out the answers.
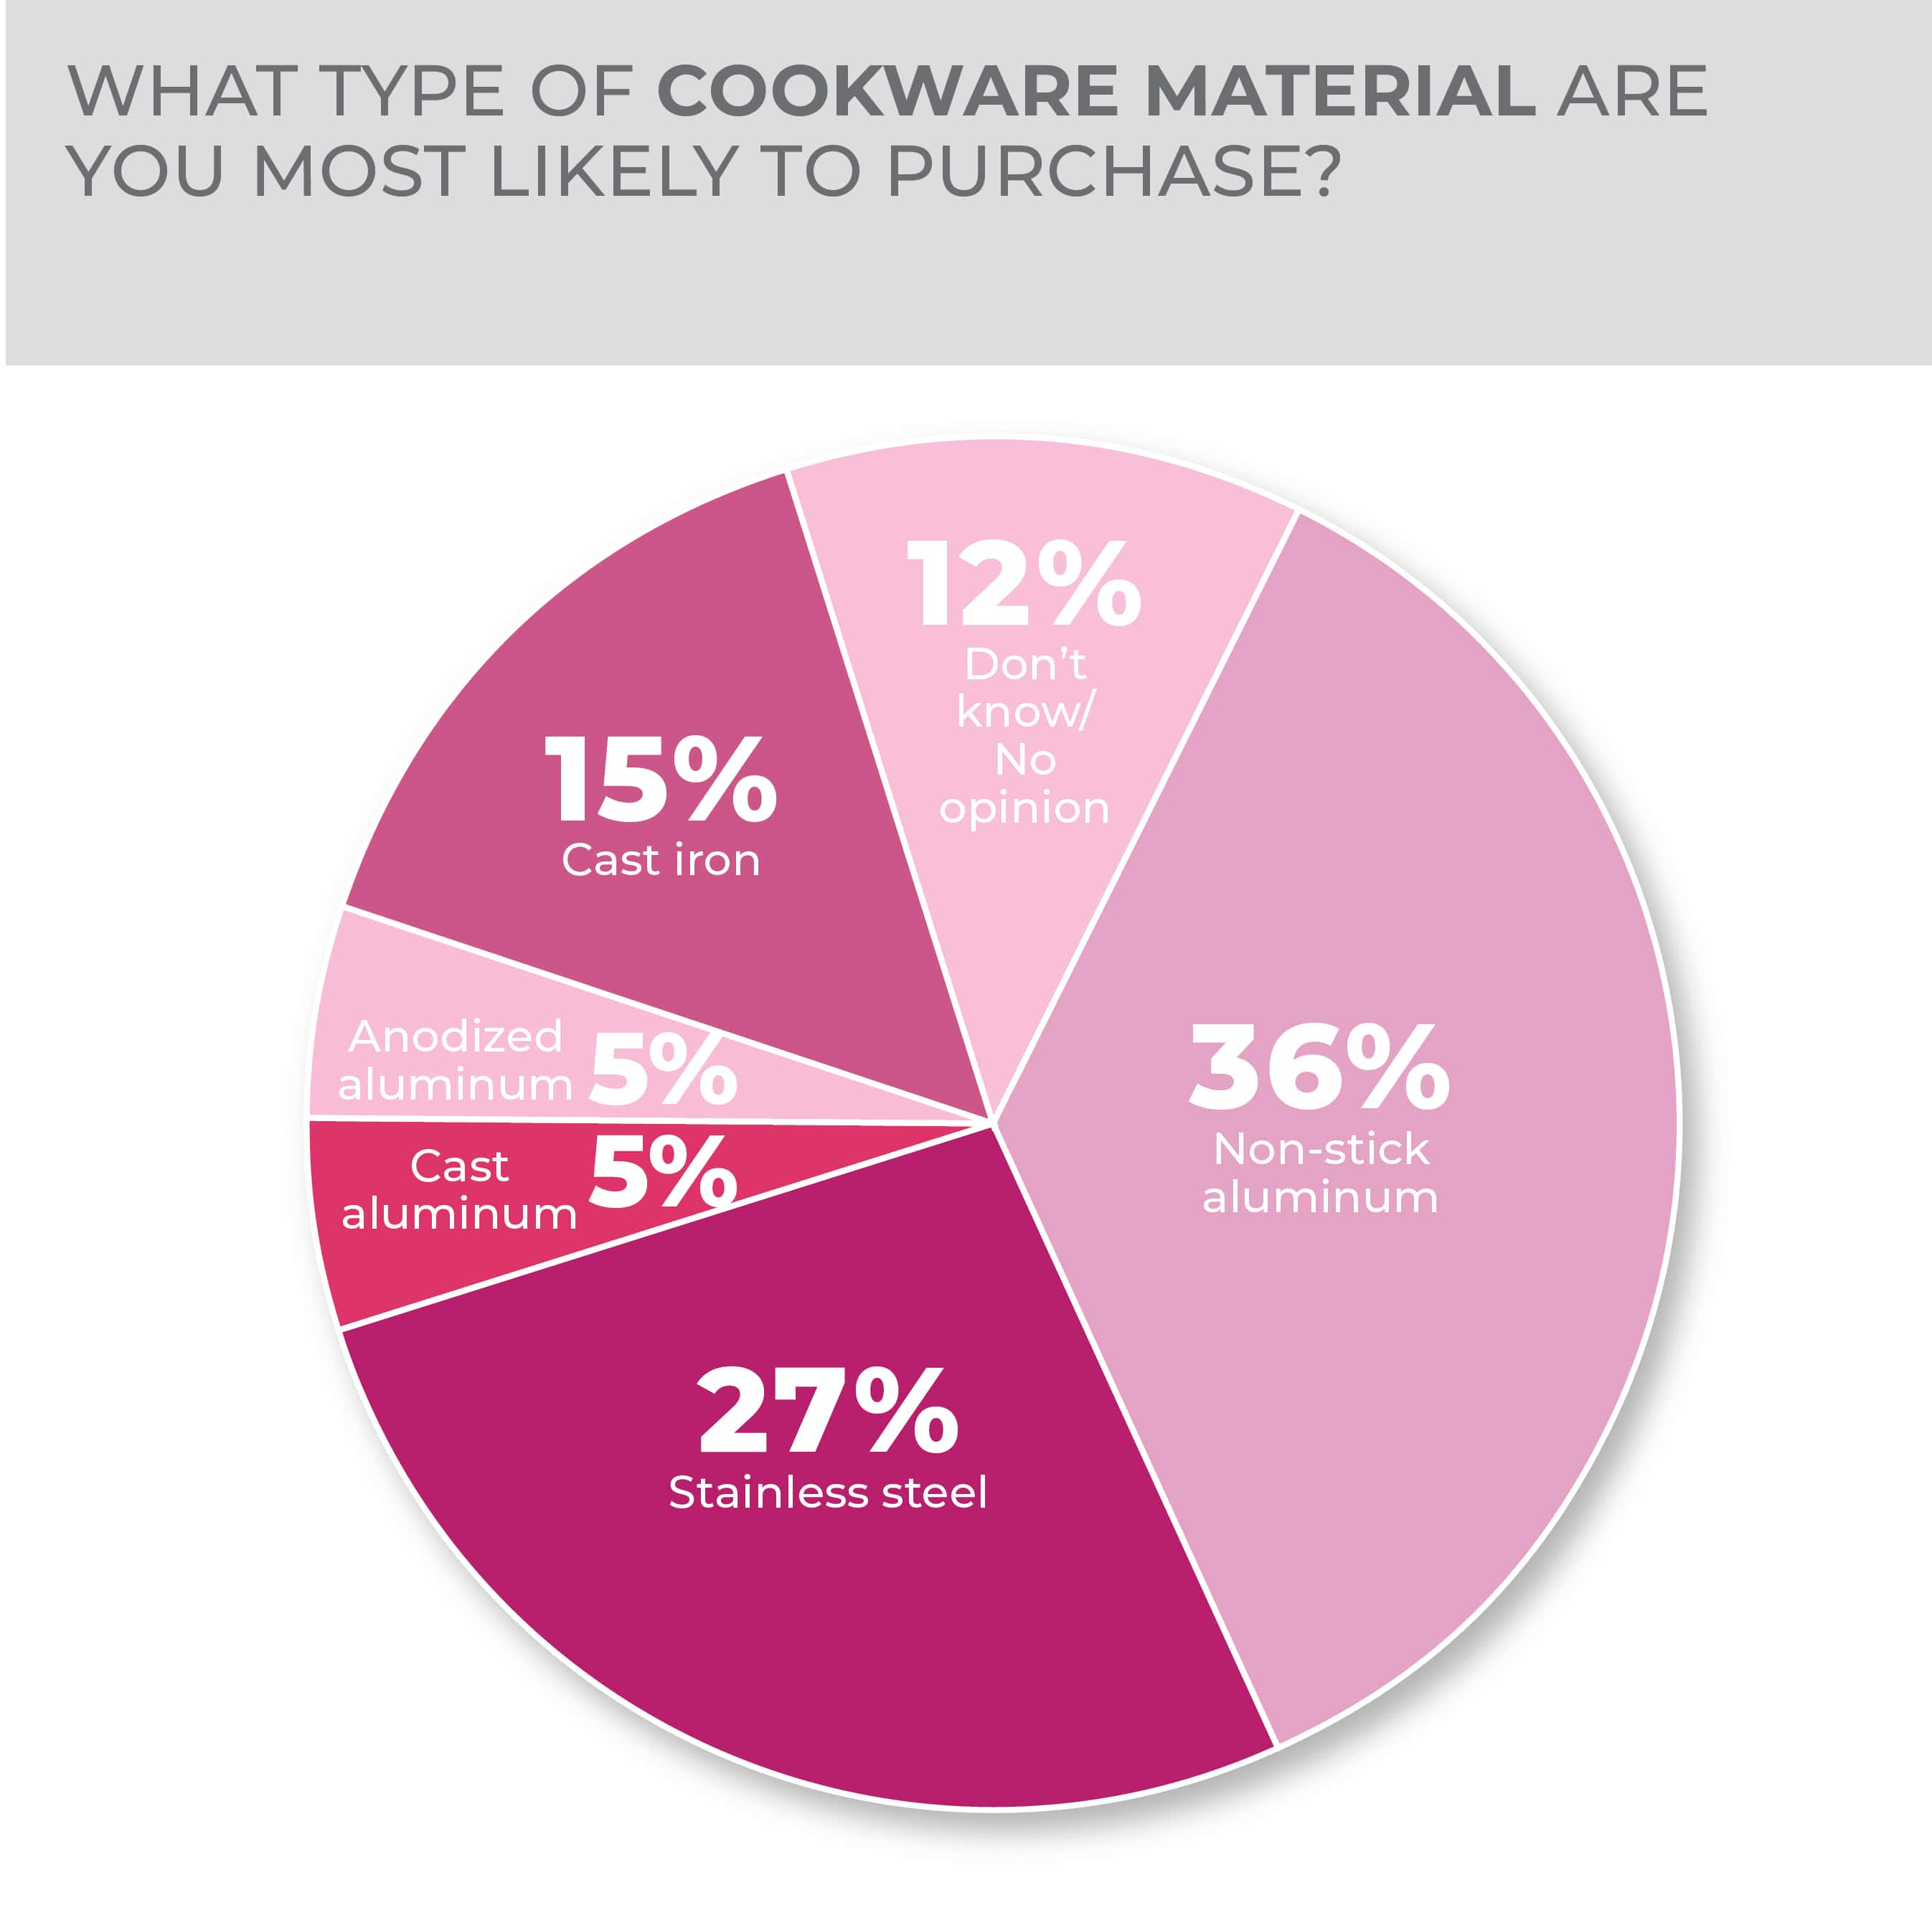
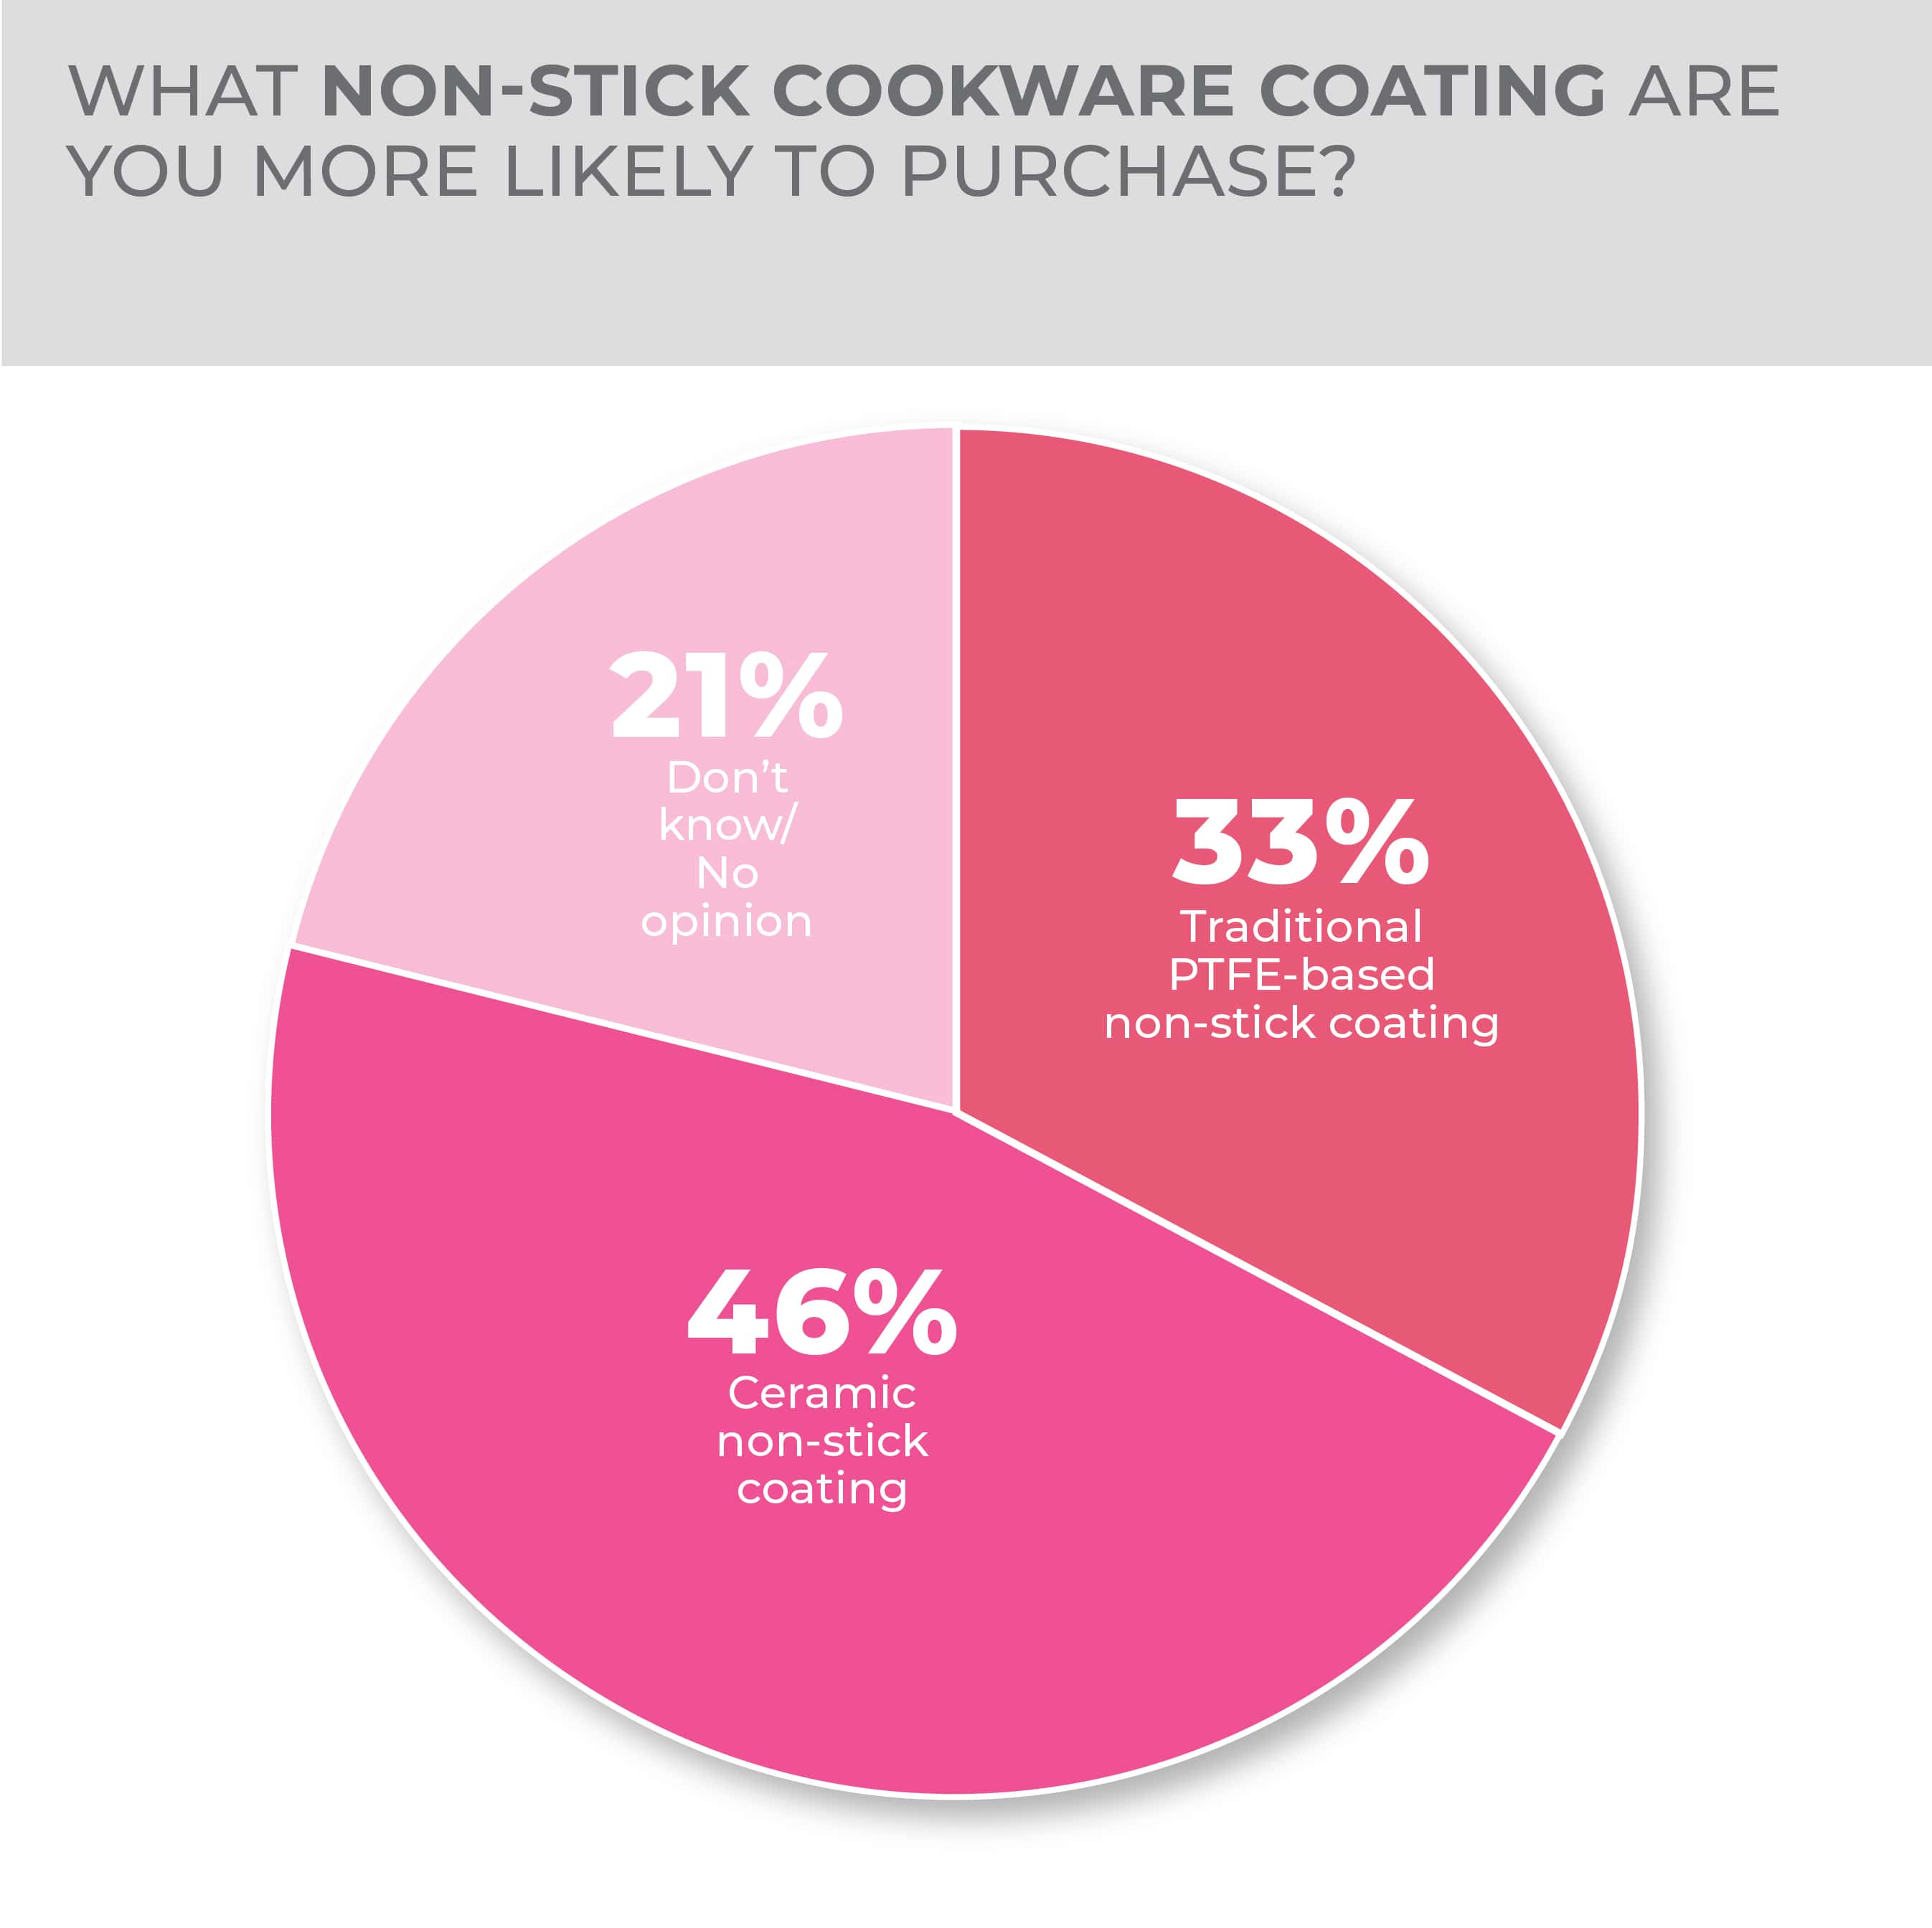
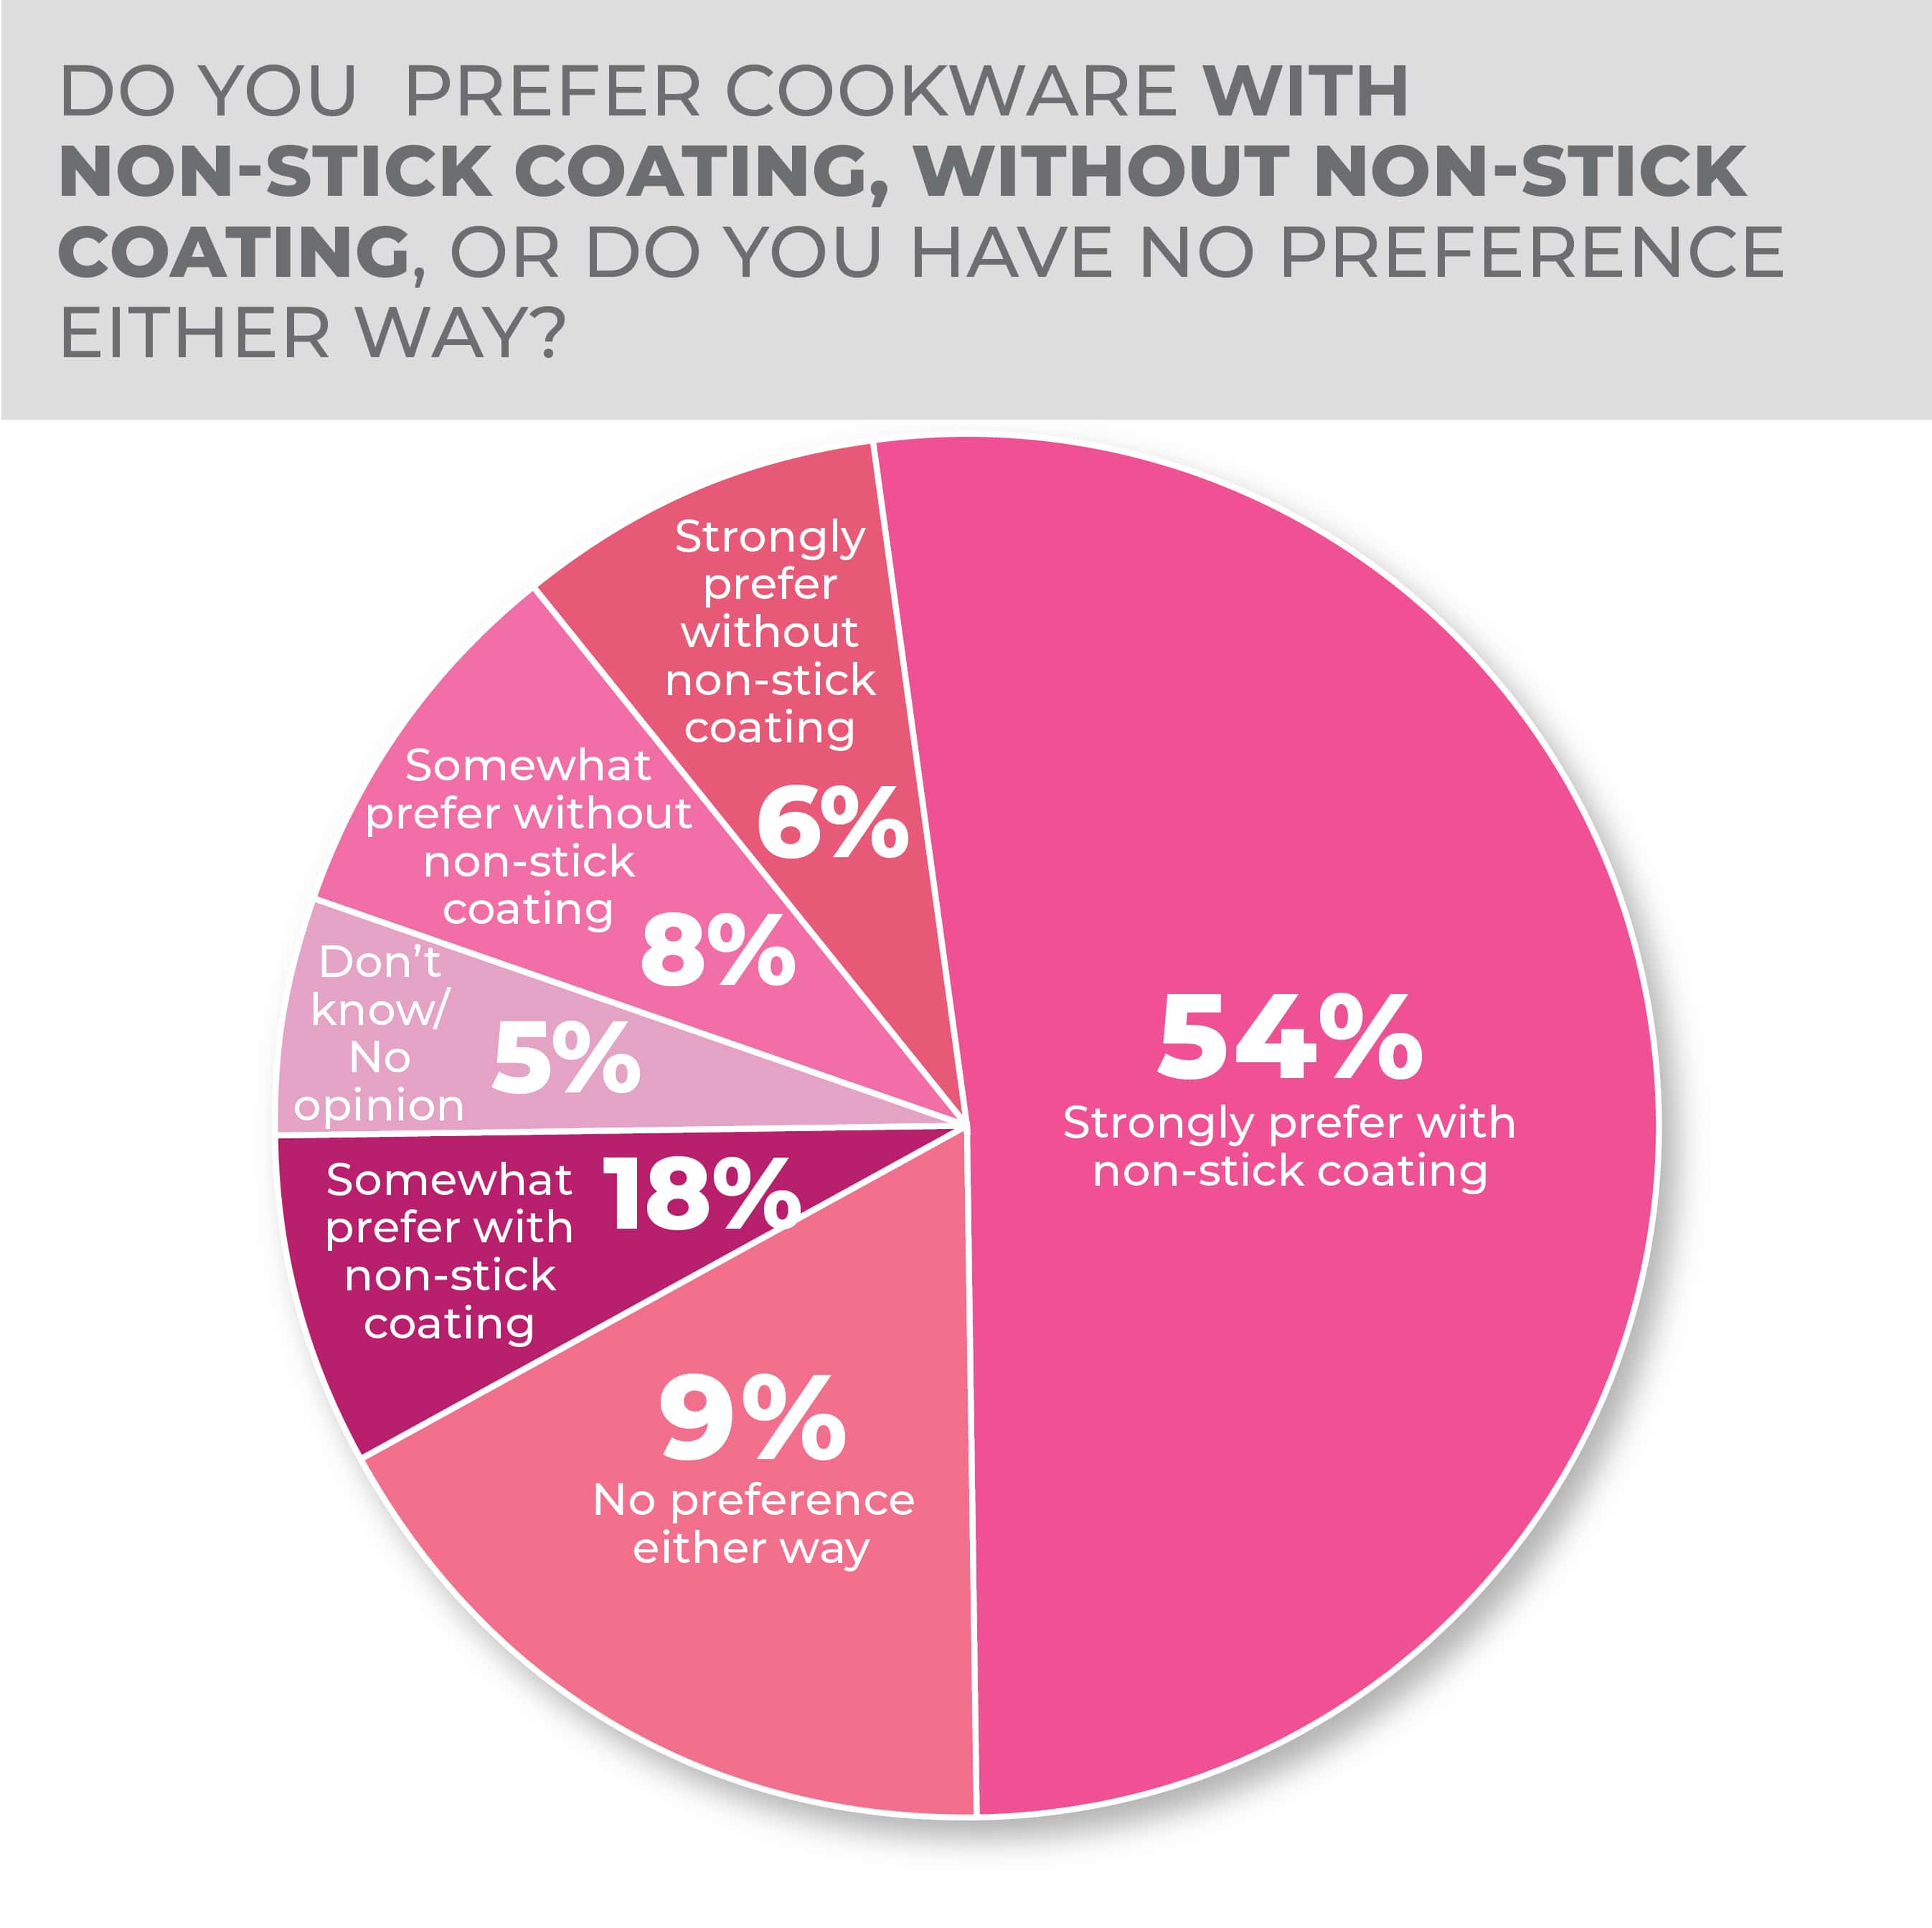
Non-stick aluminum and stainless steel were the top choices for cookware material, and most answered they strongly prefer their cookware with a non-stick coating, specifically a ceramic non-stick coating.
Generationally, Millennials were the most likely to purchase at 26%. Gen Zers came in second at 23%, followed by Gen X at 20%. Baby Boomers were least likely to purchase at 11%.
More Cookware Findings:
Cutlery
Consumers embraced the need for increased home food prep over the past three years, and as such, many households have demonstrated improved culinary knife skills and a continuing interest in new kitchen cutlery.
The market for kitchen cutlery is balanced across generations, according to the HomePage News 2023 Consumer Outlook Survey, but demand is sharper among younger consumers either entering the market for the first time or at the point where a step up to a better product, and more specialized options, is on their minds.
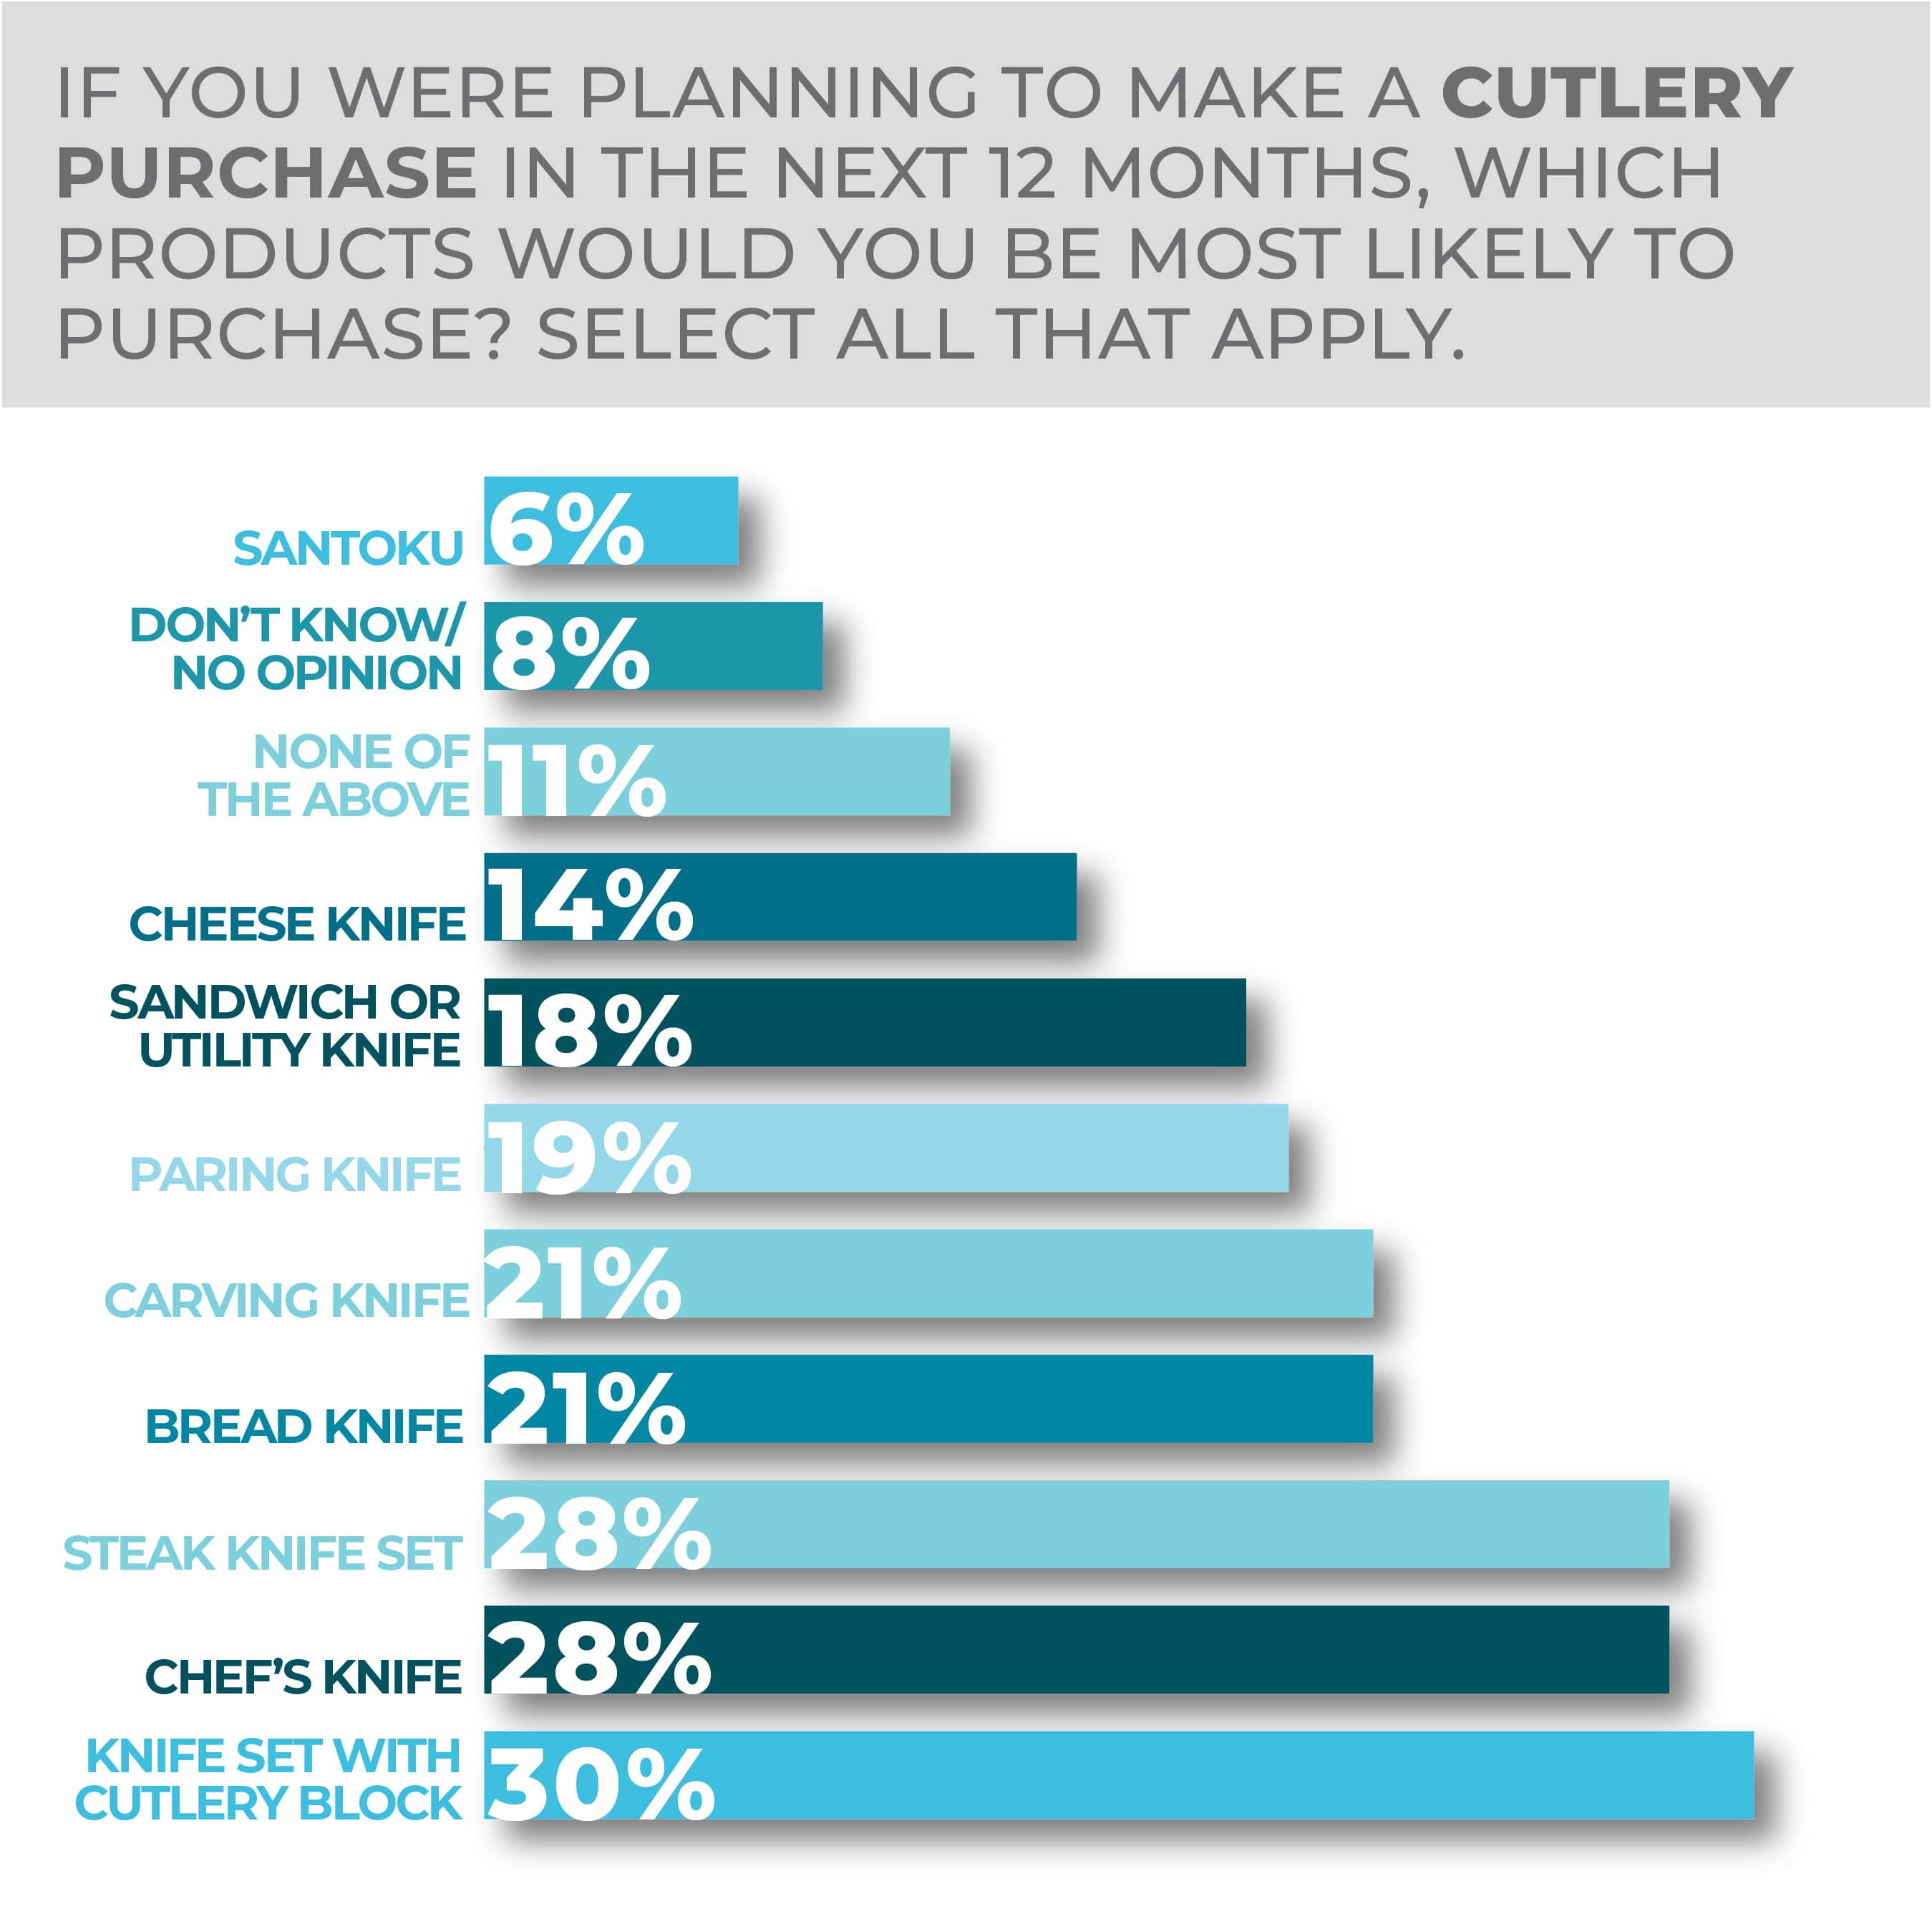
A chef’s knife remains the top choice (selected by 28% of respondents) among prospective cutlery purchasers. A preference for a wider variety of knives, however, is evident, with carving knife (21%), utility knife (18%), bread knife (21%) and paring knife (19%) each coming in among the top selections. Despite the balanced demand across such specialty knives as open-stock options, the value of block sets remains strong in the category with 30% preferring such a purchase configuration.
Compared to last year’s survey, the top three choices remain the same though they did all fall in percentage. The knife set with cutlery block and the chef’s knife both fell three points while the steak knife fell one point. The largest drop year over year was the Santoku knife falling 12%.
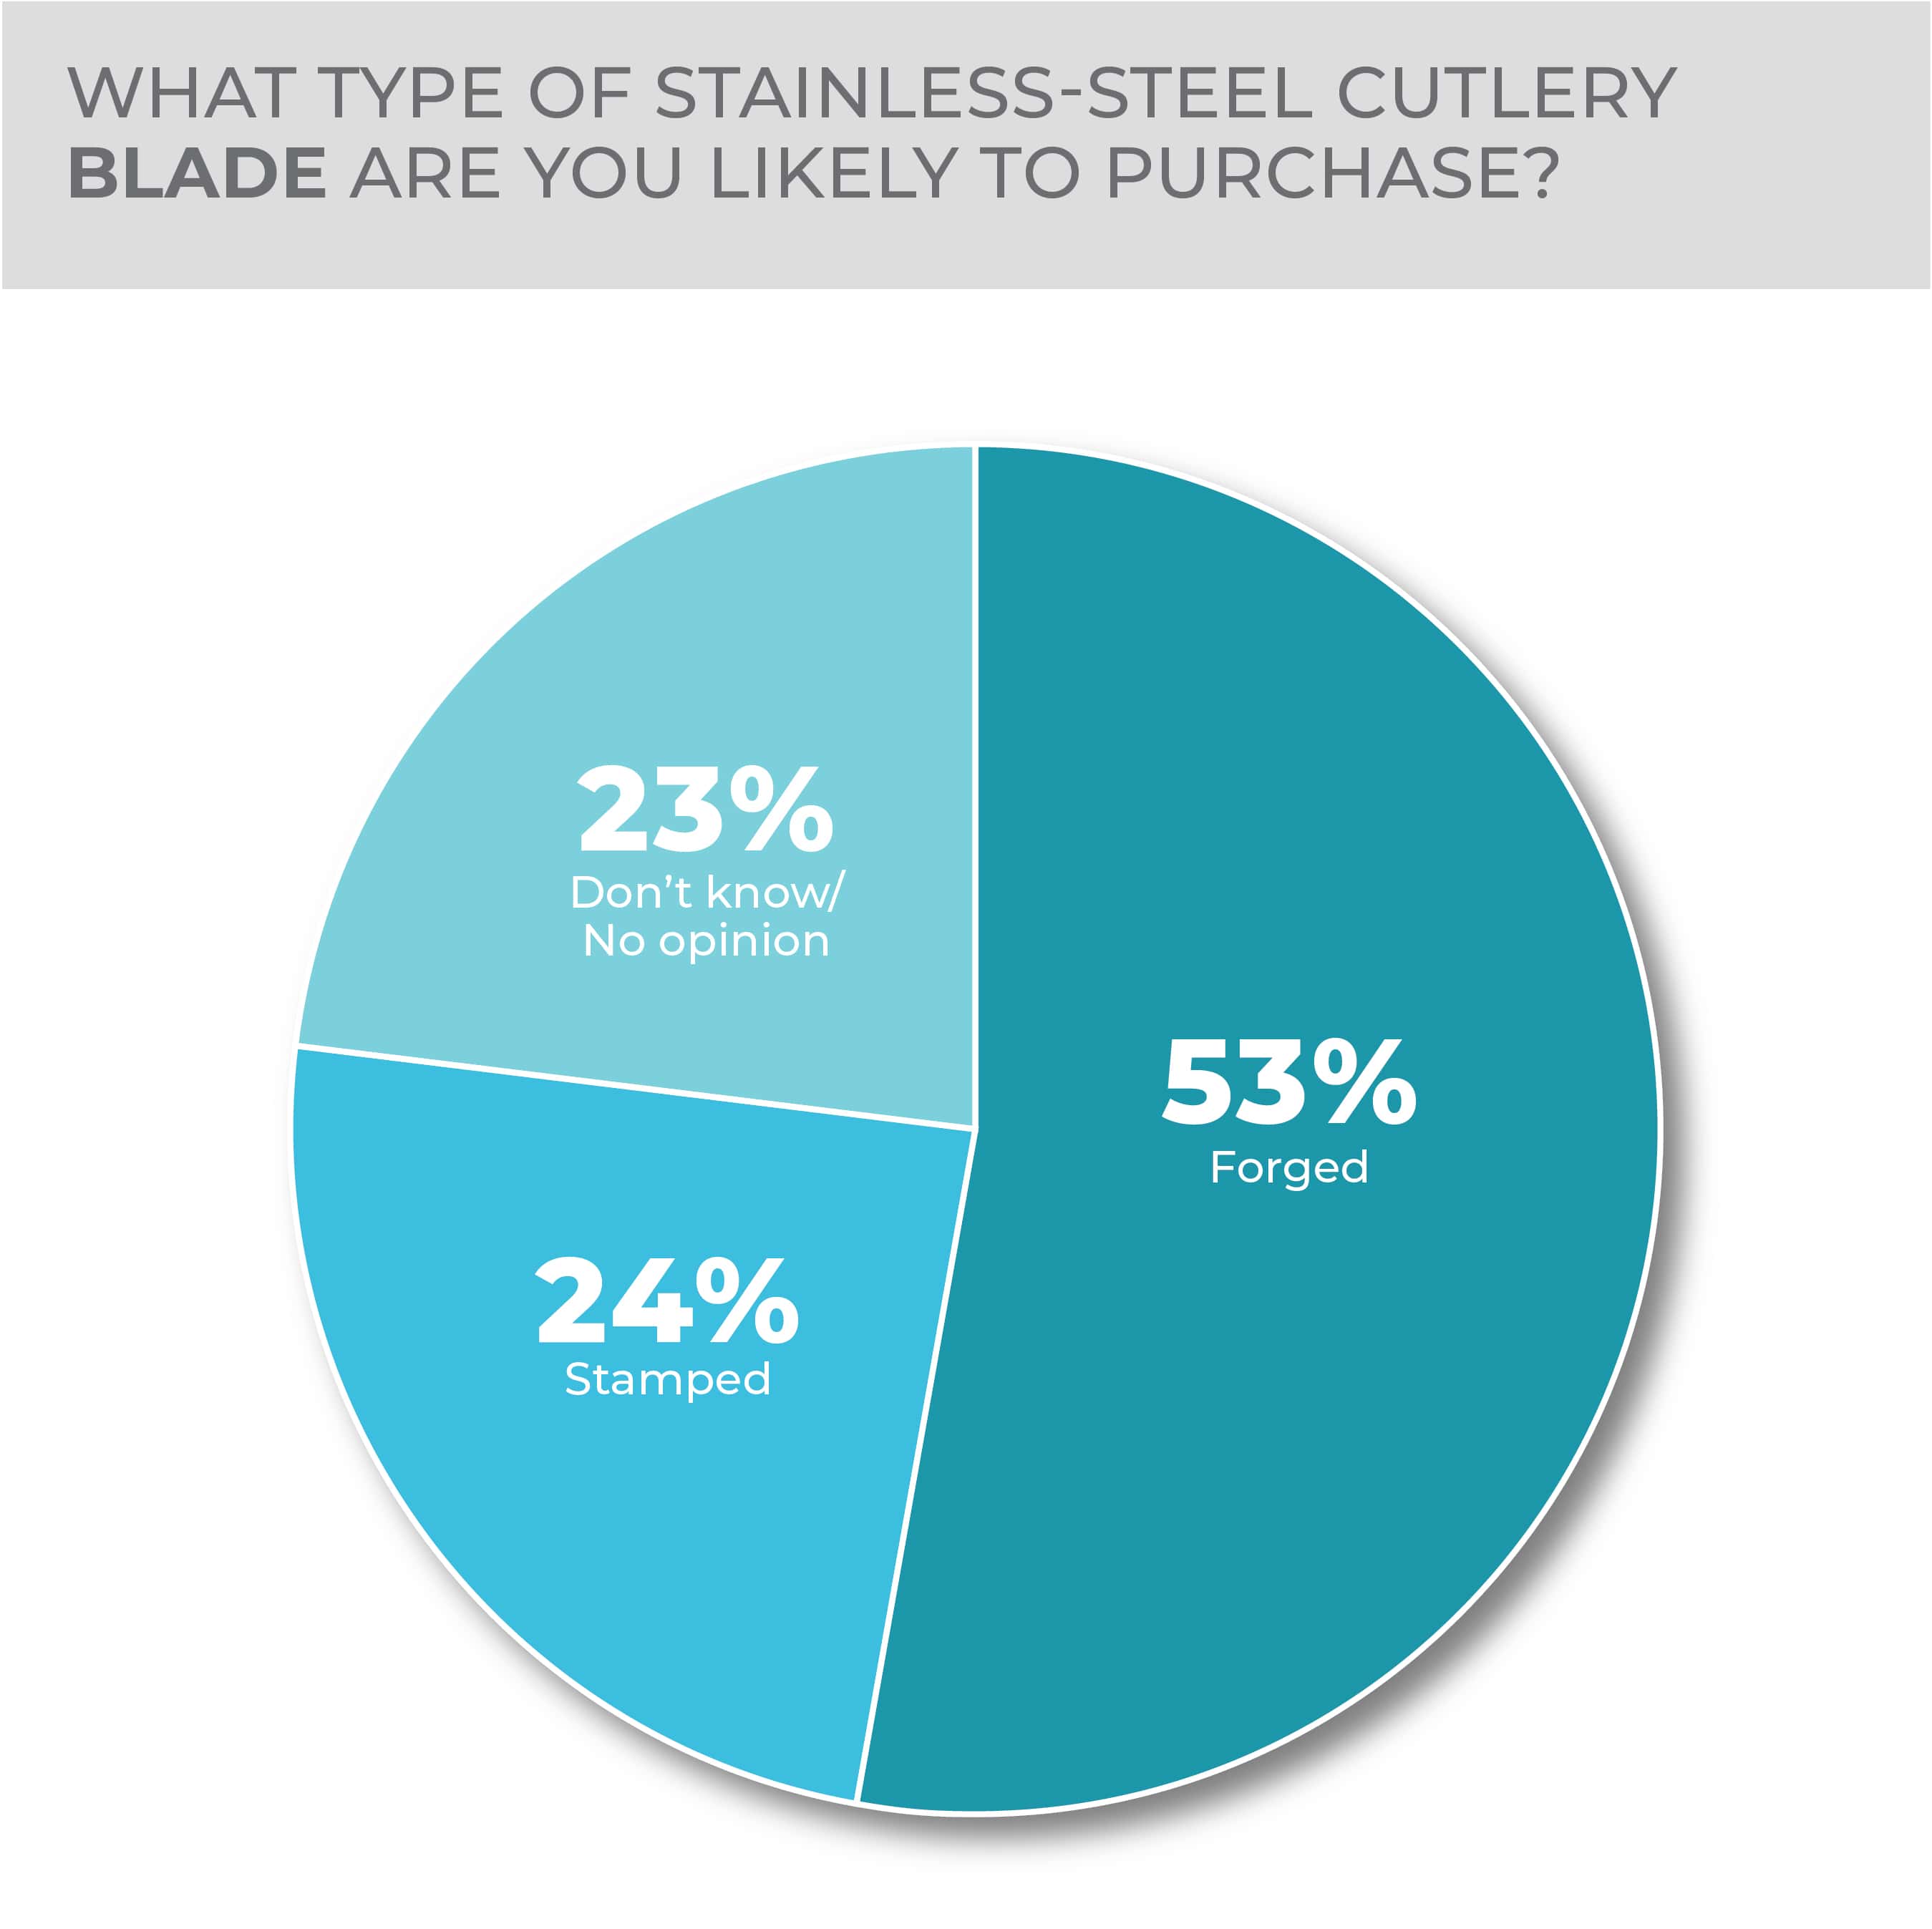
Consumers surveyed, perhaps having done more to investigate cutlery techniques and construction in the past couple of years, lean strongly toward a preference for forged cutlery (selected by 53%) over stamped knives (24%). Don’t know/no opinion came in at 23%, a fairly significant number.
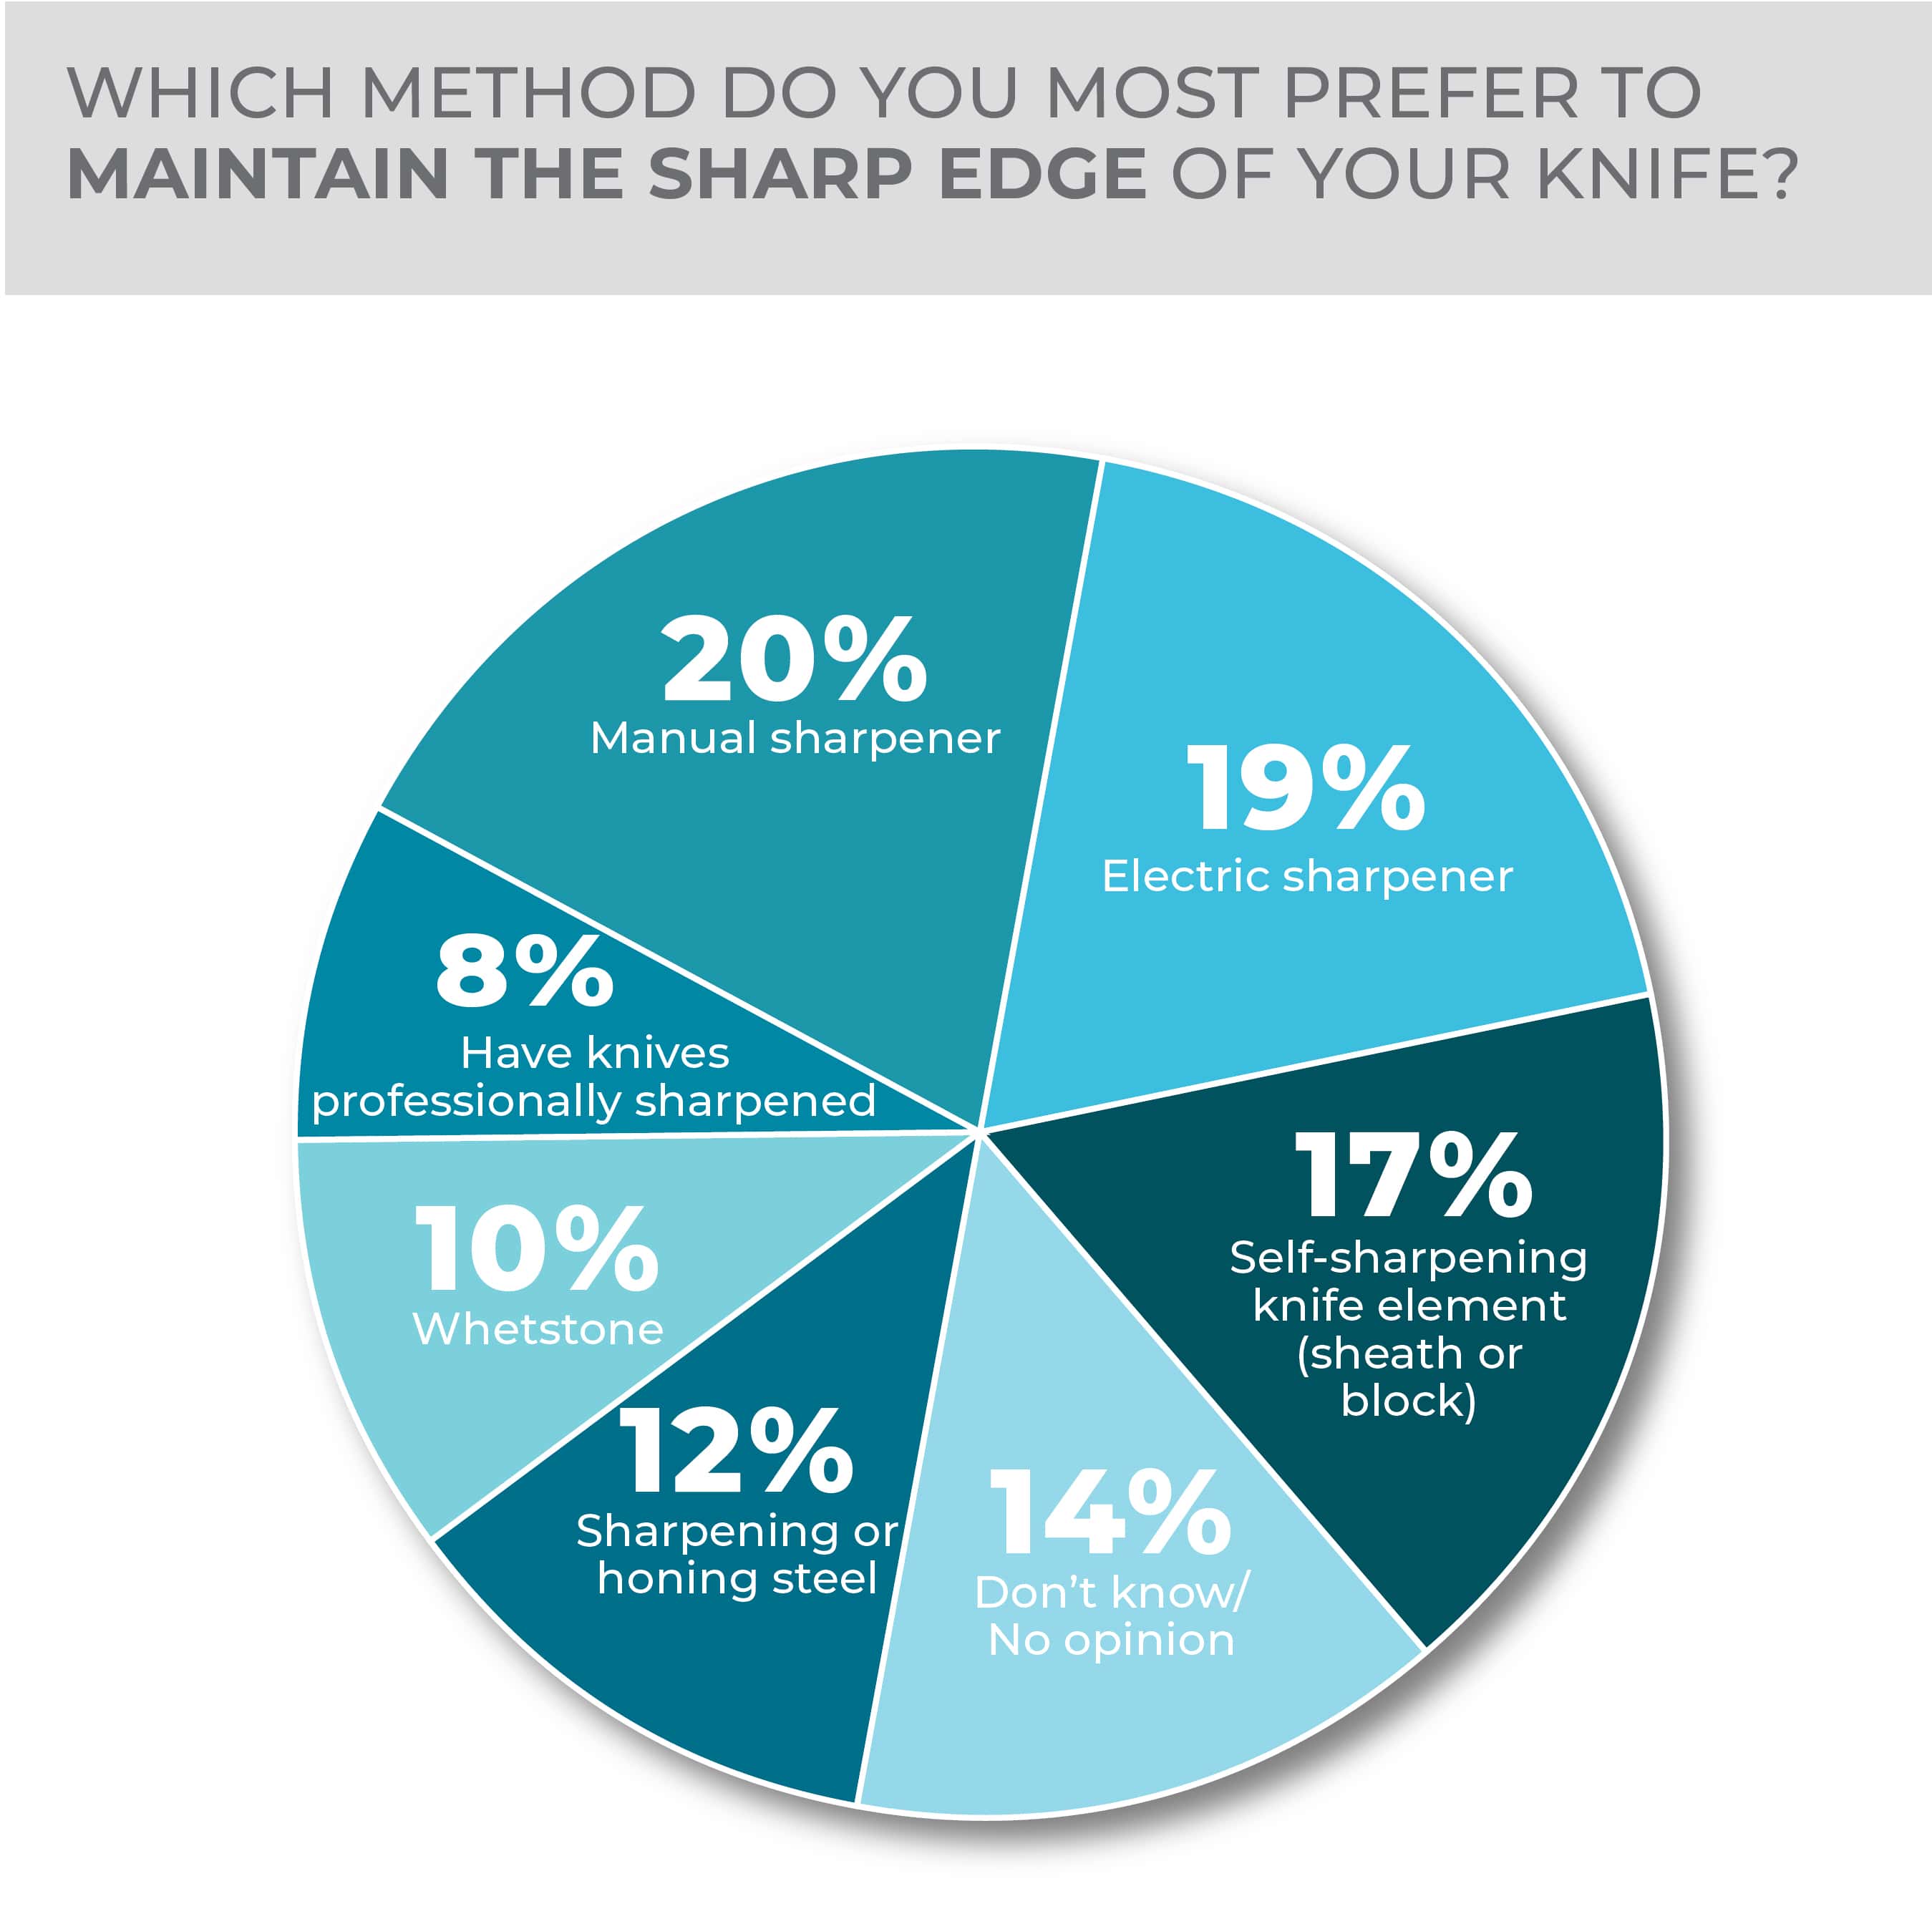
Increased demand for better cutlery offers a strong aftermarket opportunity for cutlery accessories, including sharpeners and cutting boards. In response to a question about the type of sharpener most likely to be bought. manual sharpeners (selected by 20%) edged electric sharpeners (19%).
The cutting board market, meanwhile, has become a focal point of functional and material innovation, particularly when it comes to sustainability and food safety by way of the prevention of food contamination.
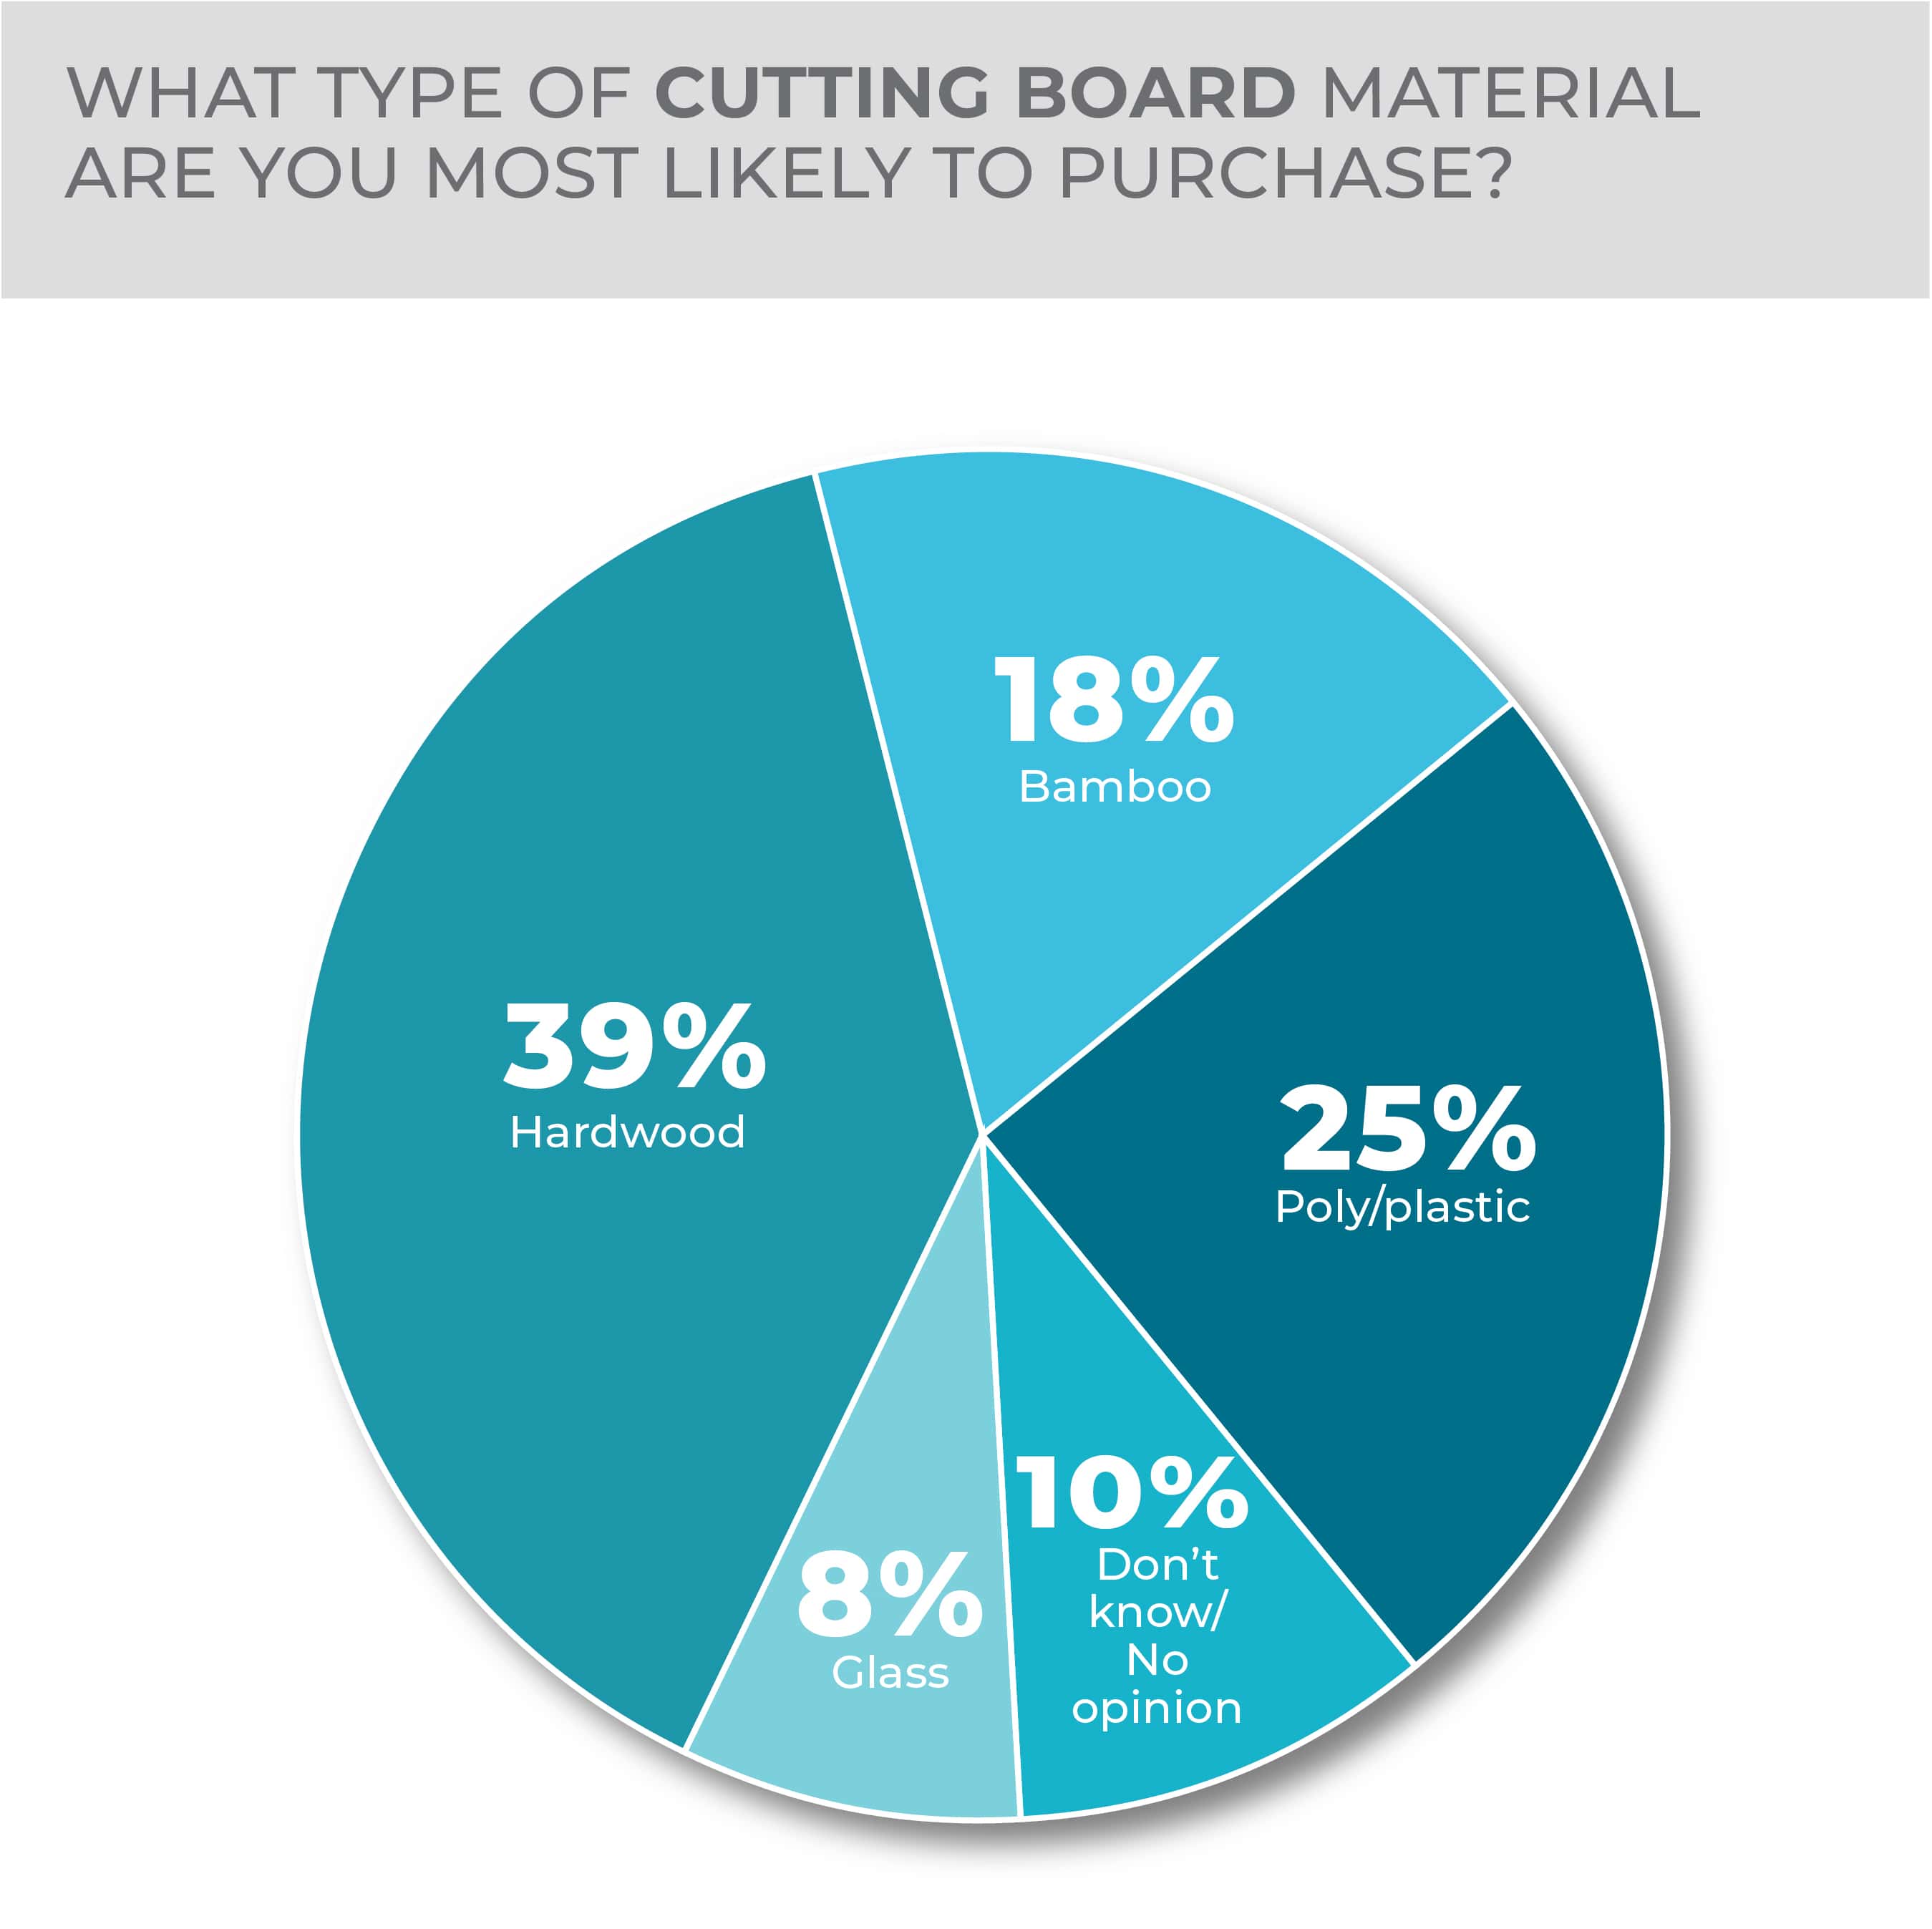
The hardwood cutting board segment (an overwhelming preference, selected by 39% of survey respondents) today features a wider assortment of wood types, such as acacia and teak, blending style, performance and in some cases the eco-friendly benefits of renewable sourcing.
Perceived food safety benefits and the relatively lower prices of poly boards, meanwhile, likely account for the solid preference by 25% of respondents. Bamboo cutting boards were selected as a preference by 18%, and glass boards were chosen by 8%.
In what could demonstrate less eco-friendly incentive among older consumers and more among younger consumers, Baby Boomers and Gen Xers reported significantly more interest in poly boards than Millennials and Gen Zers; and the younger-generation respondents revealed considerably more demand for bamboo boards than older generations.
More Cutlery Findings:
-
- Chef knives remain the top choice among prospective cutlery purchasers, with a wider variety of knives—carving knives, utility knives, bread knives and paring knives—coming in among the top selections.
- Despite the balanced demand across such specialty knives as open-stock options, the value of block sets remains strong in the category.
Dinnerware
Dinnerware, whose sales potential was recharged during the pandemic as more family meals became the norm, seems ripe again for new product and marketing as consumers rekindle their home entertaining activity and seek new wares showing off their evolving personal tastes.
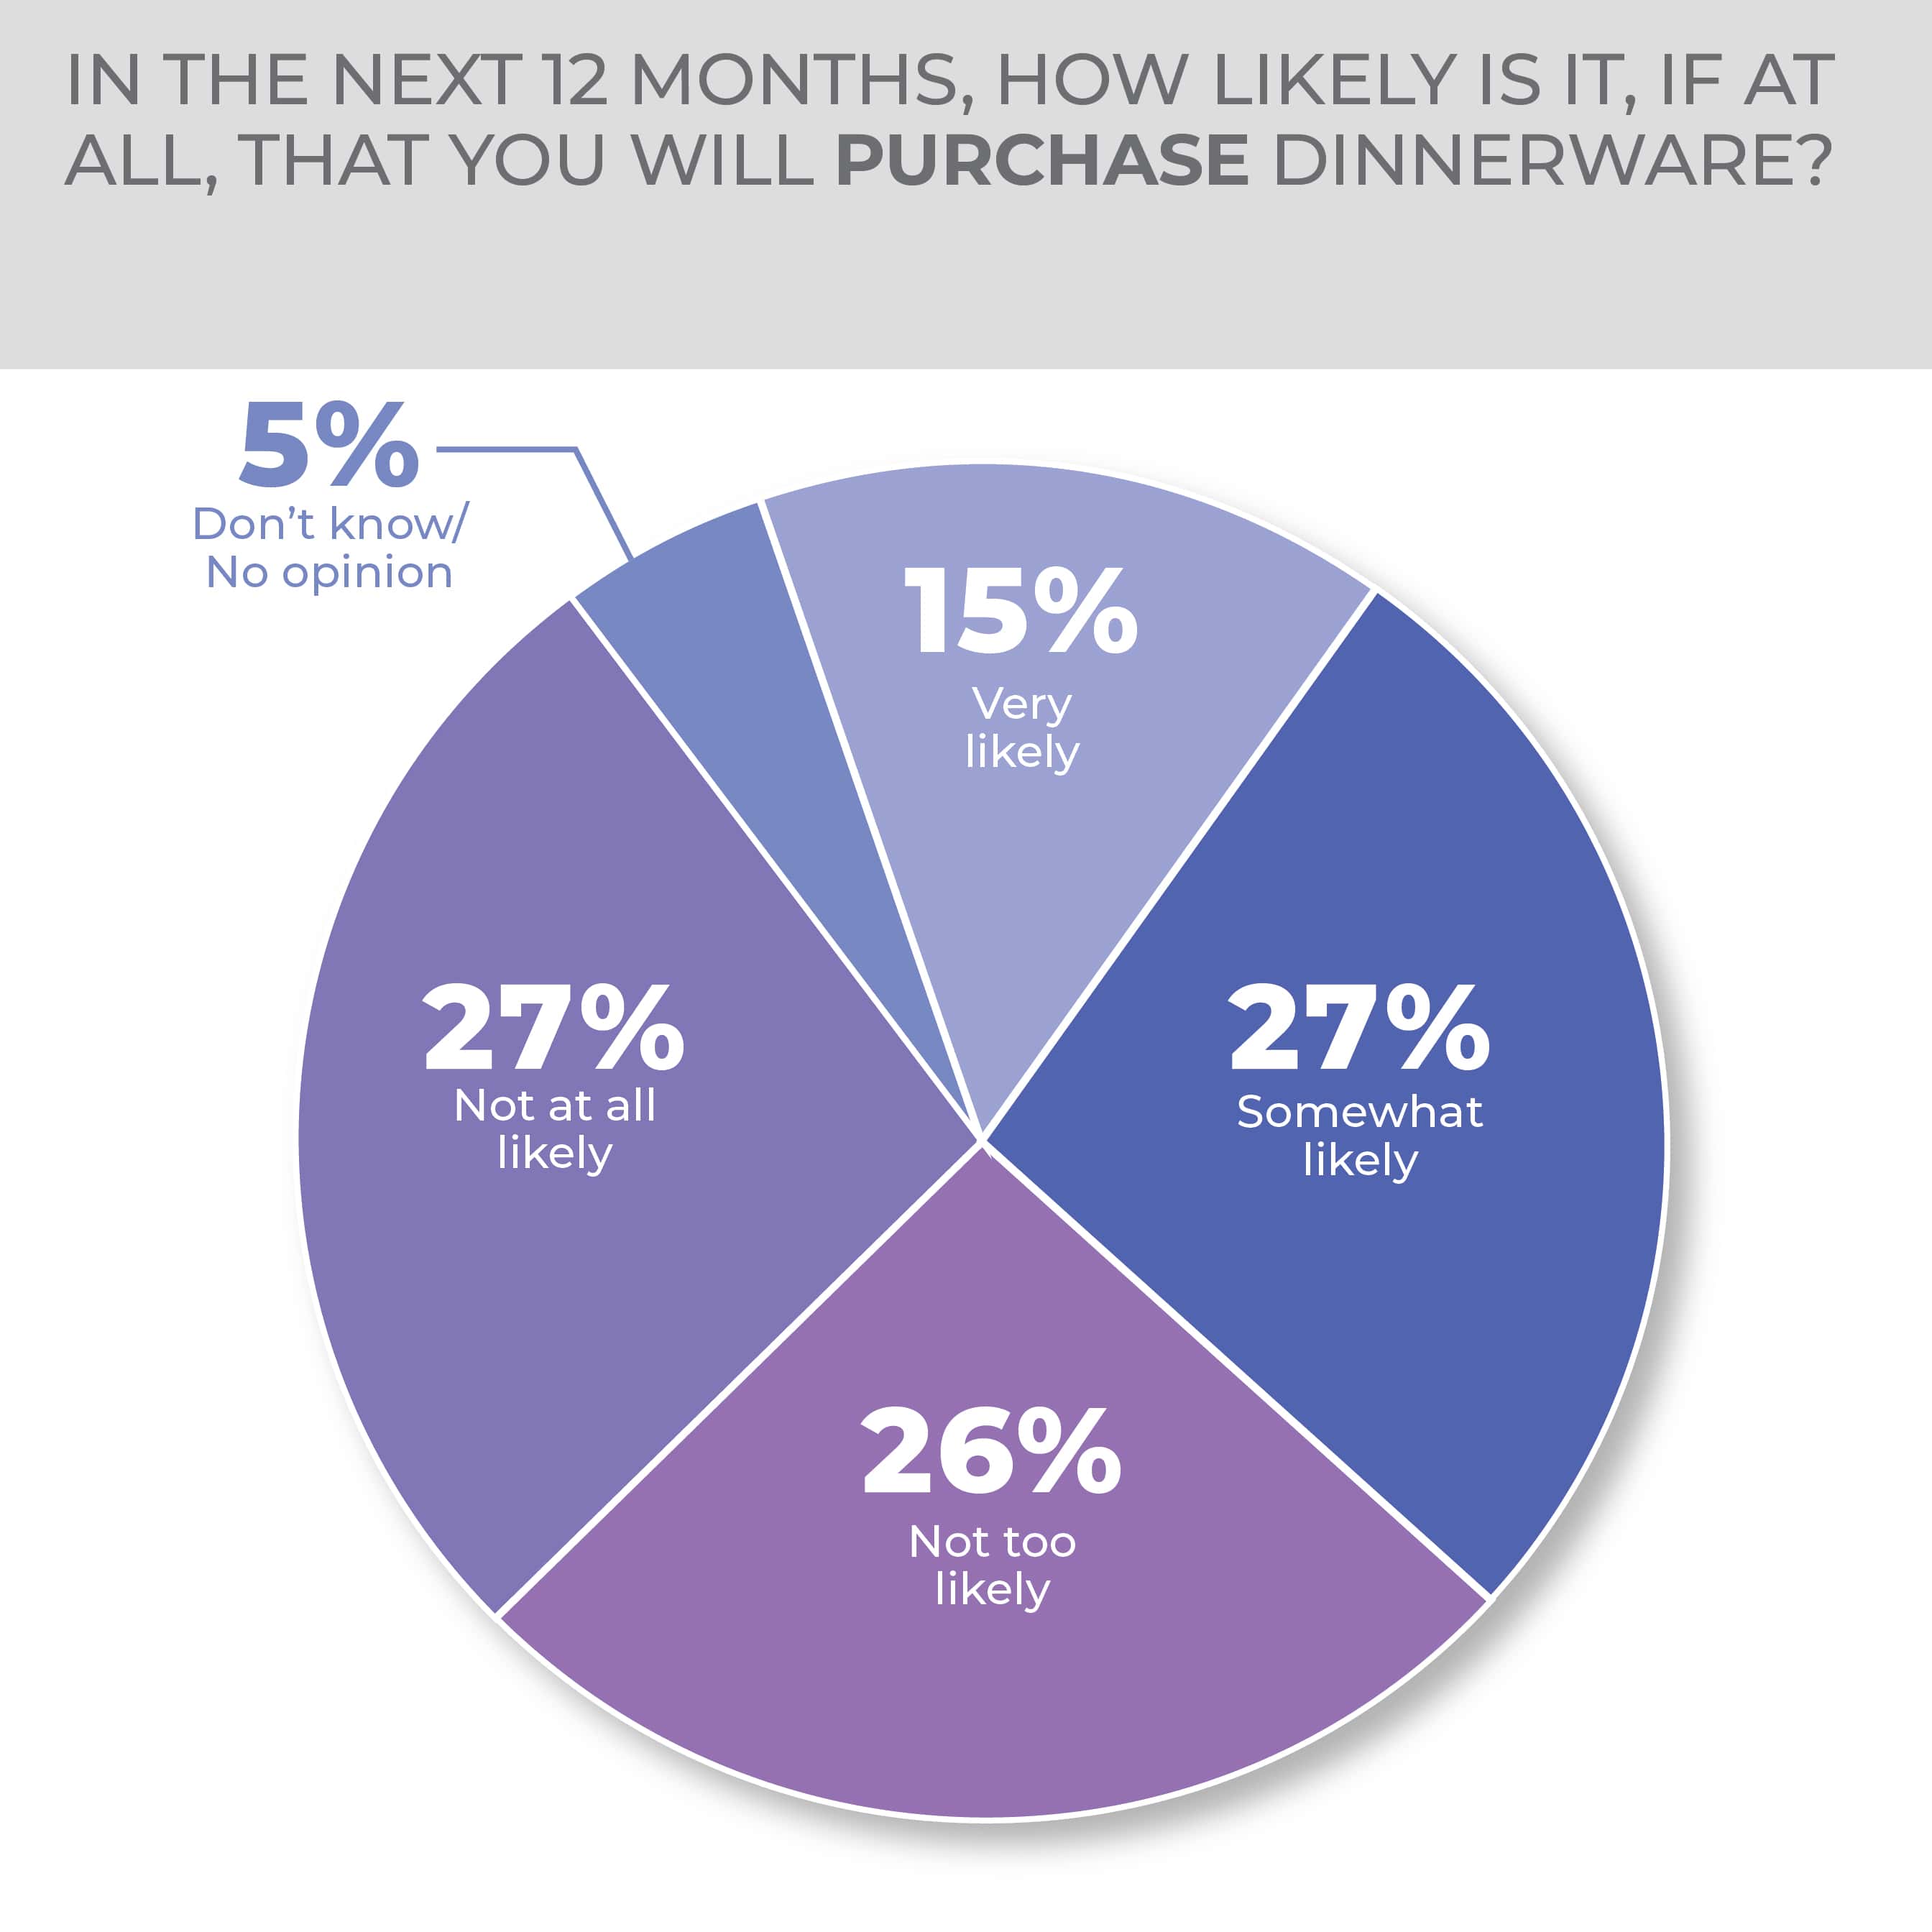
According to the results of the HomePage News 2023 Consumer Outlook Survey, dinnerware purchase intent for the next 12 months is slightly down from last year’s results. Only 15% of Outlook Survey respondents said they were very likely to make a purchase. Tied at 27% are somewhat likely and not at all likely.
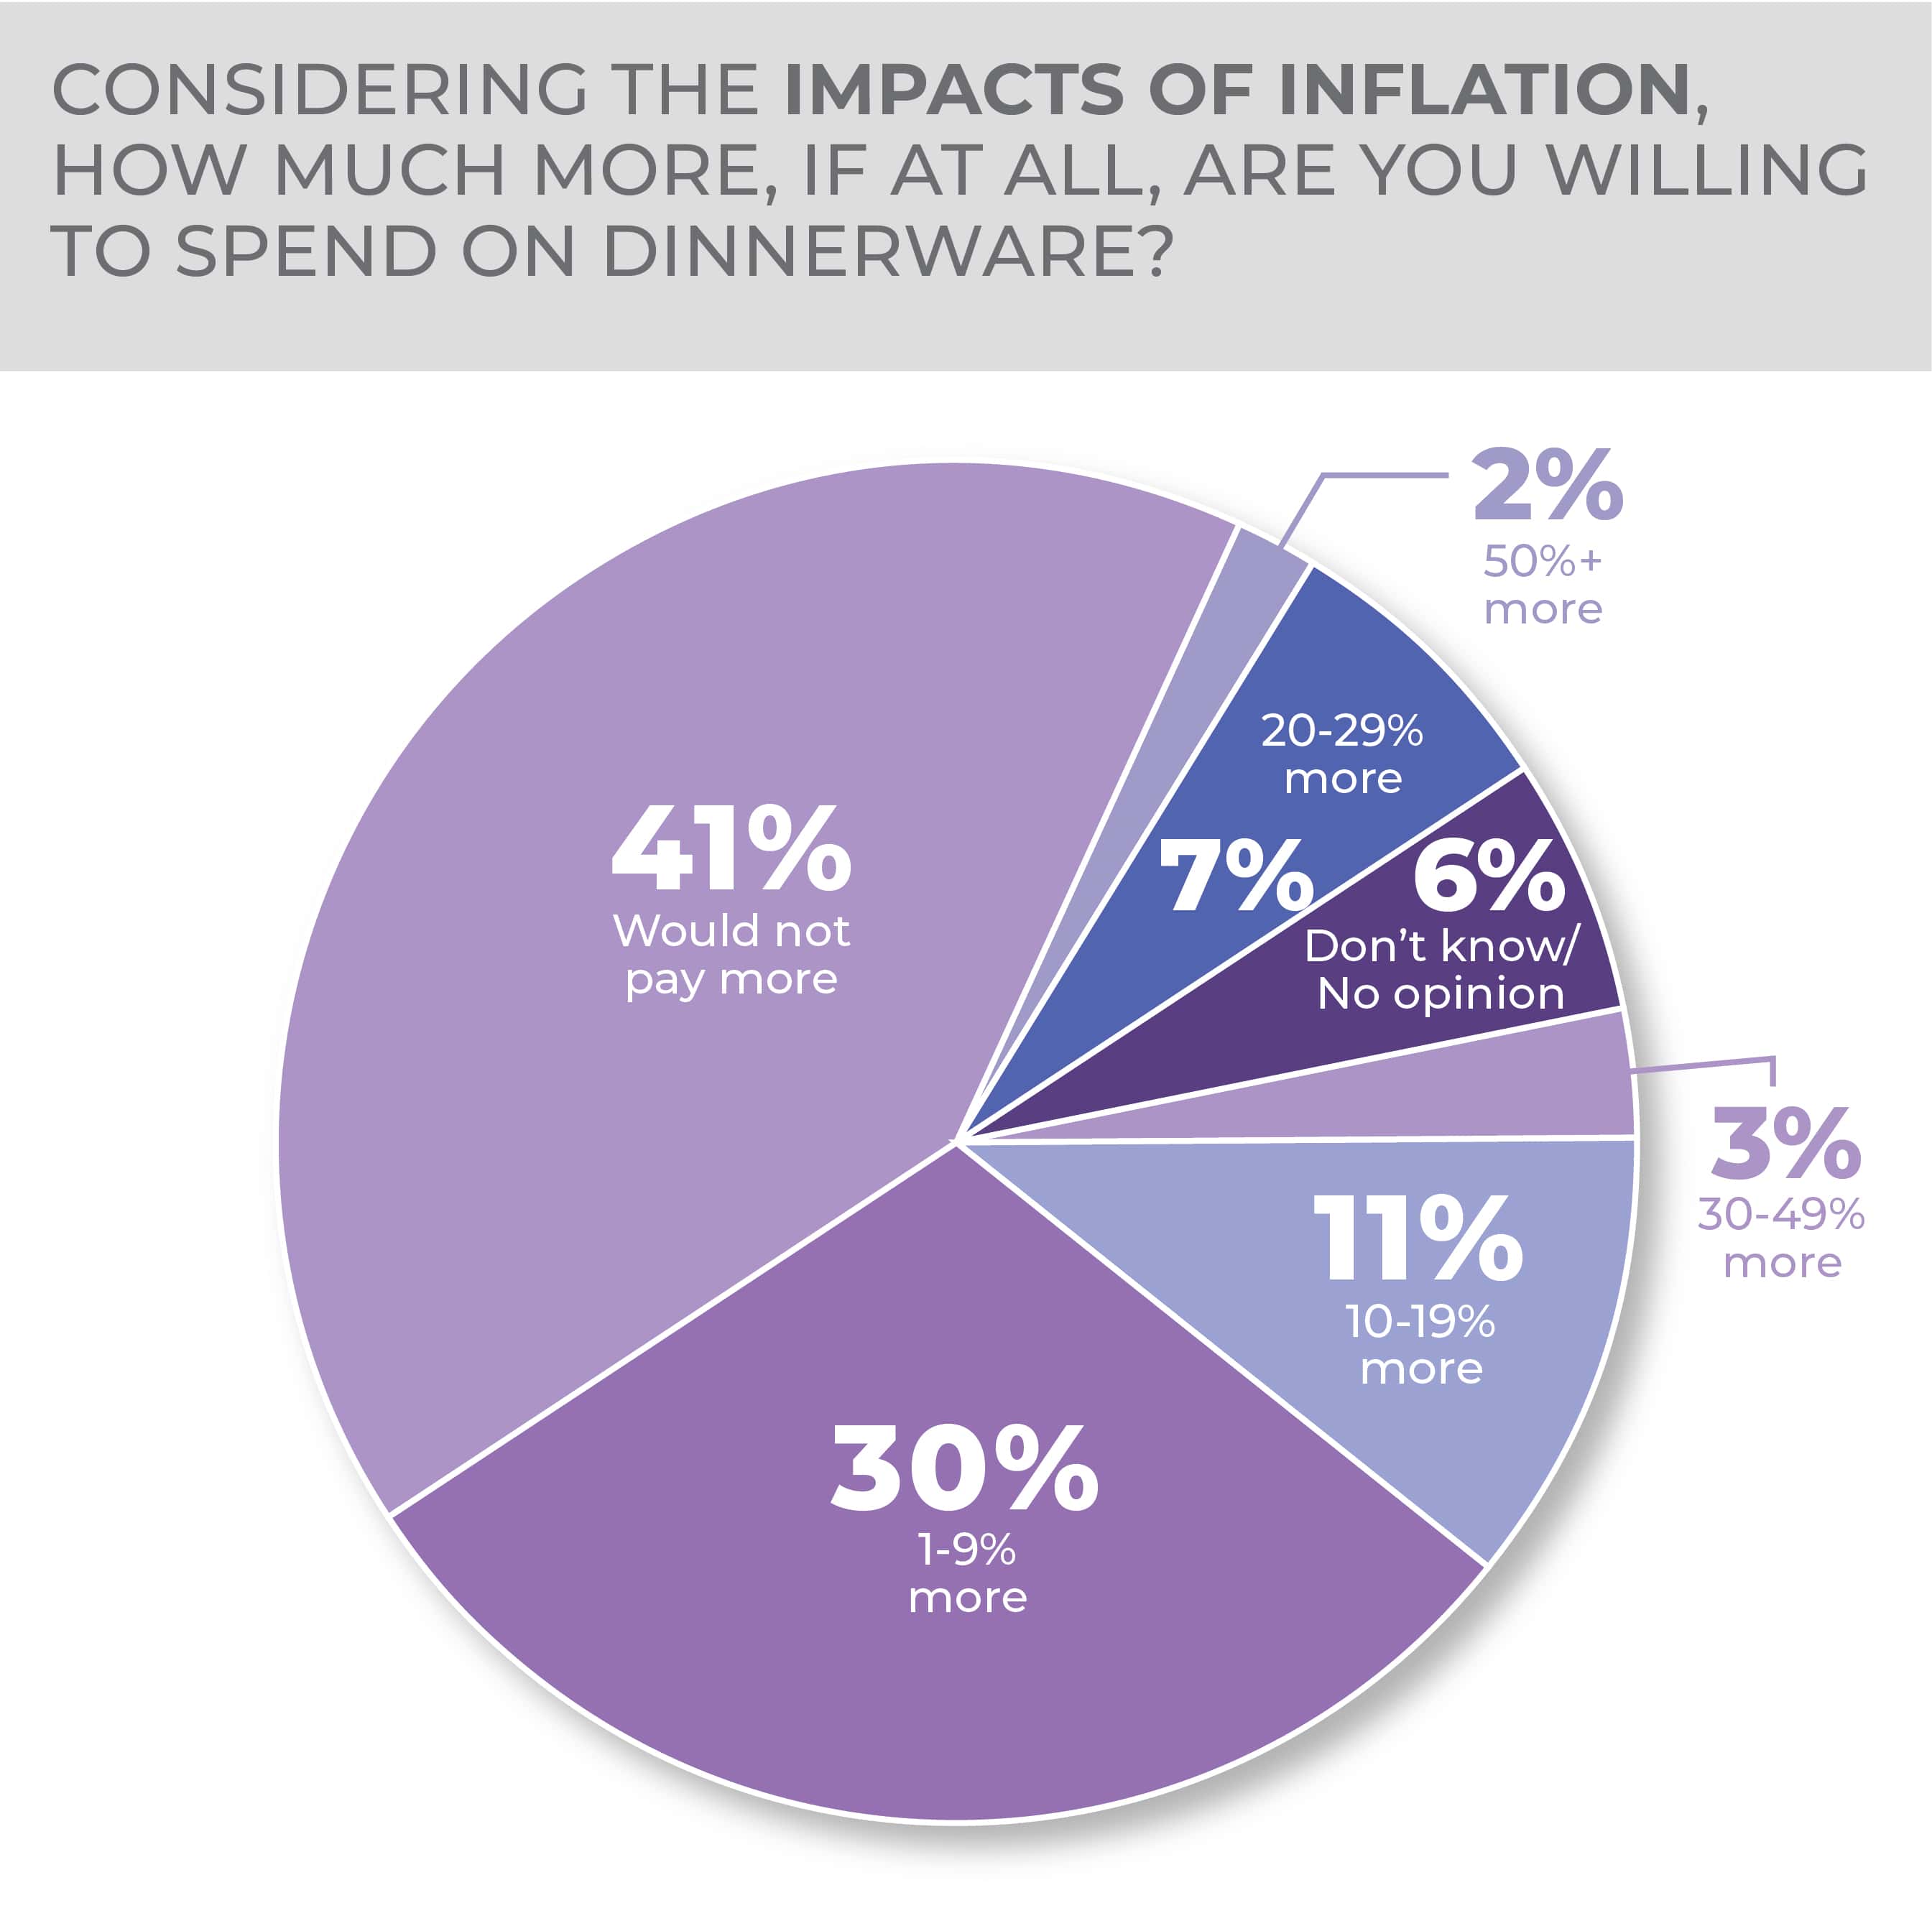
As is the case with many of the categories, most consumers are not willing to spend more on dinnerware despite inflation.
-
- If they were to purchase dinnerware, most consumers seem to be purchasing out of necessity, to replace a broken or old product.
- Almost half of survey respondents prefer to purchase dinnerware in a packaged set.
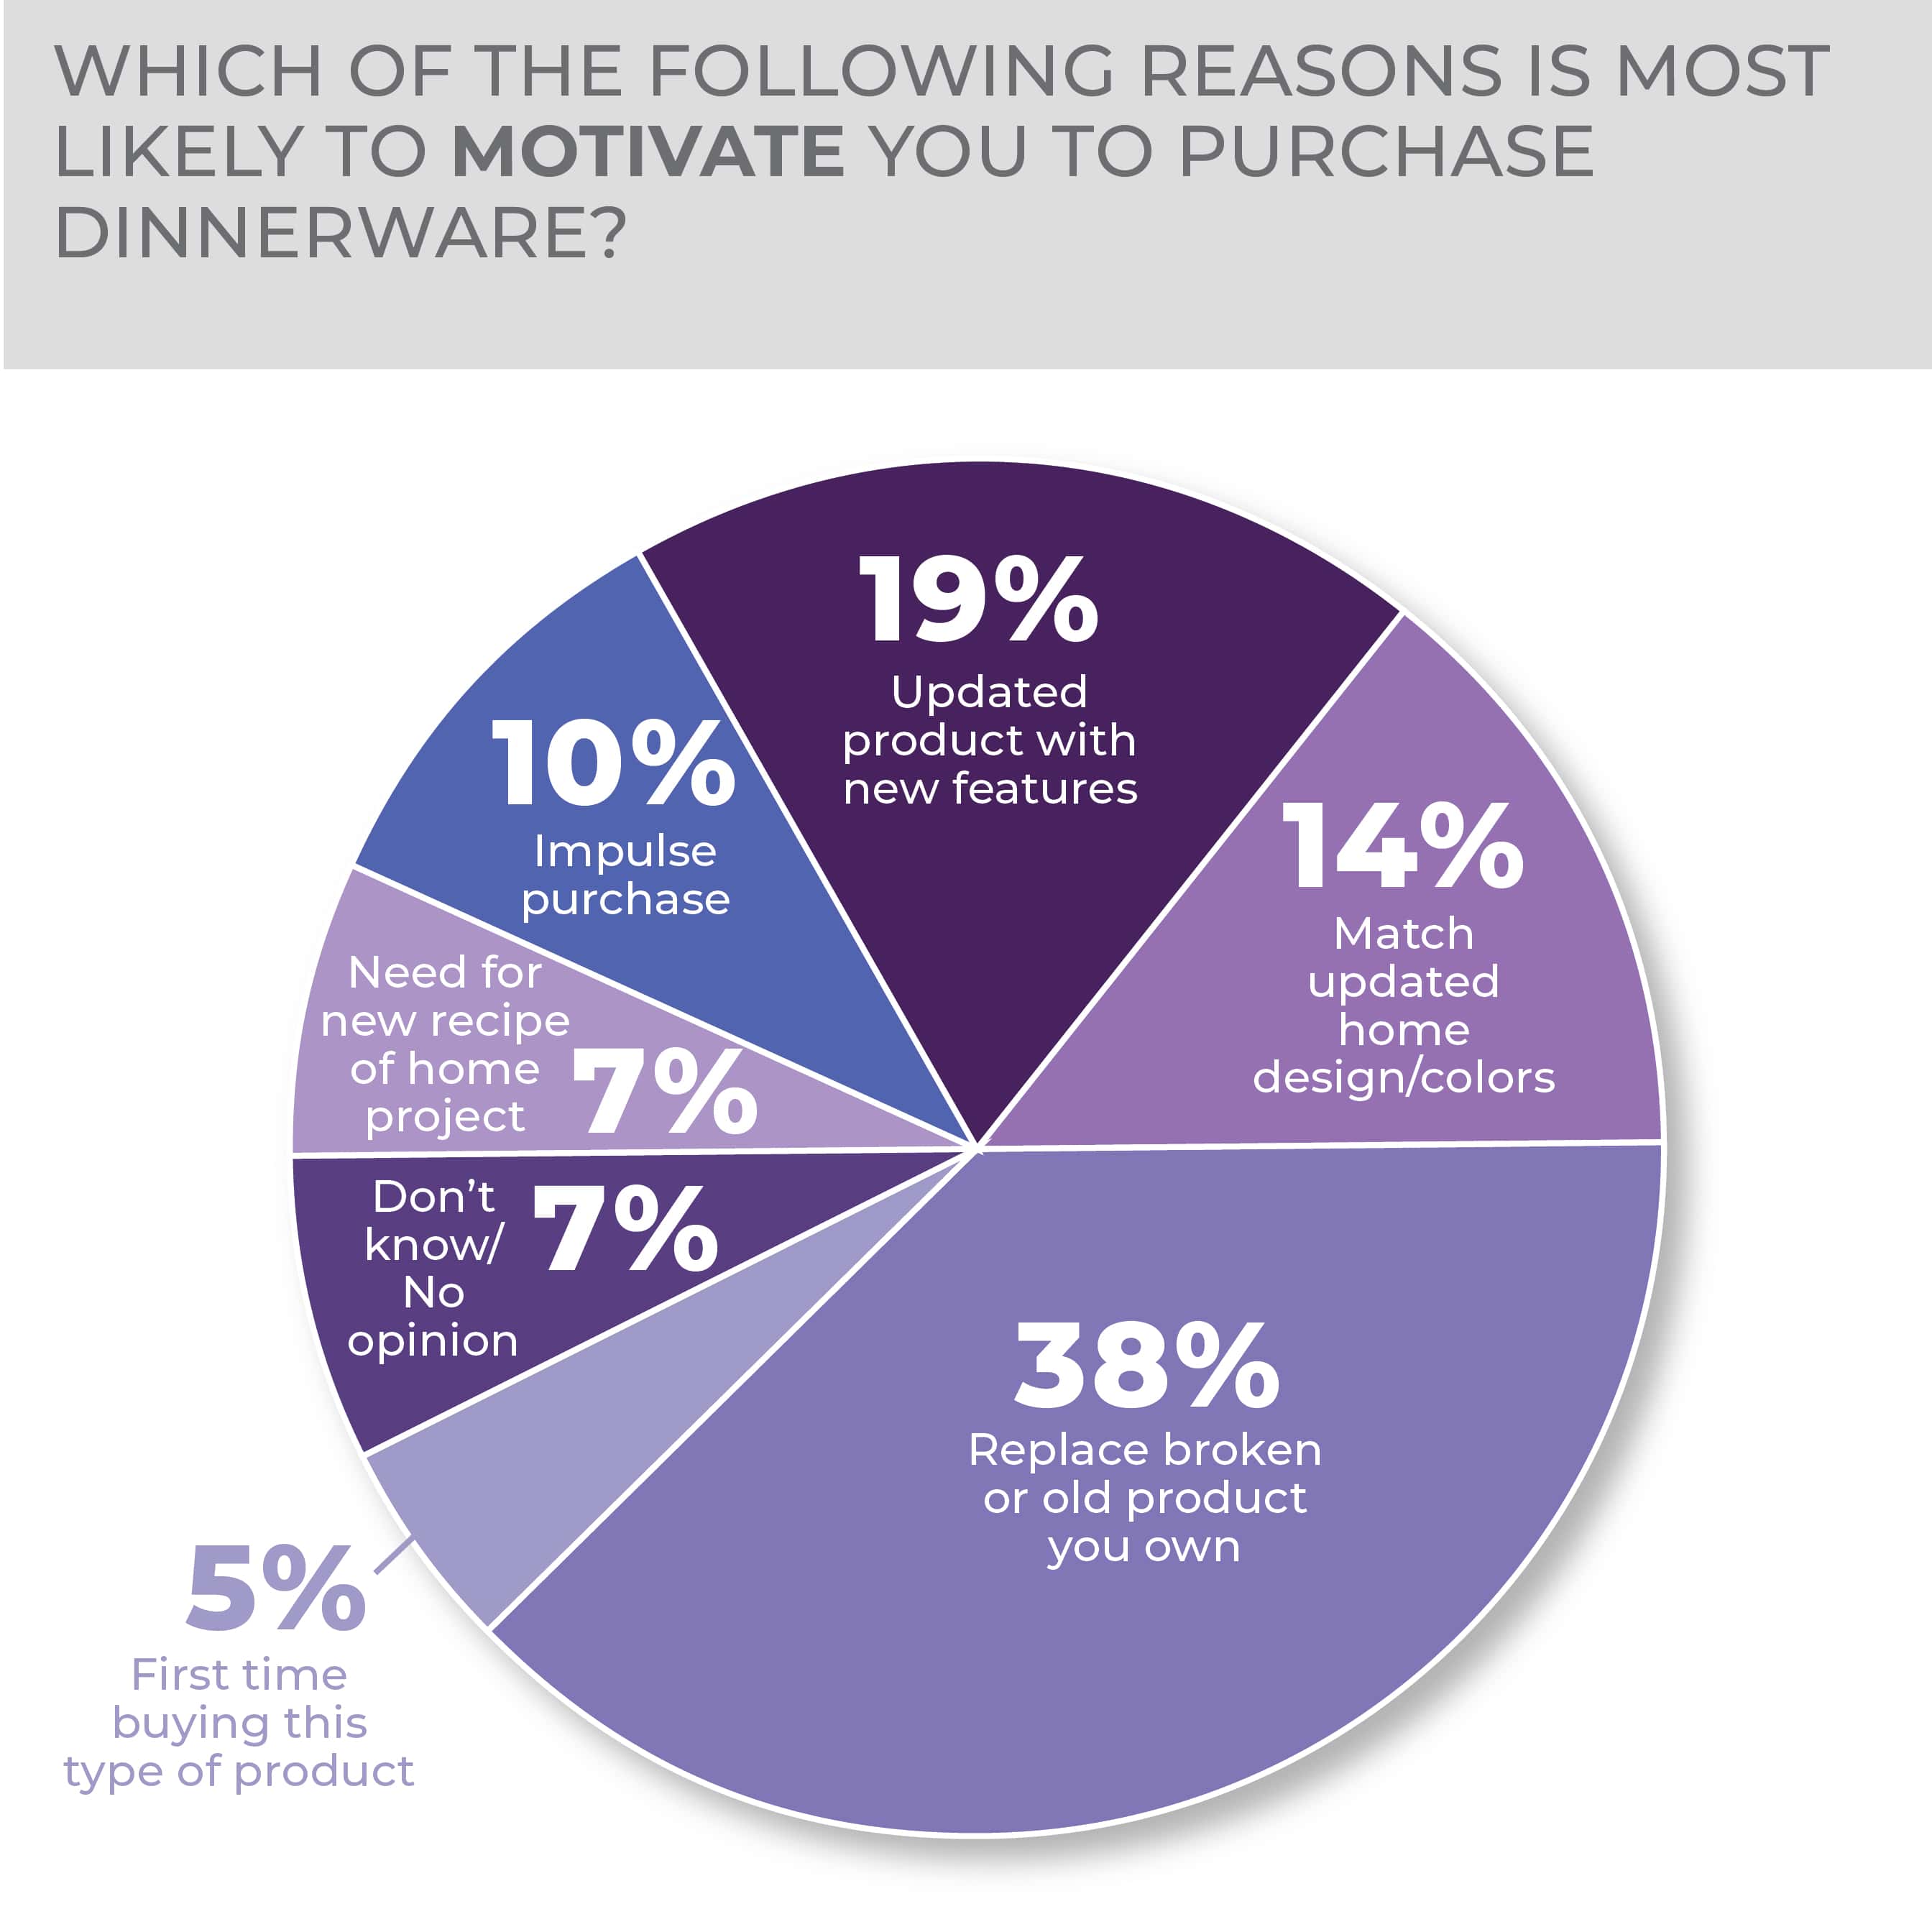
If they were to purchase dinnerware, most consumers seem to be purchasing out of necessity, as 38% said they would purchase to replace a broken or old product. The next two highest answers were to purchase an updated product with new features and to match an updated home design/colors.
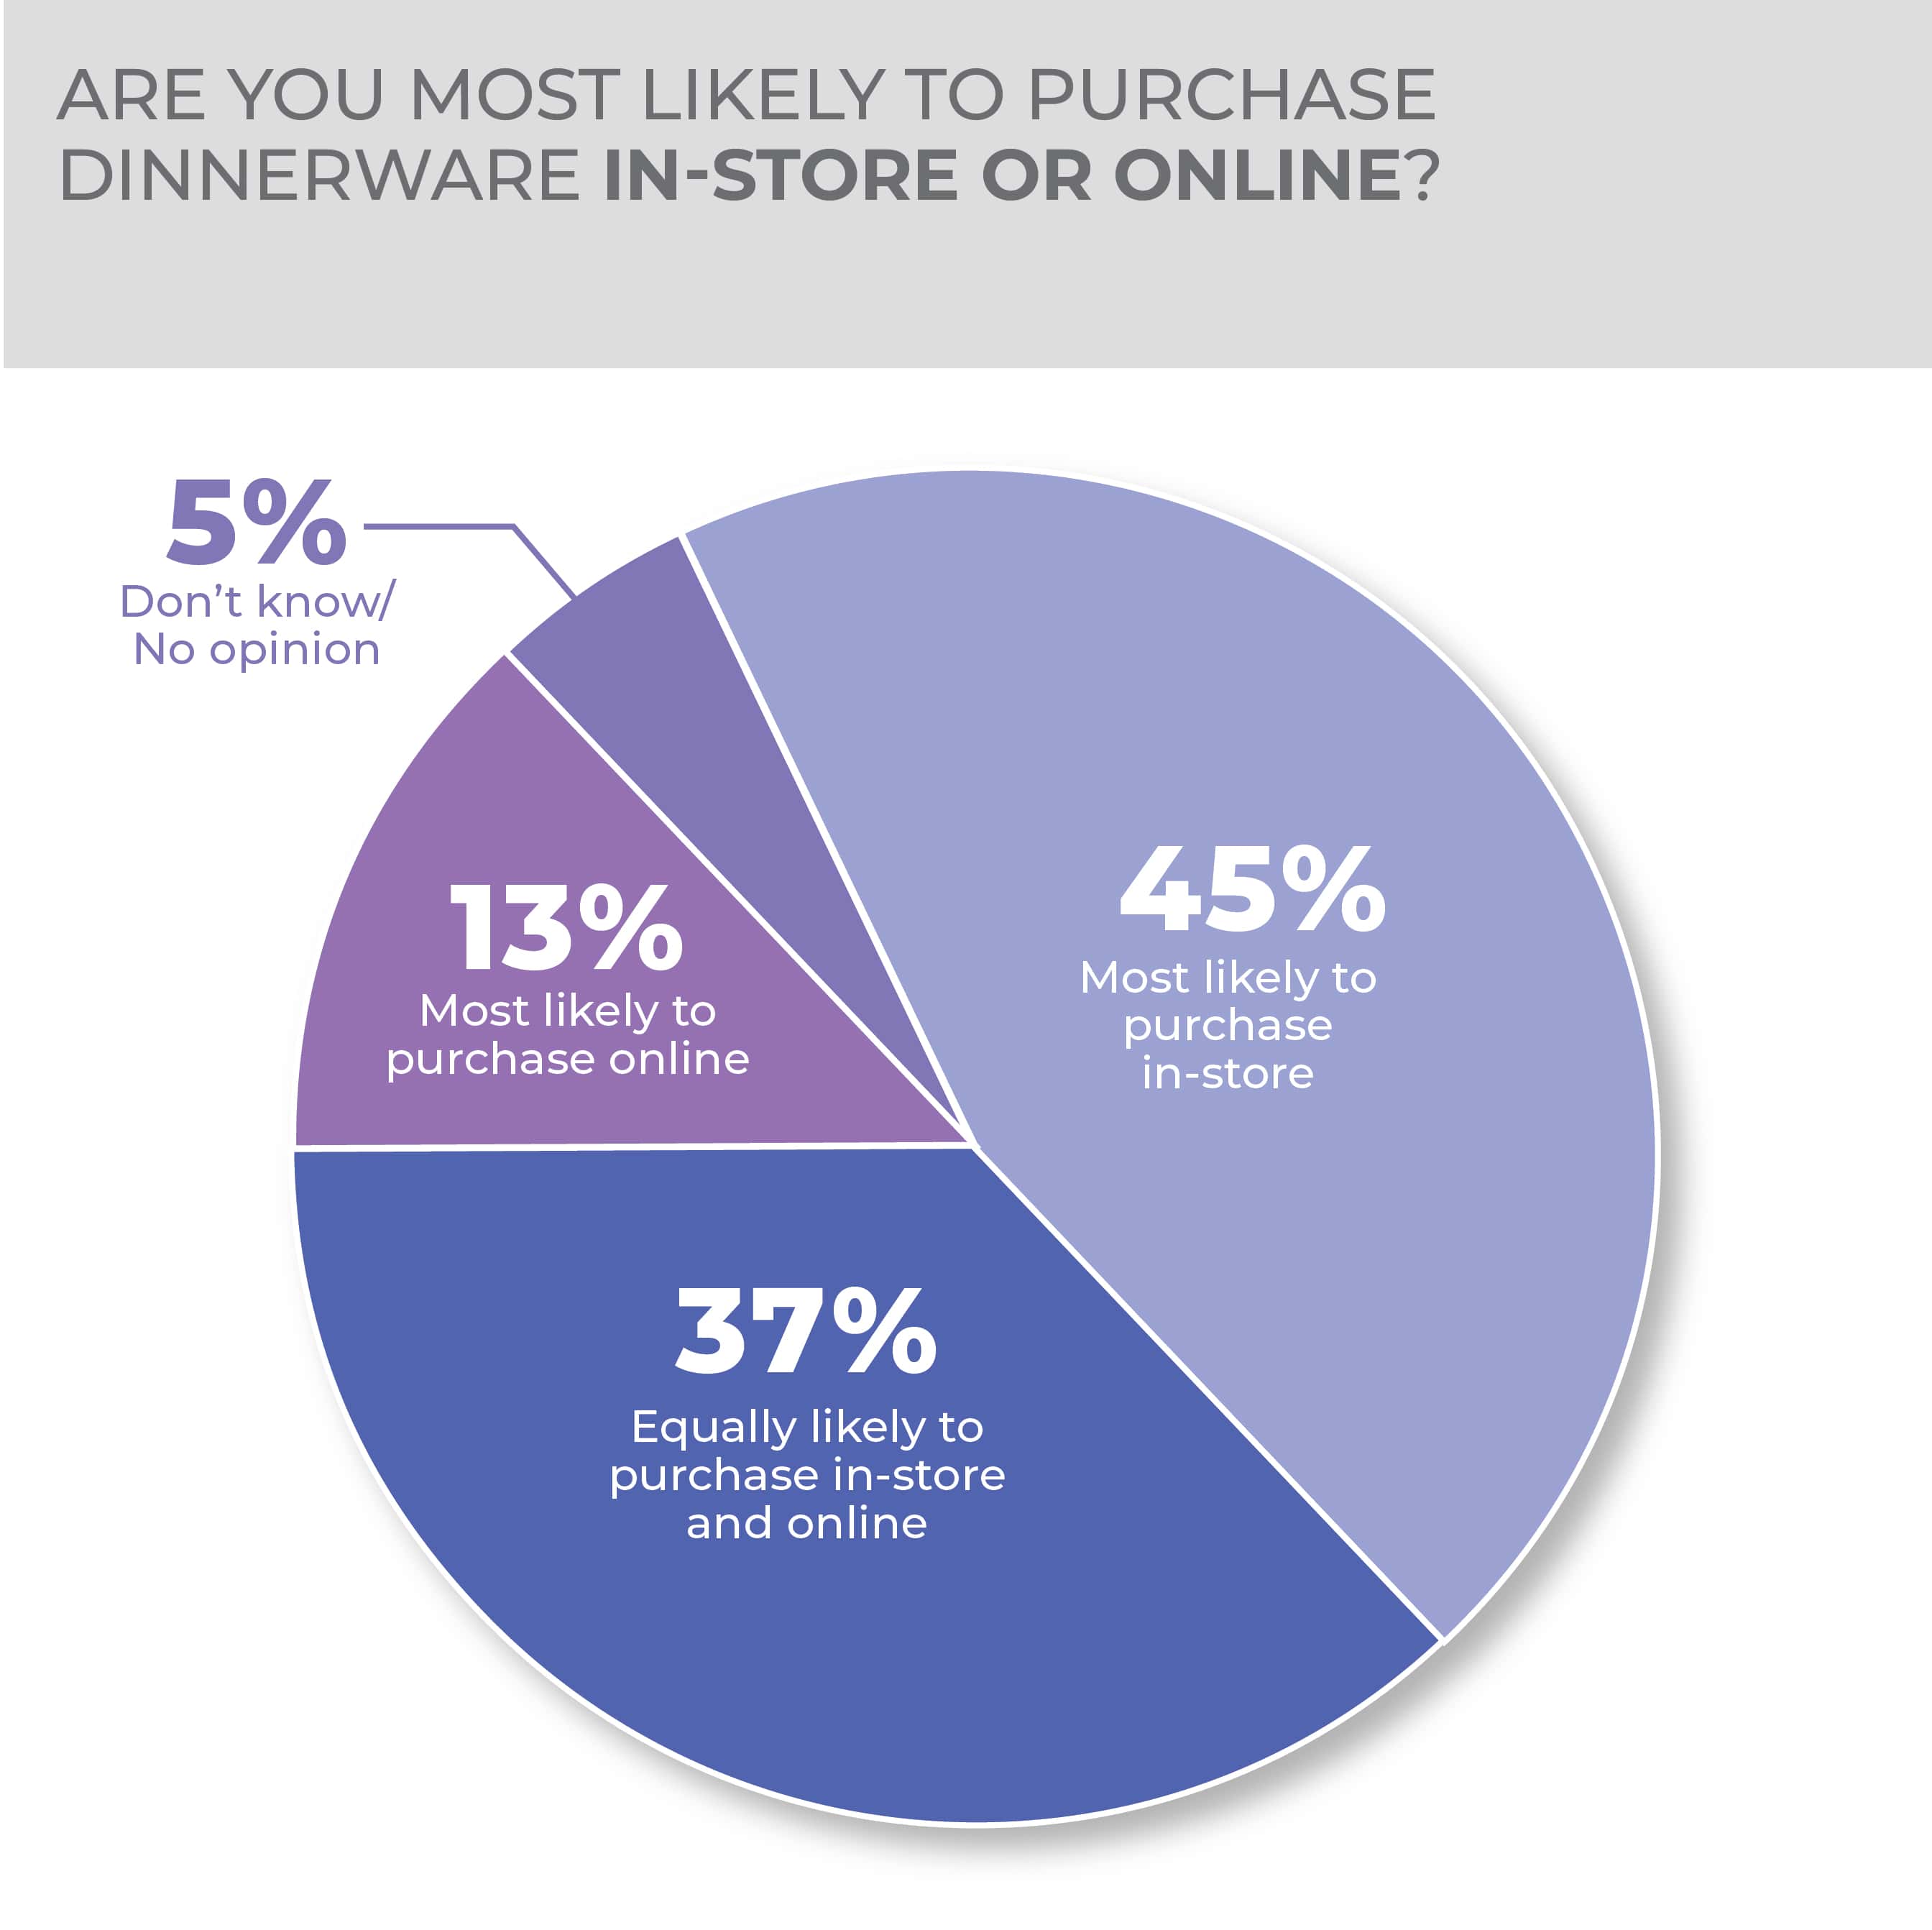
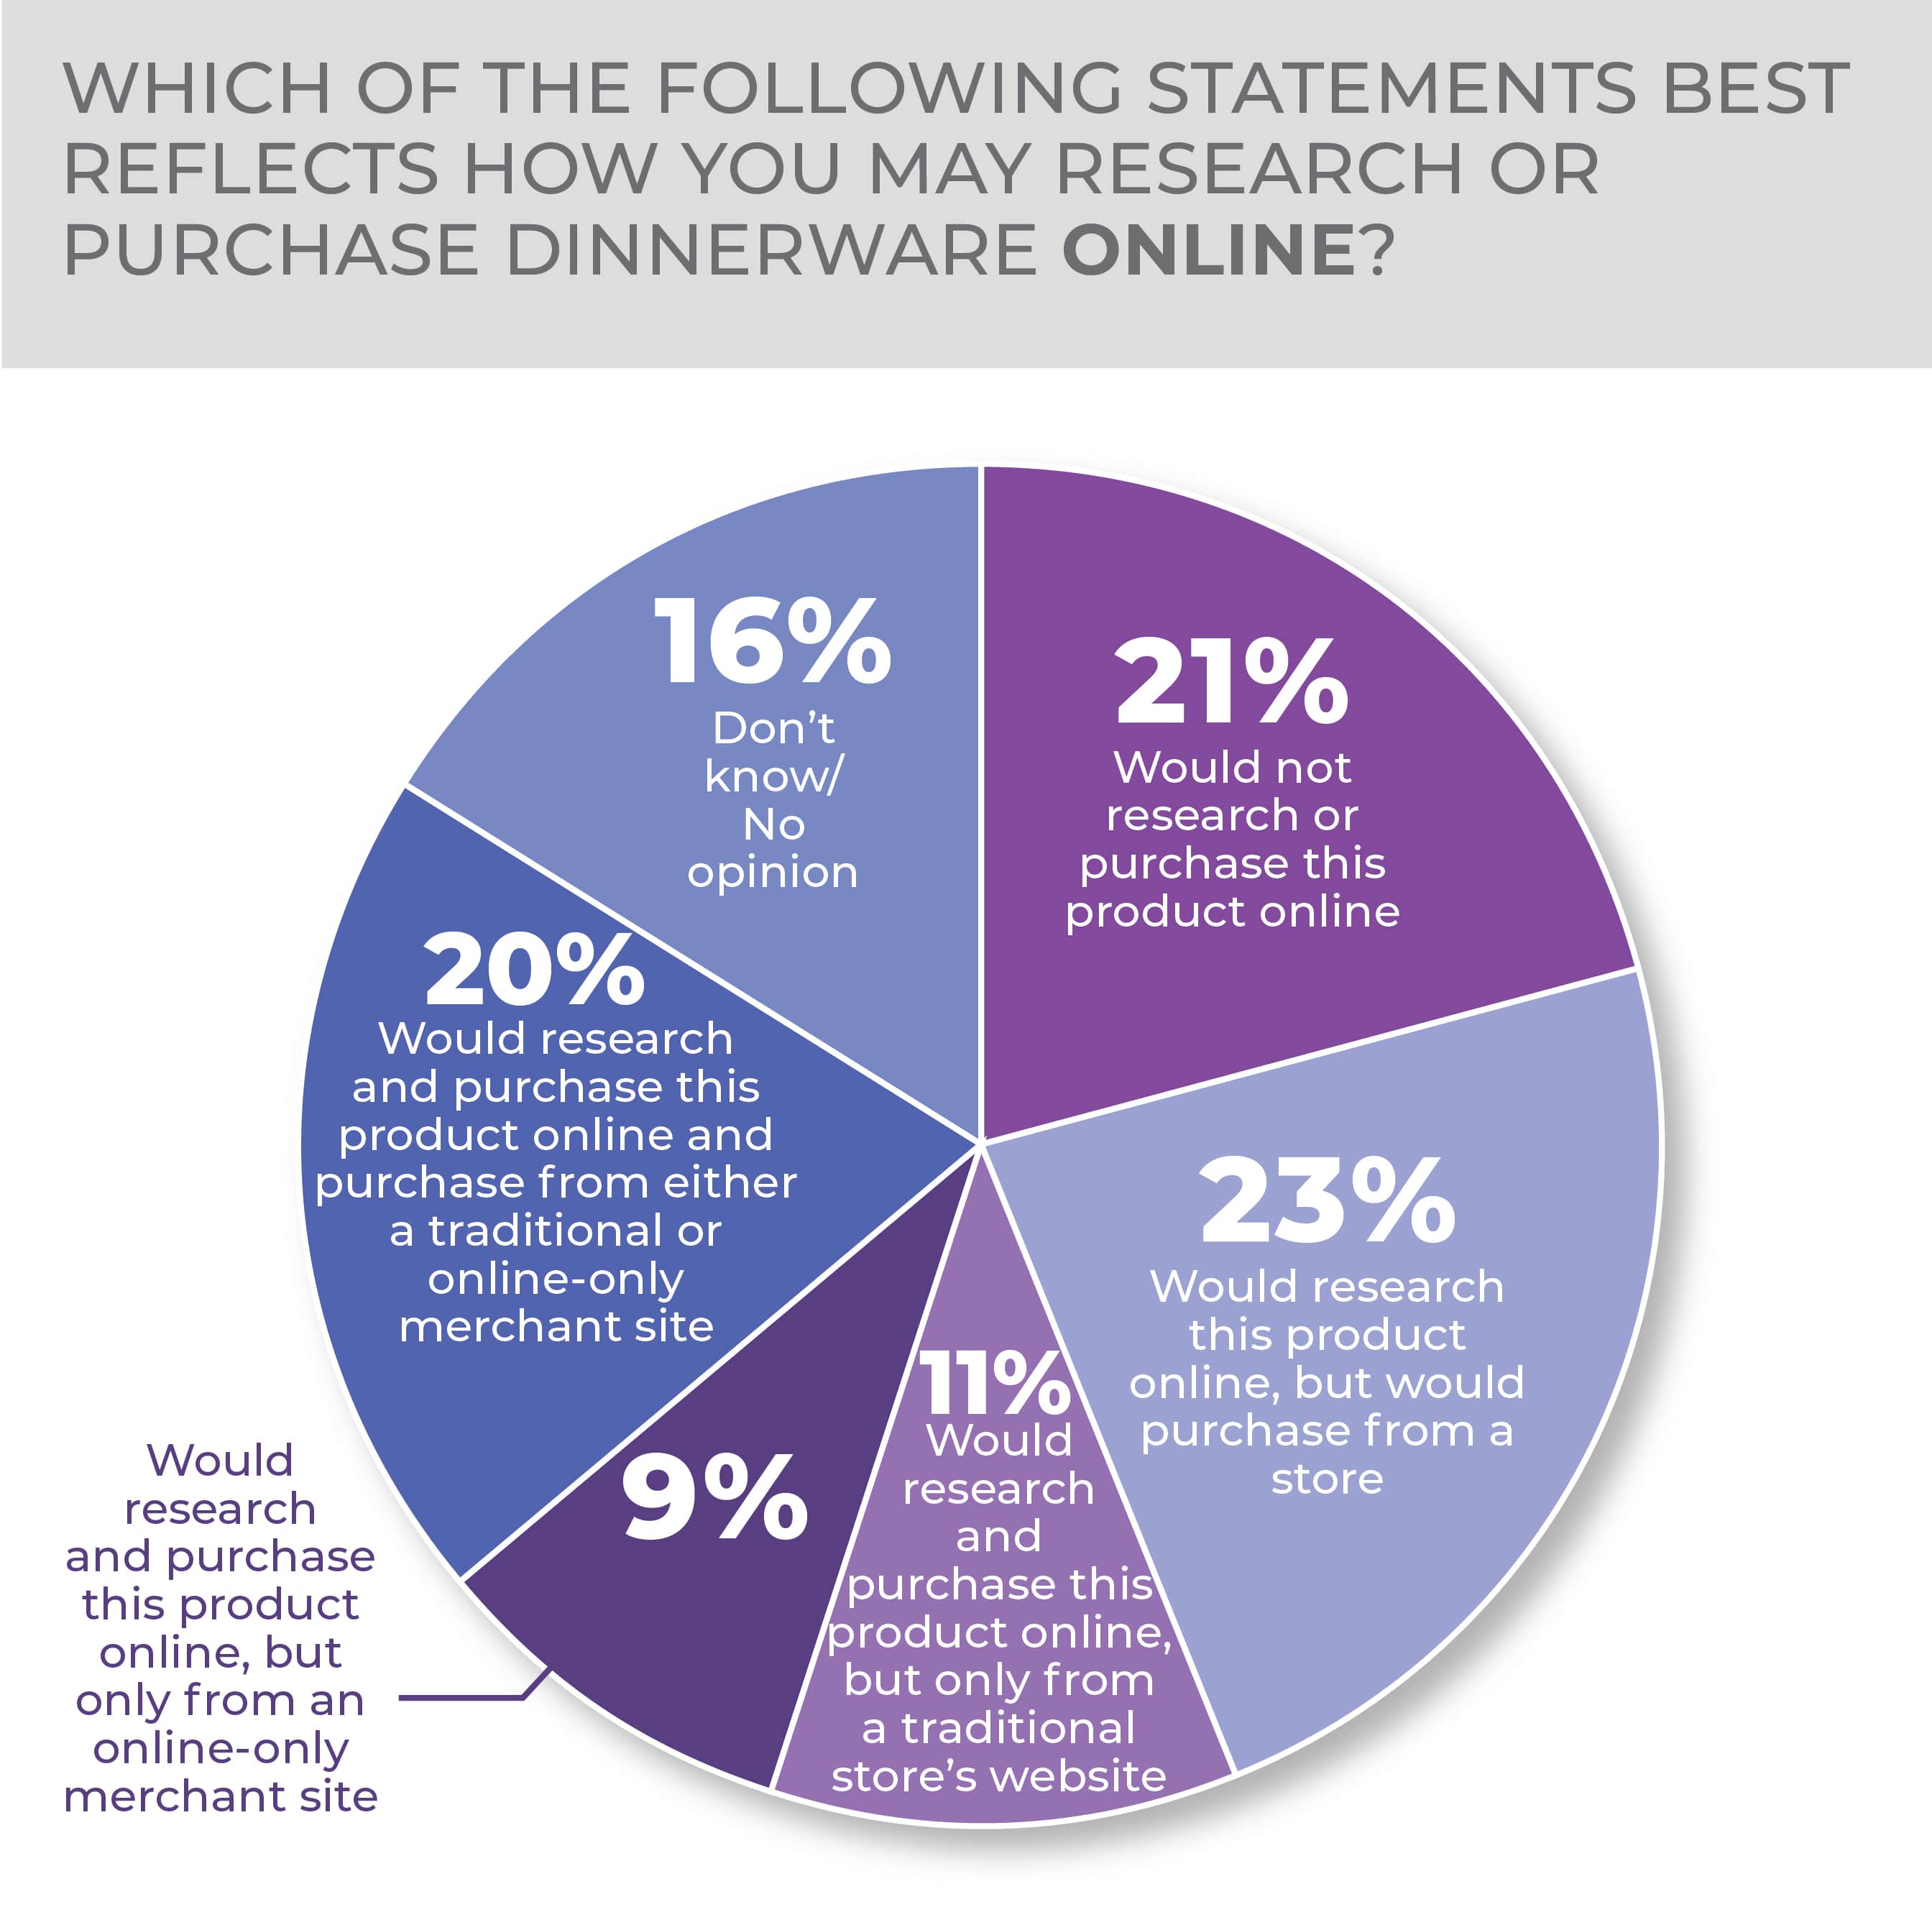
Nearly half of consumers are most likely to purchase dinnerware in-store, at 45%, but a good number of respondents are equally likely to purchase in-store and online at 37%. Results were split on how the respondents researched or purchased dinnerware online. The highest answer, at 23%, is researching dinnerware online but purchasing from a store, followed by not researching or purchasing dinnerware online at 21%.
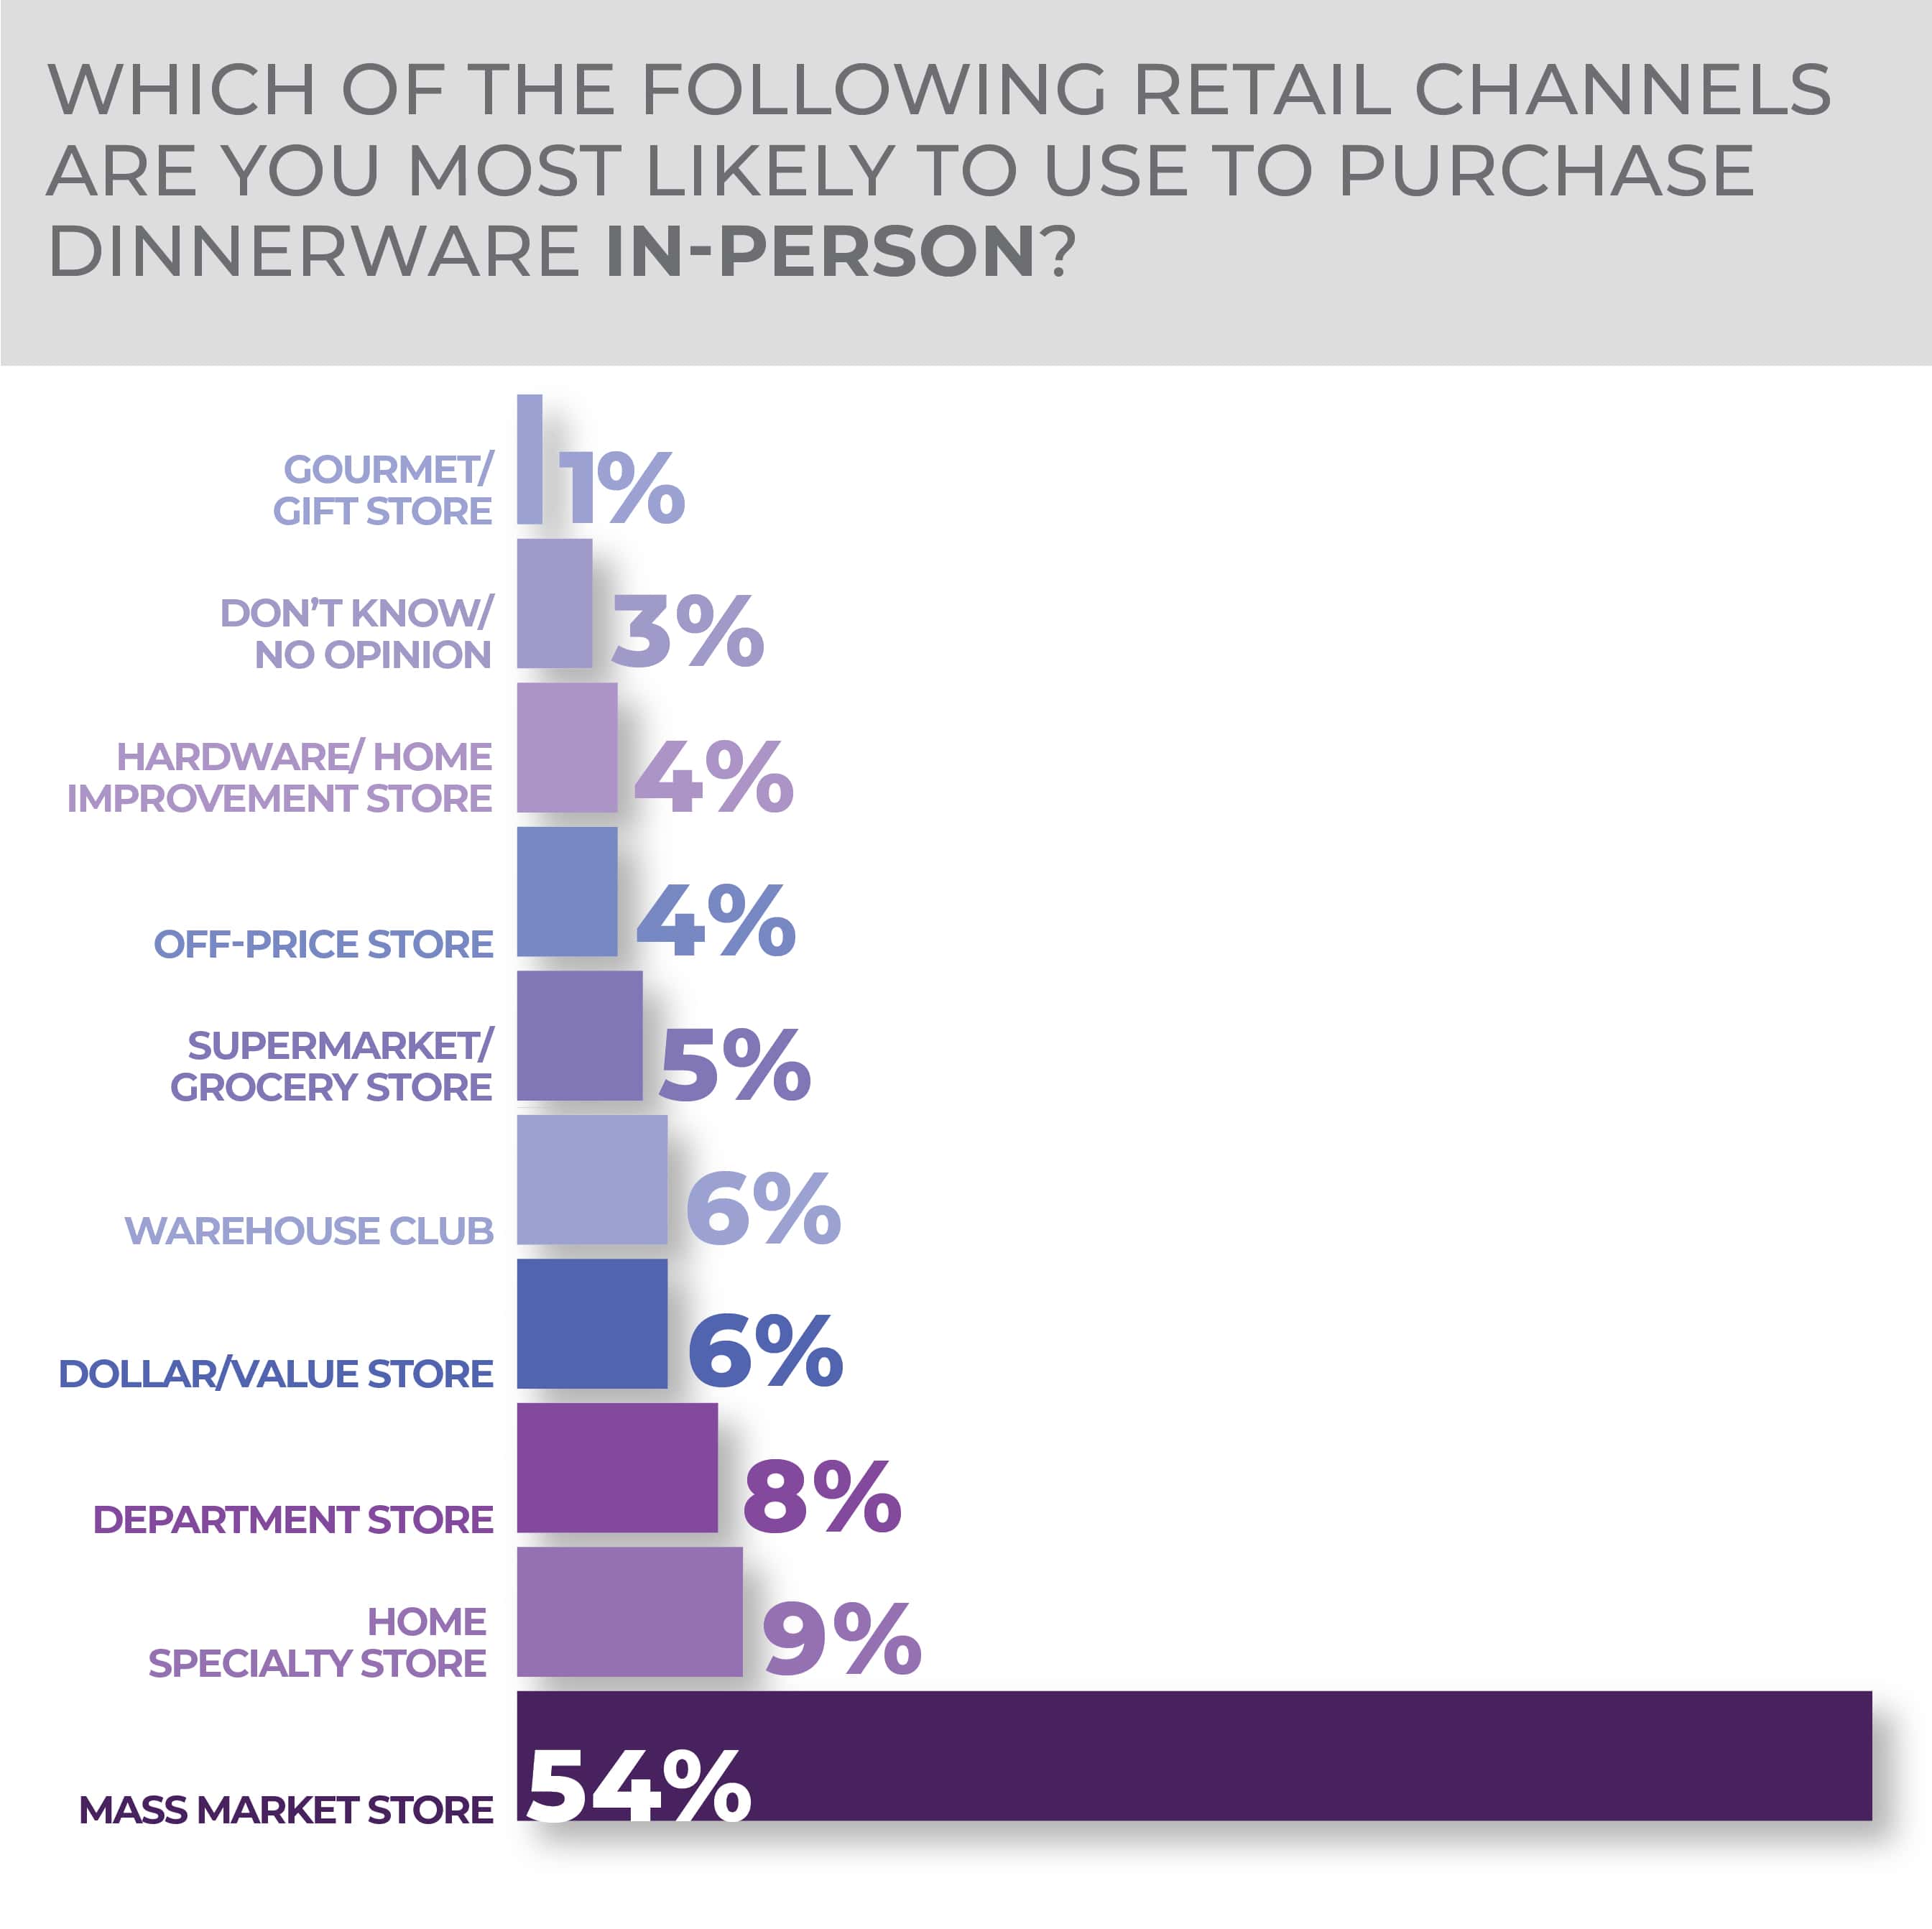
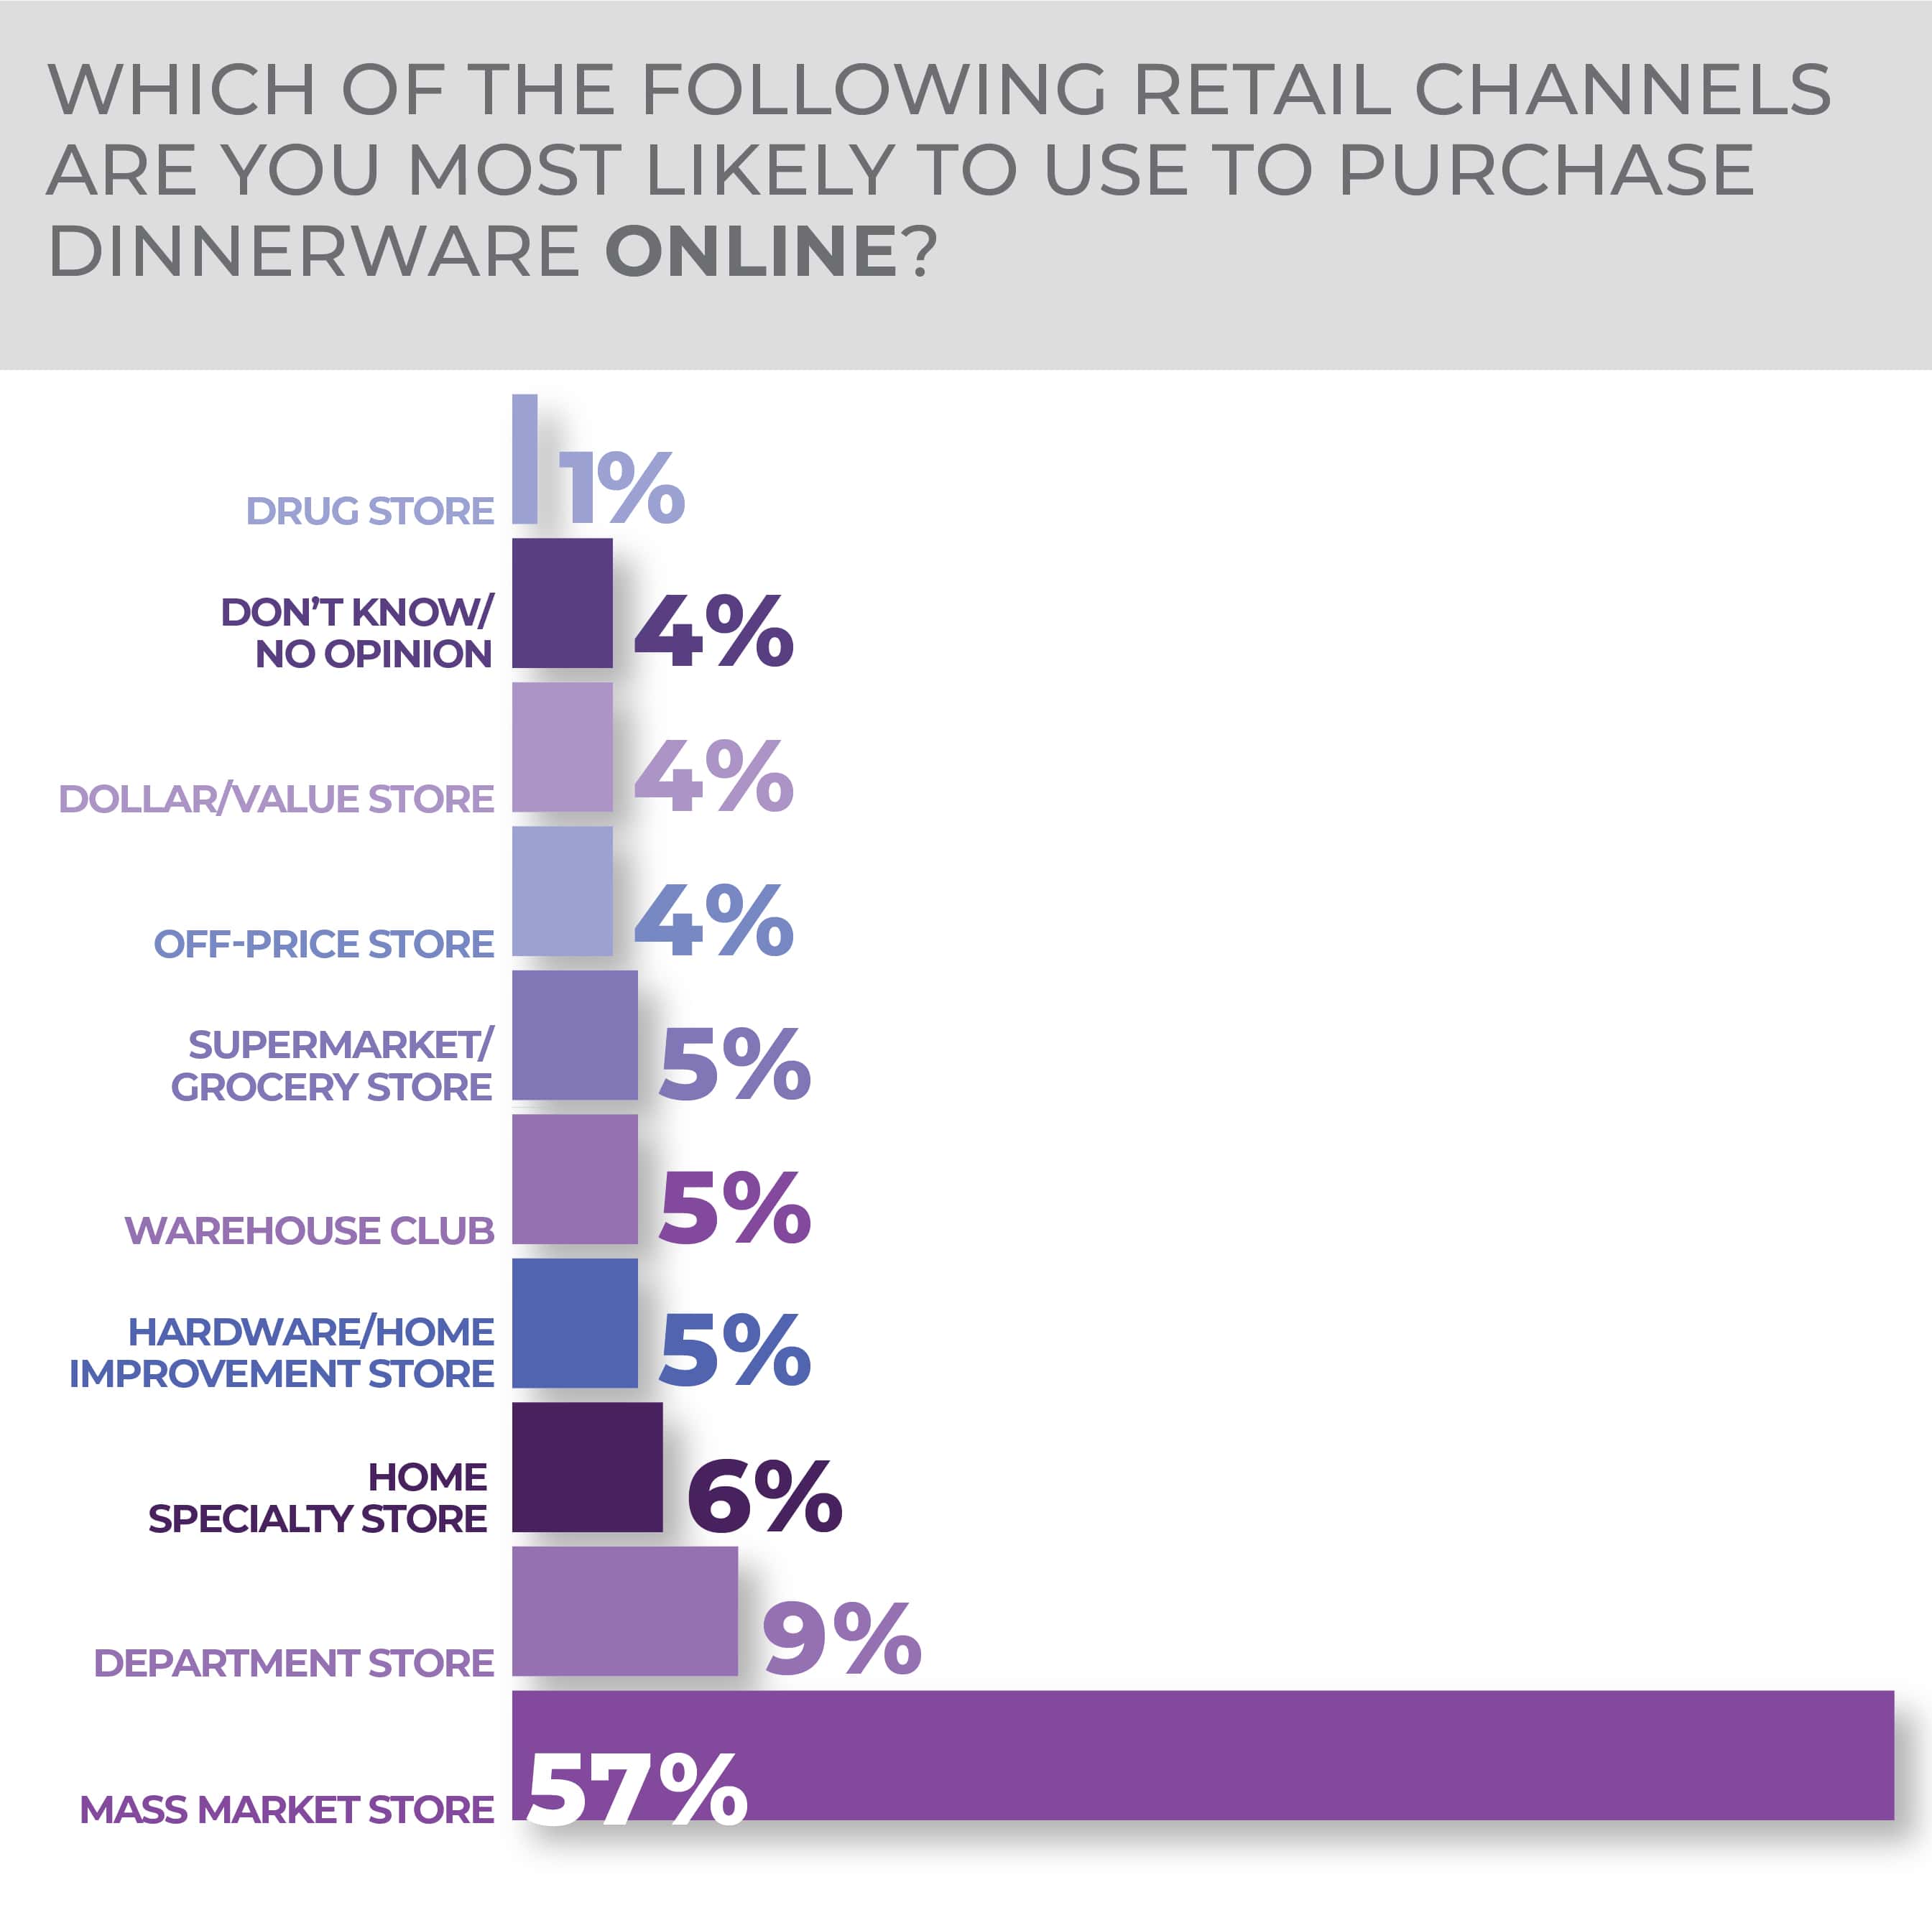
A mass market store proved to be the most likely retail channel to buy dinnerware in-person and online. More than half of the respondents chose a mass market store with all other options coming in under 10%.
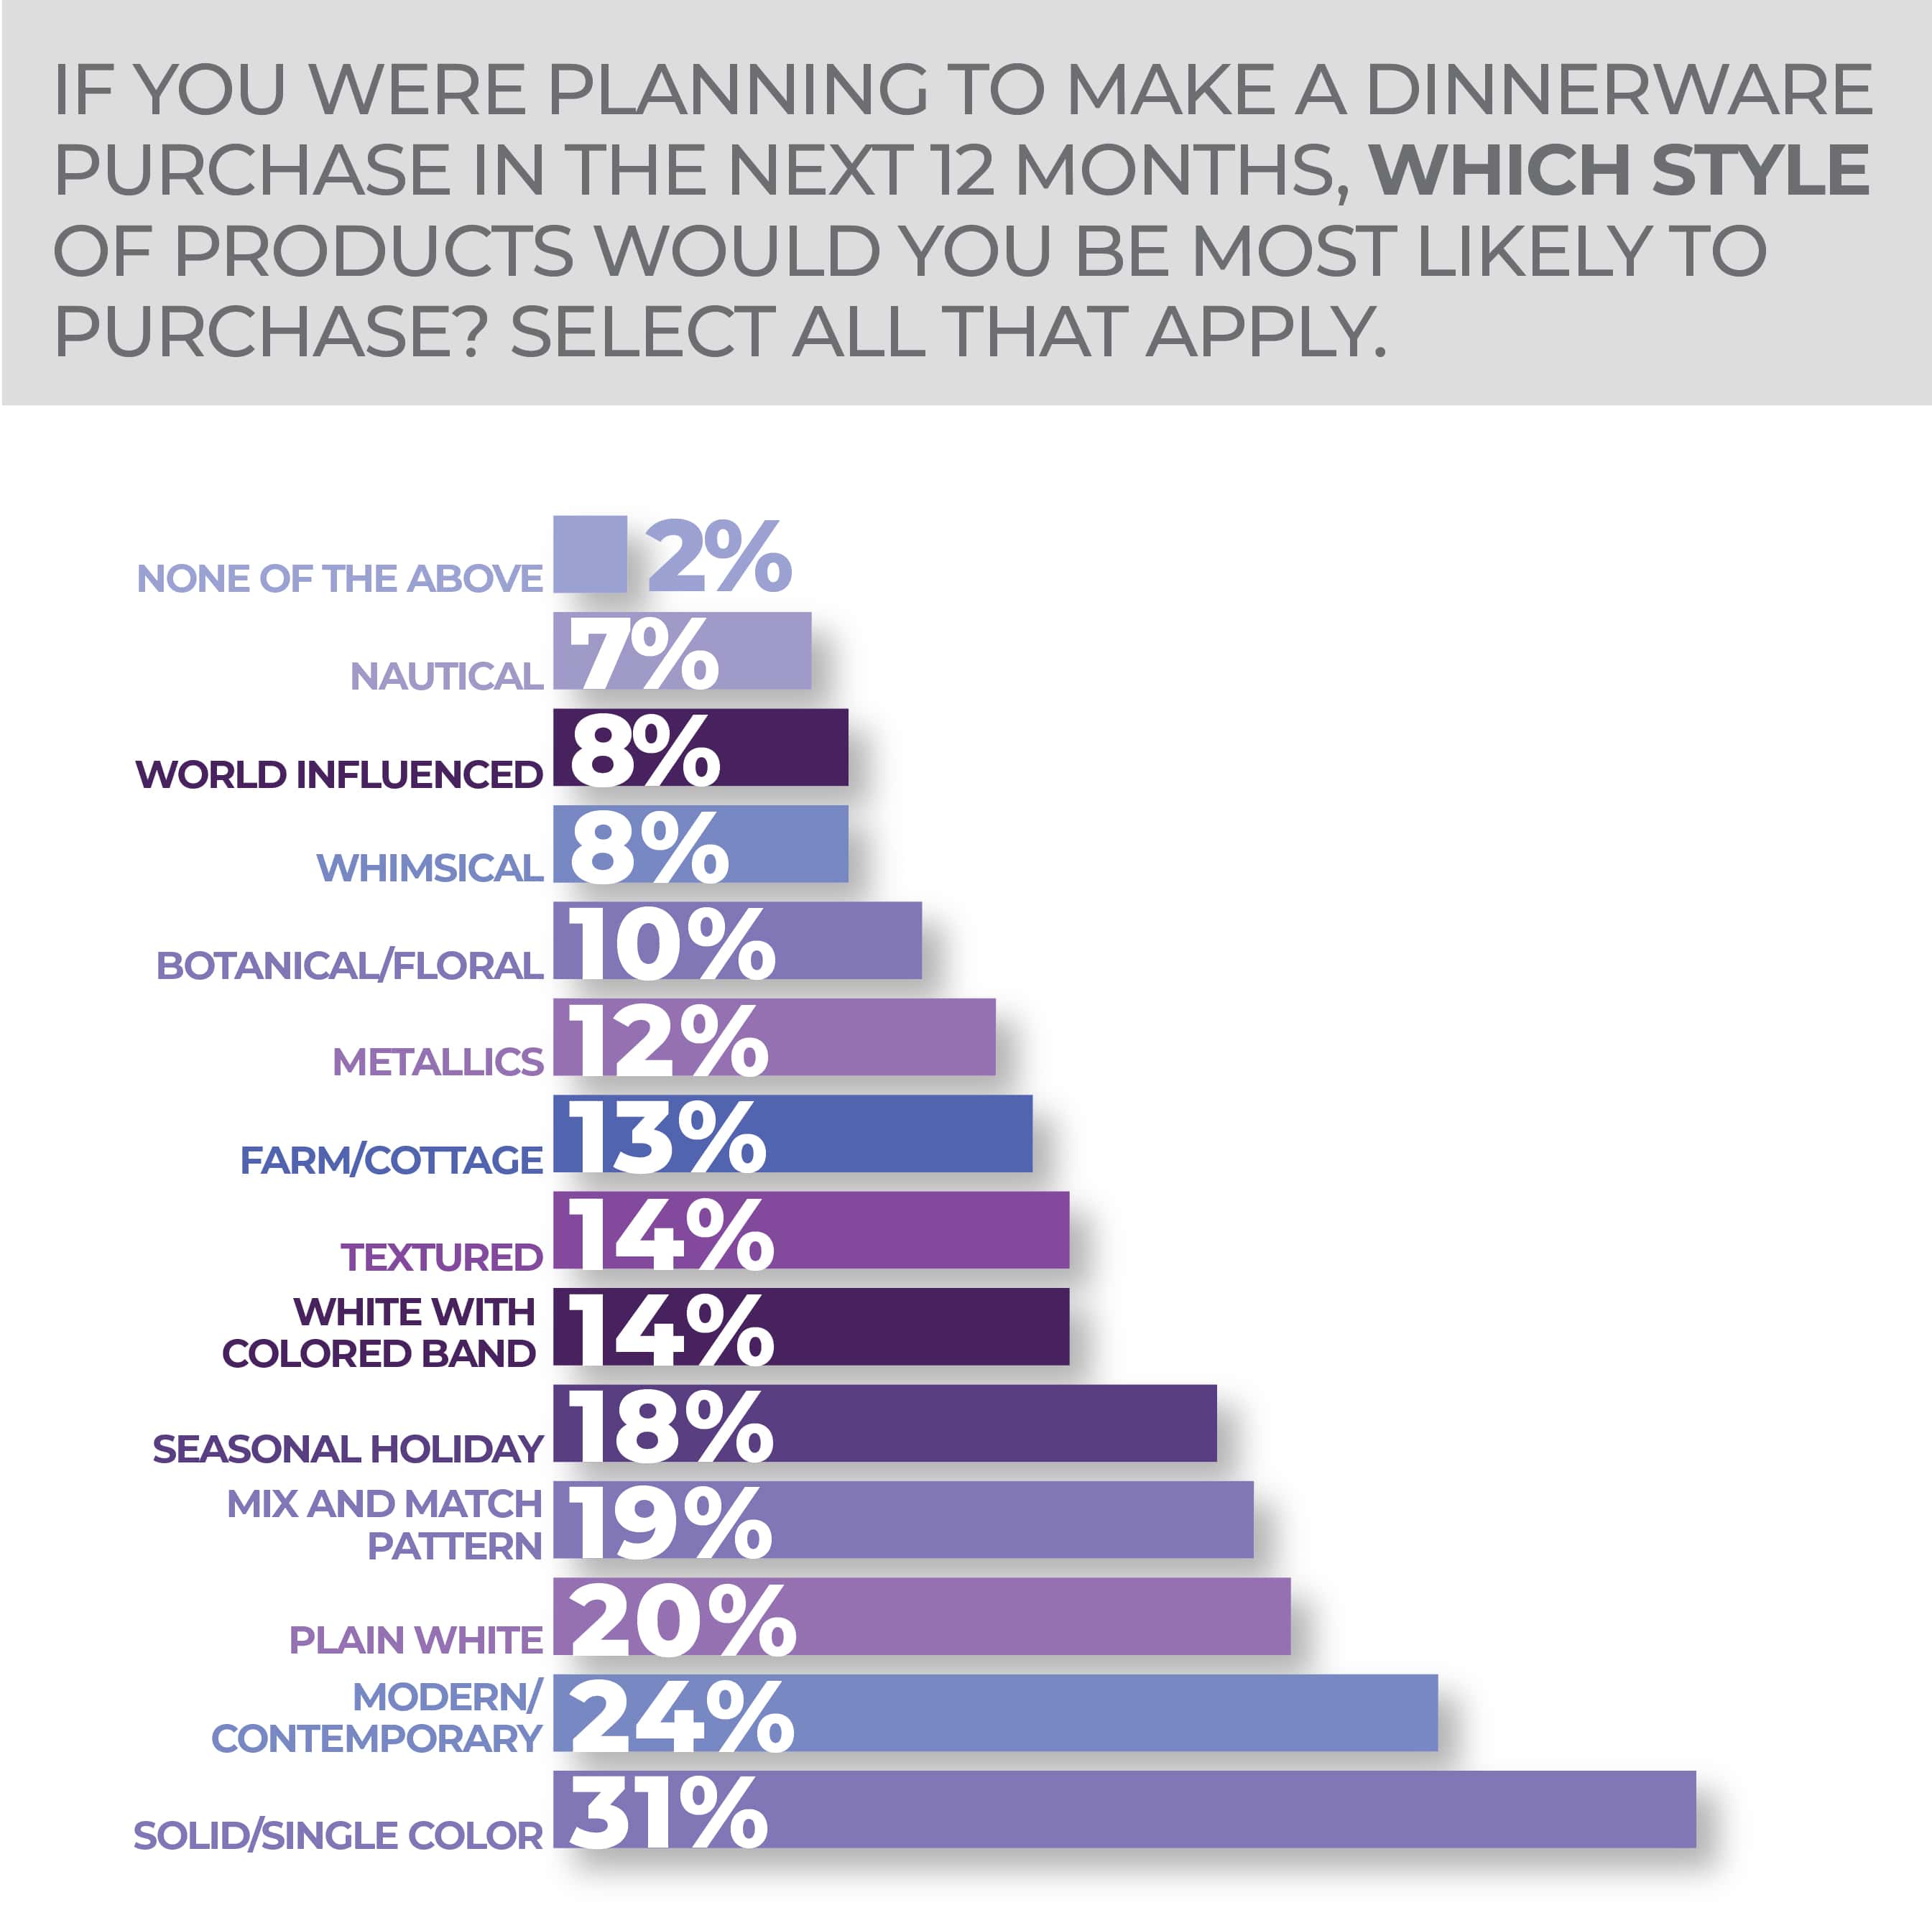
Switching places when compared to last year’s survey, solid/single color dinnerware is the most answered style of dinnerware respondents chose followed by modern/contemporary. Solid/single color dinnerware is up six points to 31% while modern/contemporary dinnerware has gone down five points to 24%. Plain white, mix-and-match pattern and seasonal holiday dinnerware follow, keeping the same spots as last year and remaining relatively the same.
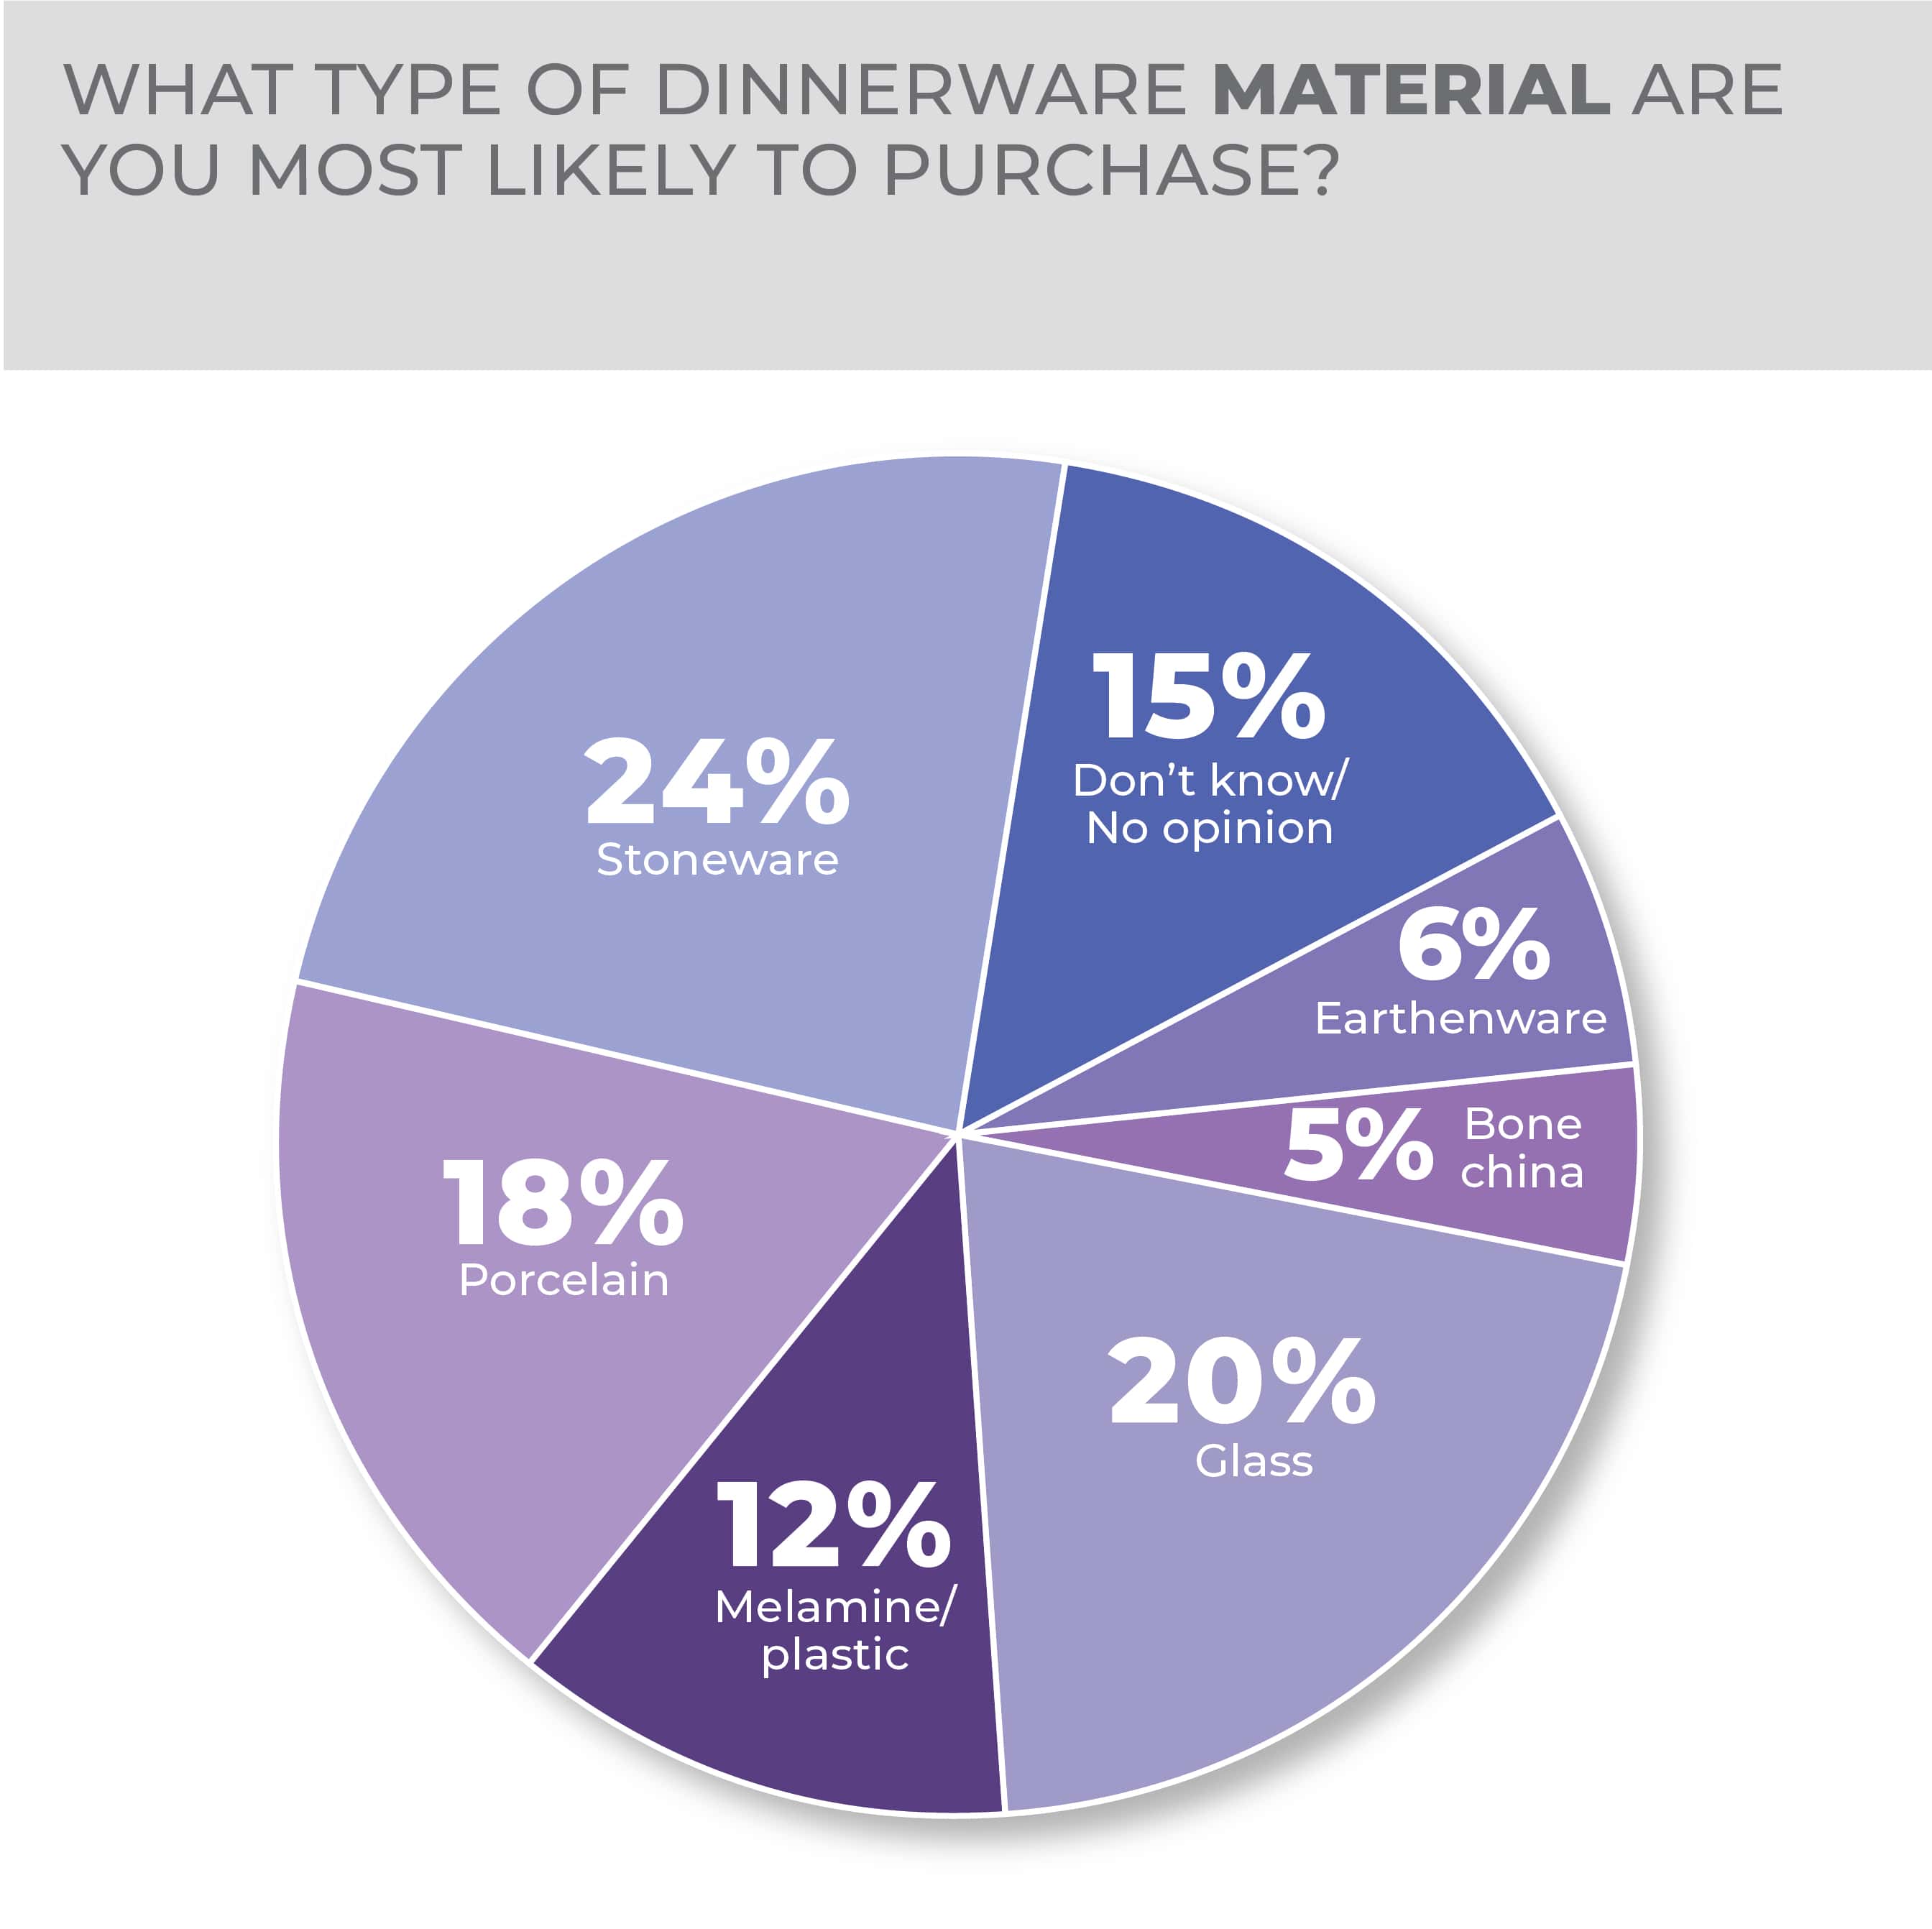
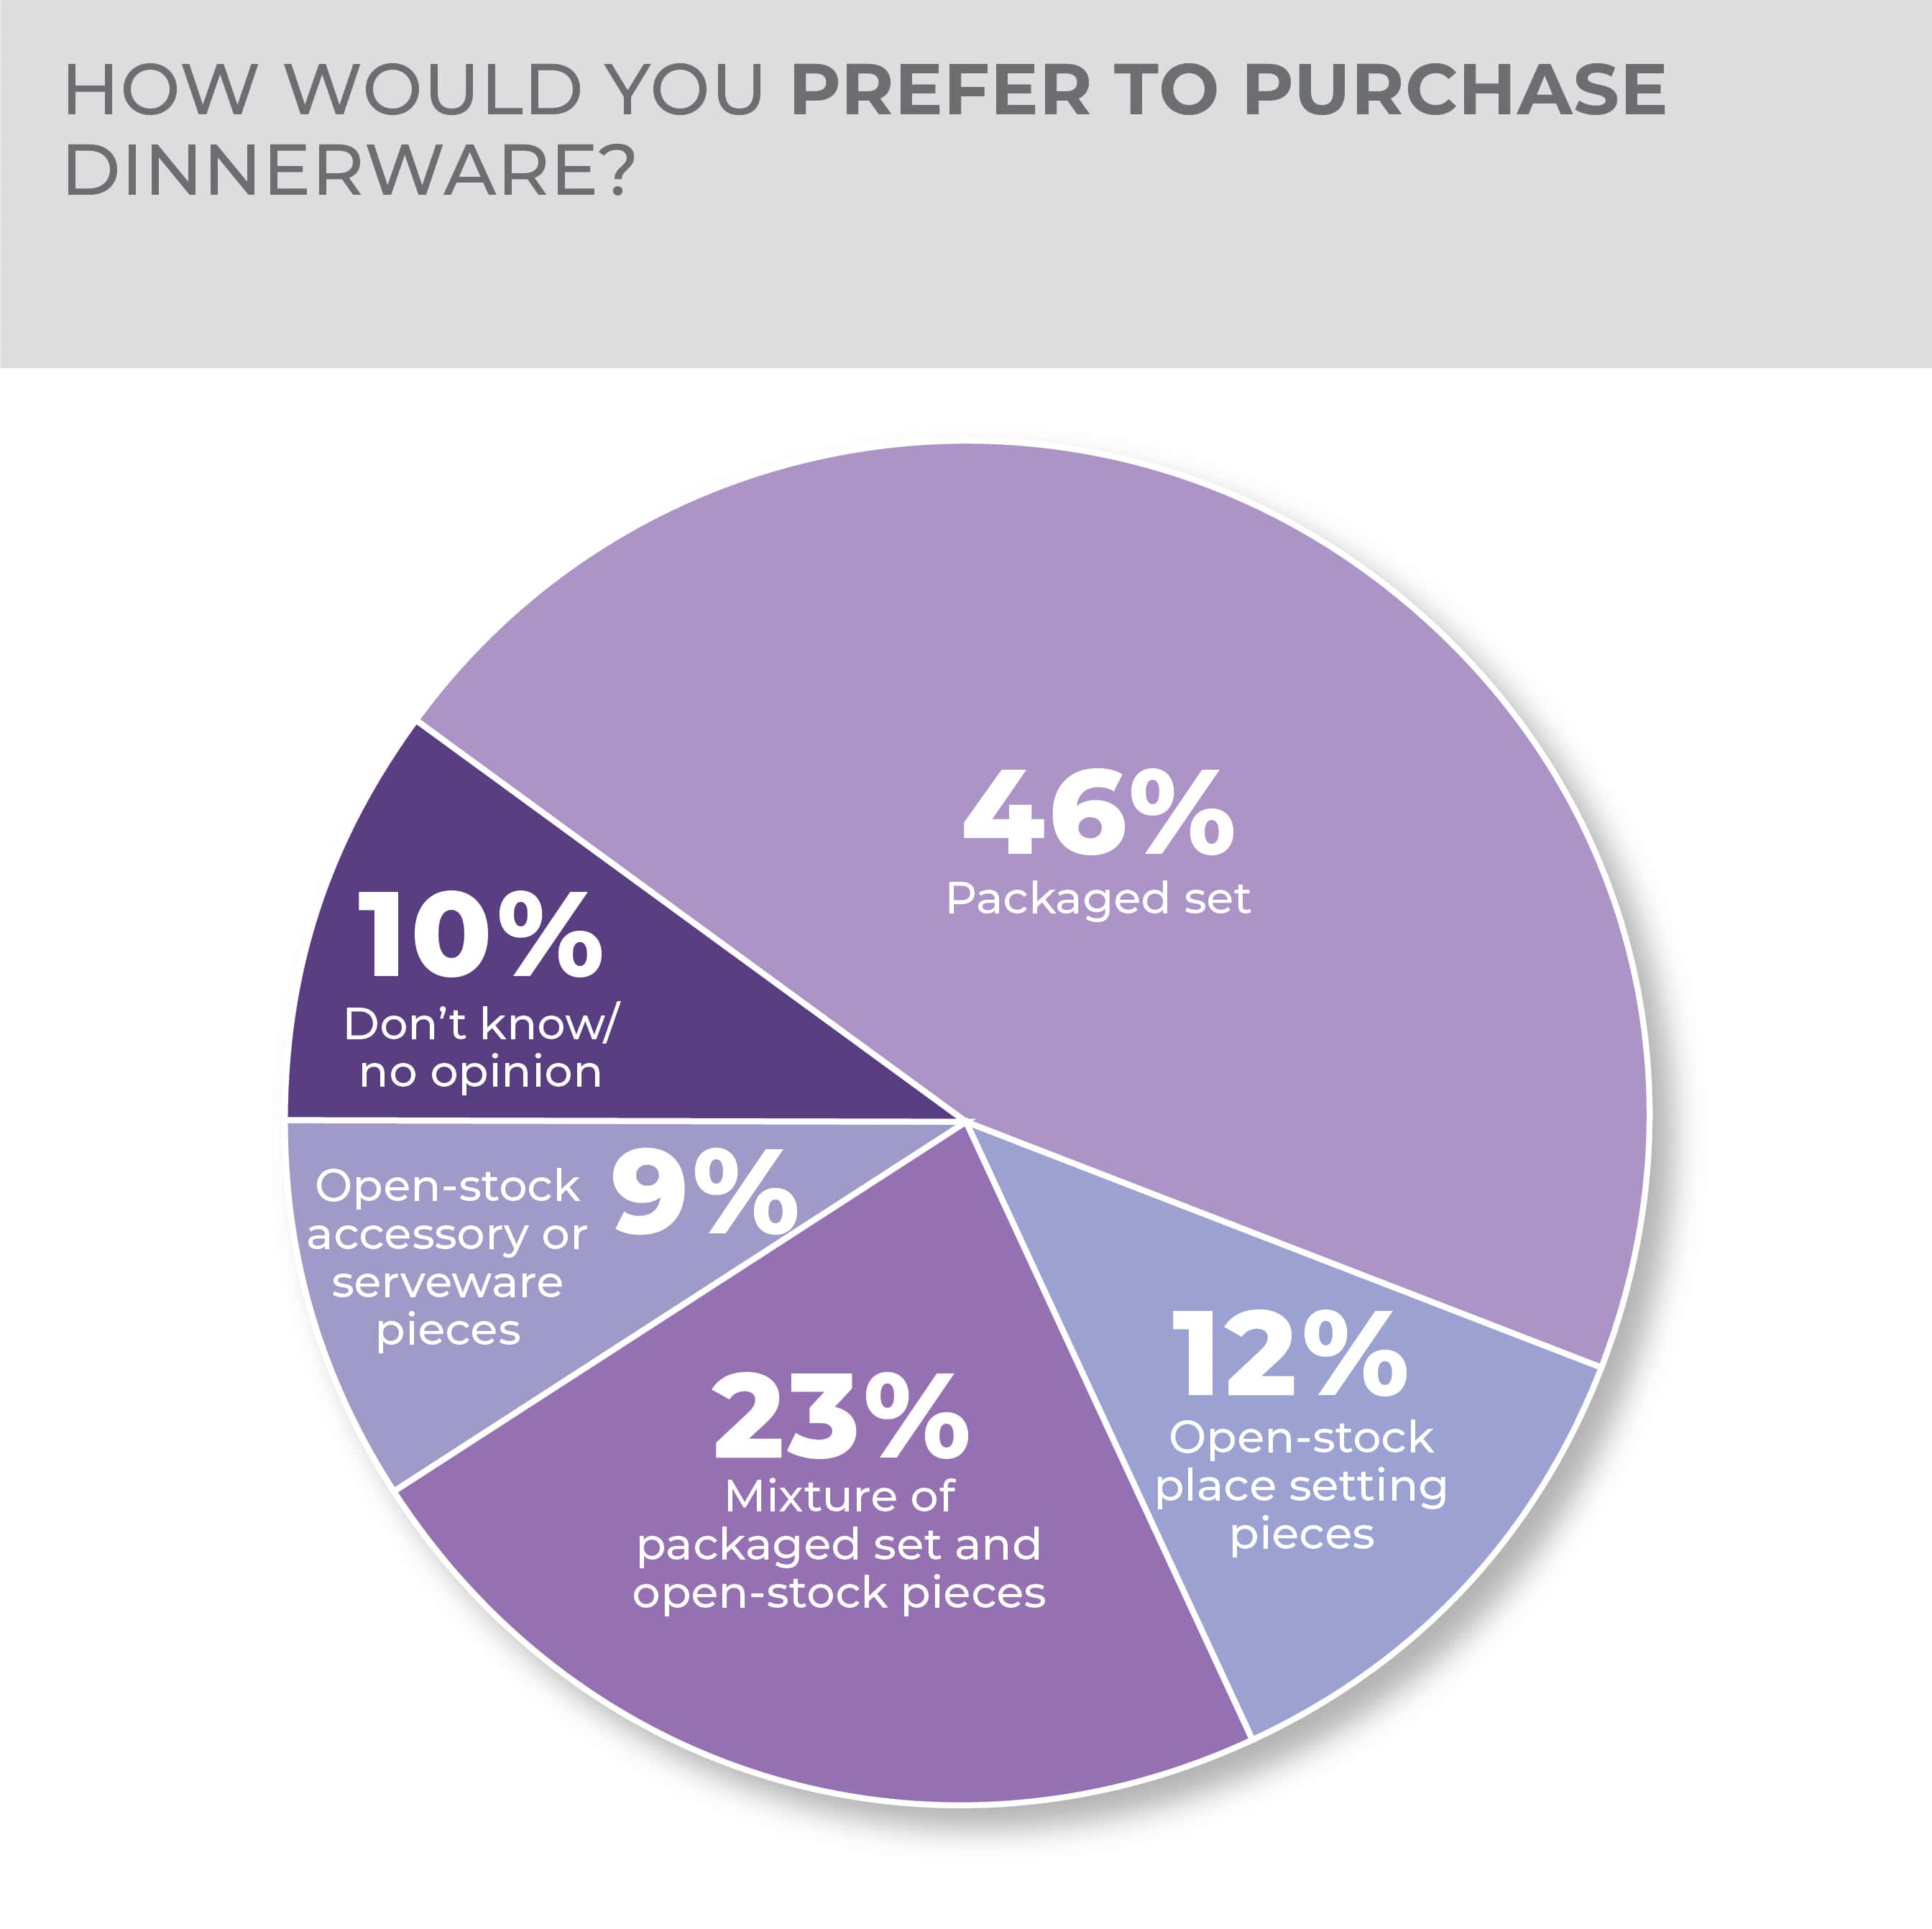
Almost half of the consumers prefer to purchase dinnerware in a packaged set, while almost a quarter prefer a mixture of packaged sets and open-stock pieces, which has not changed from last year. Also remaining the same year over year, respondents are still most likely to purchase stoneware at 24%, followed by glass at 20%, and porcelain at 18%. Earthenware and bone china are the least likely at 6% and 5%, respectively, while melamine/plastic was cited at 12%.
Generationally, Millennials and Gen Zers are most likely to purchase dinnerware at 24% and 23%, respectively, with Baby Boomers at just 5%.
More Dinnerware Findings:
Drinkware
Hydration, specialty beverages, healthy living, outdoor entertaining and on-the-go lifestyles are among the trends adding juice to the drinkware business. But there may be some marketing work to be done to fuel the next growth wave for portable and specialty beverageware.
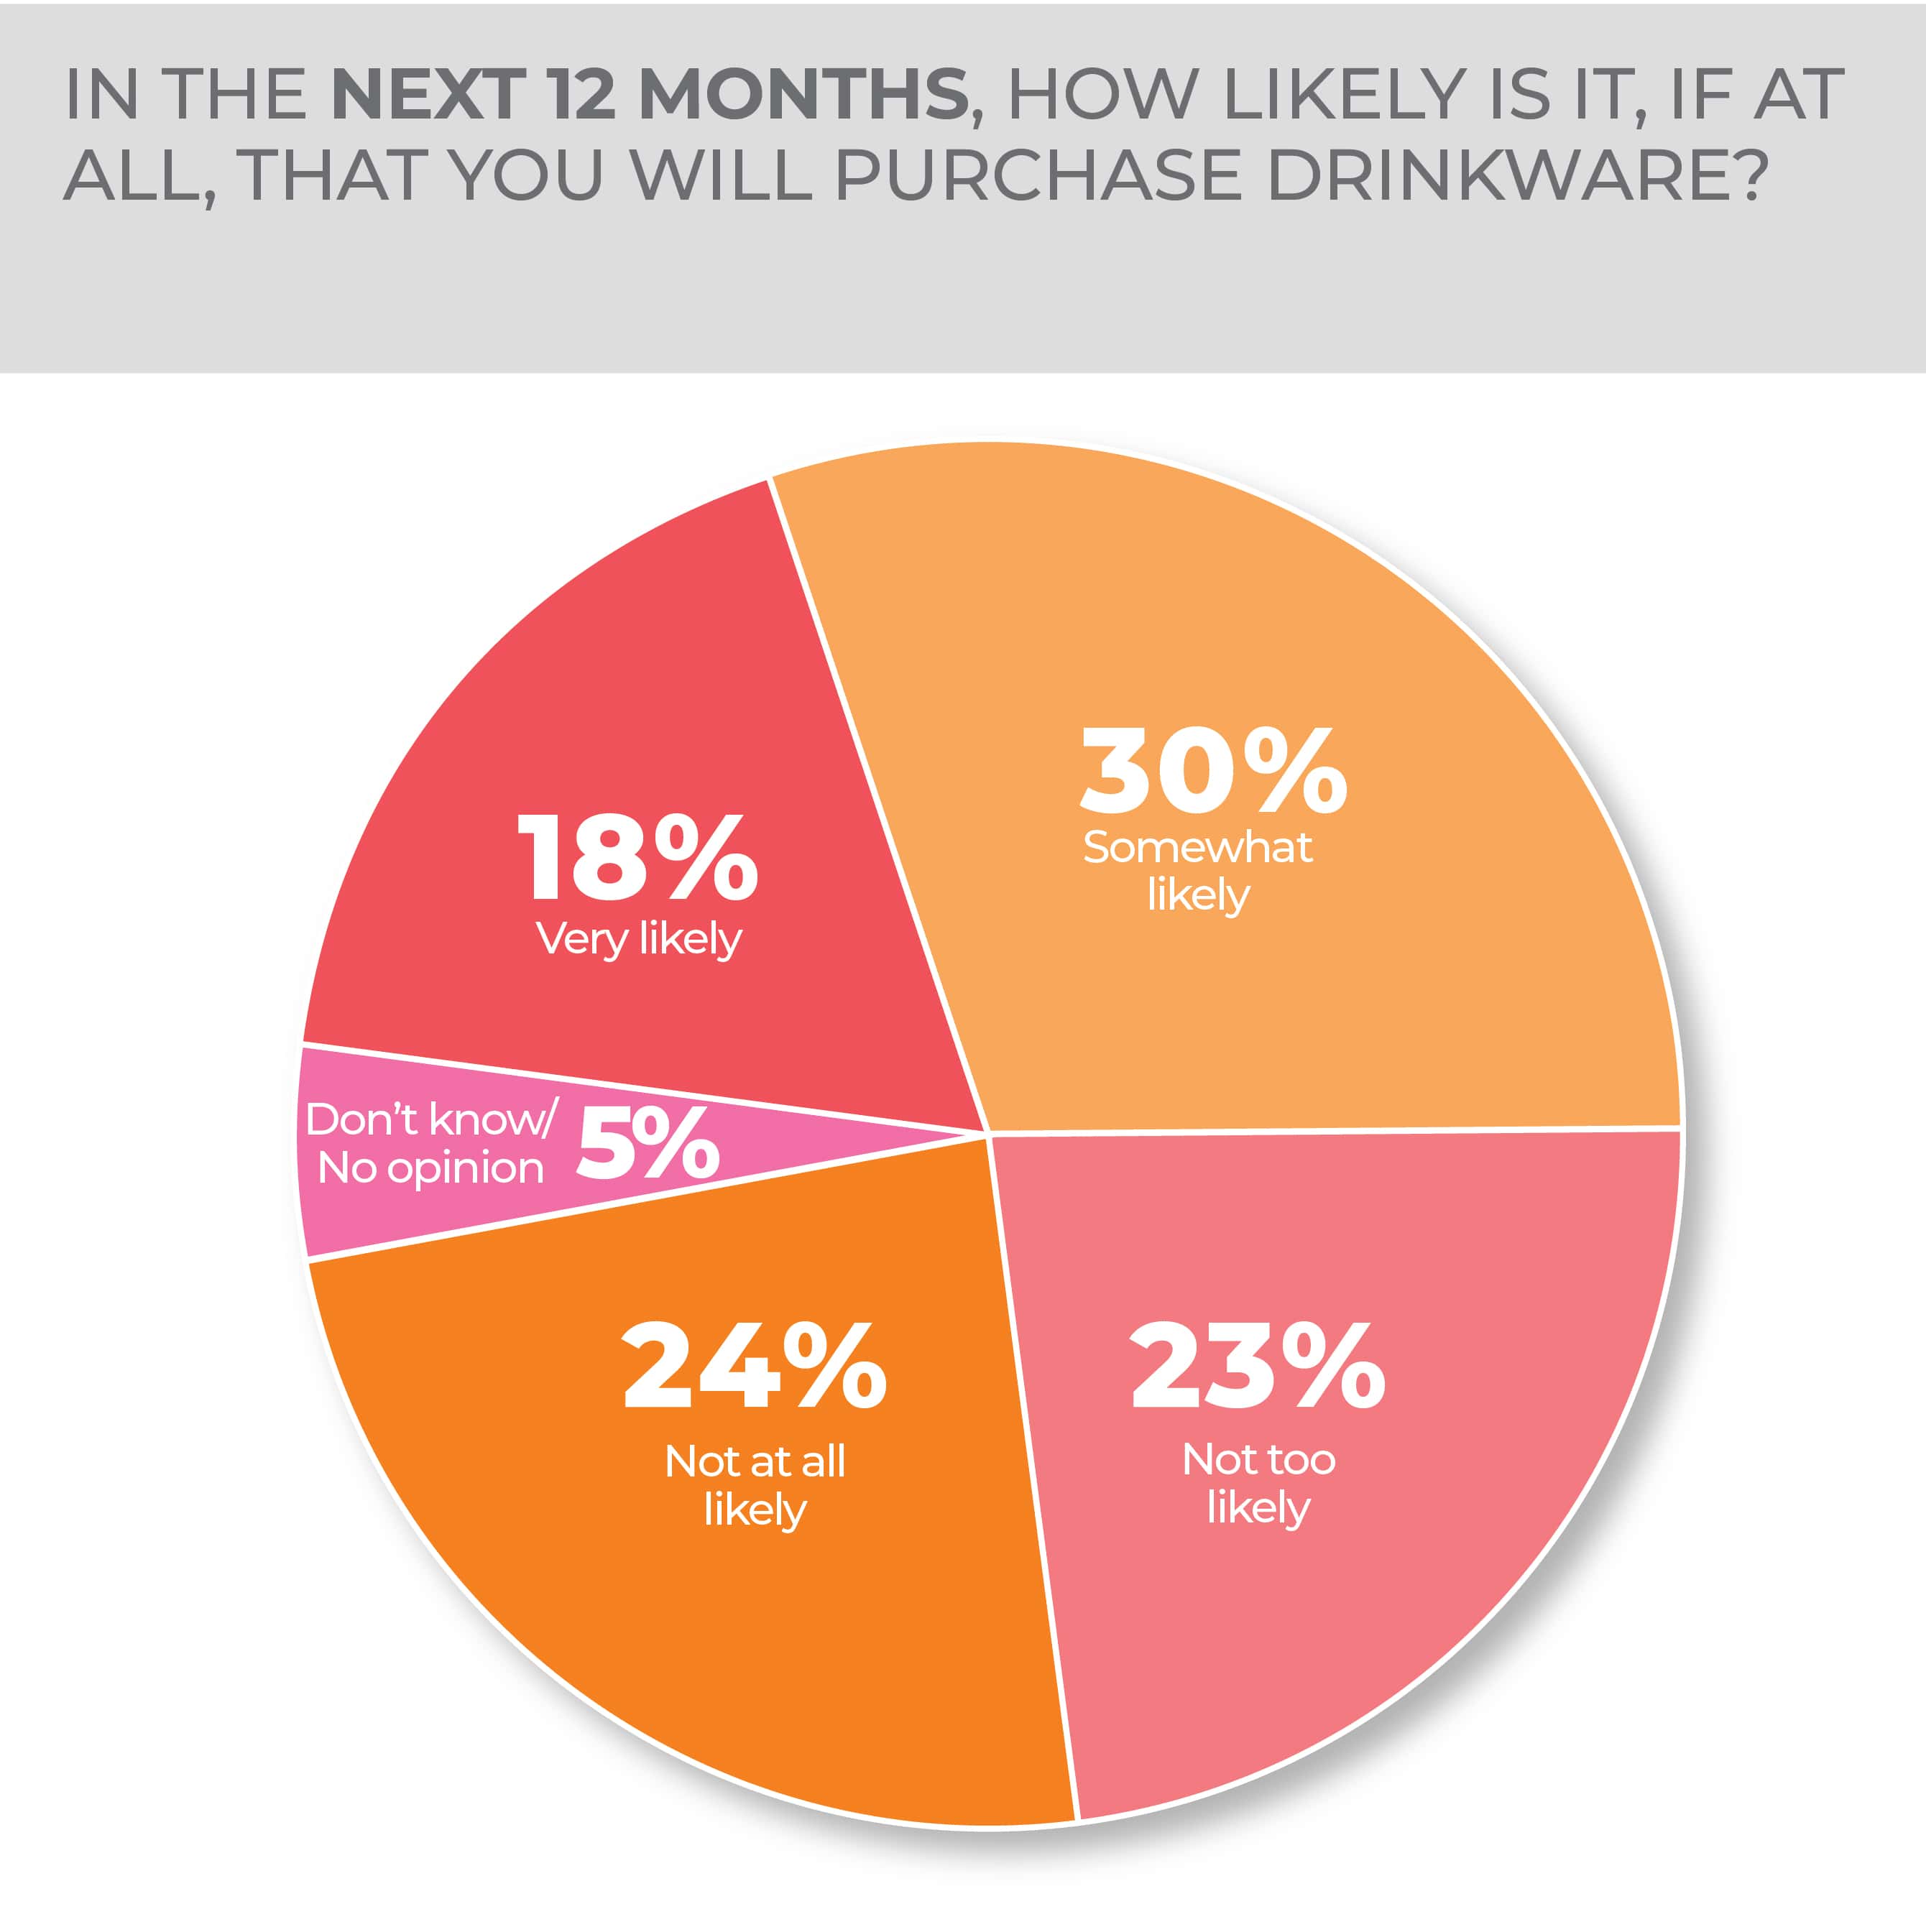
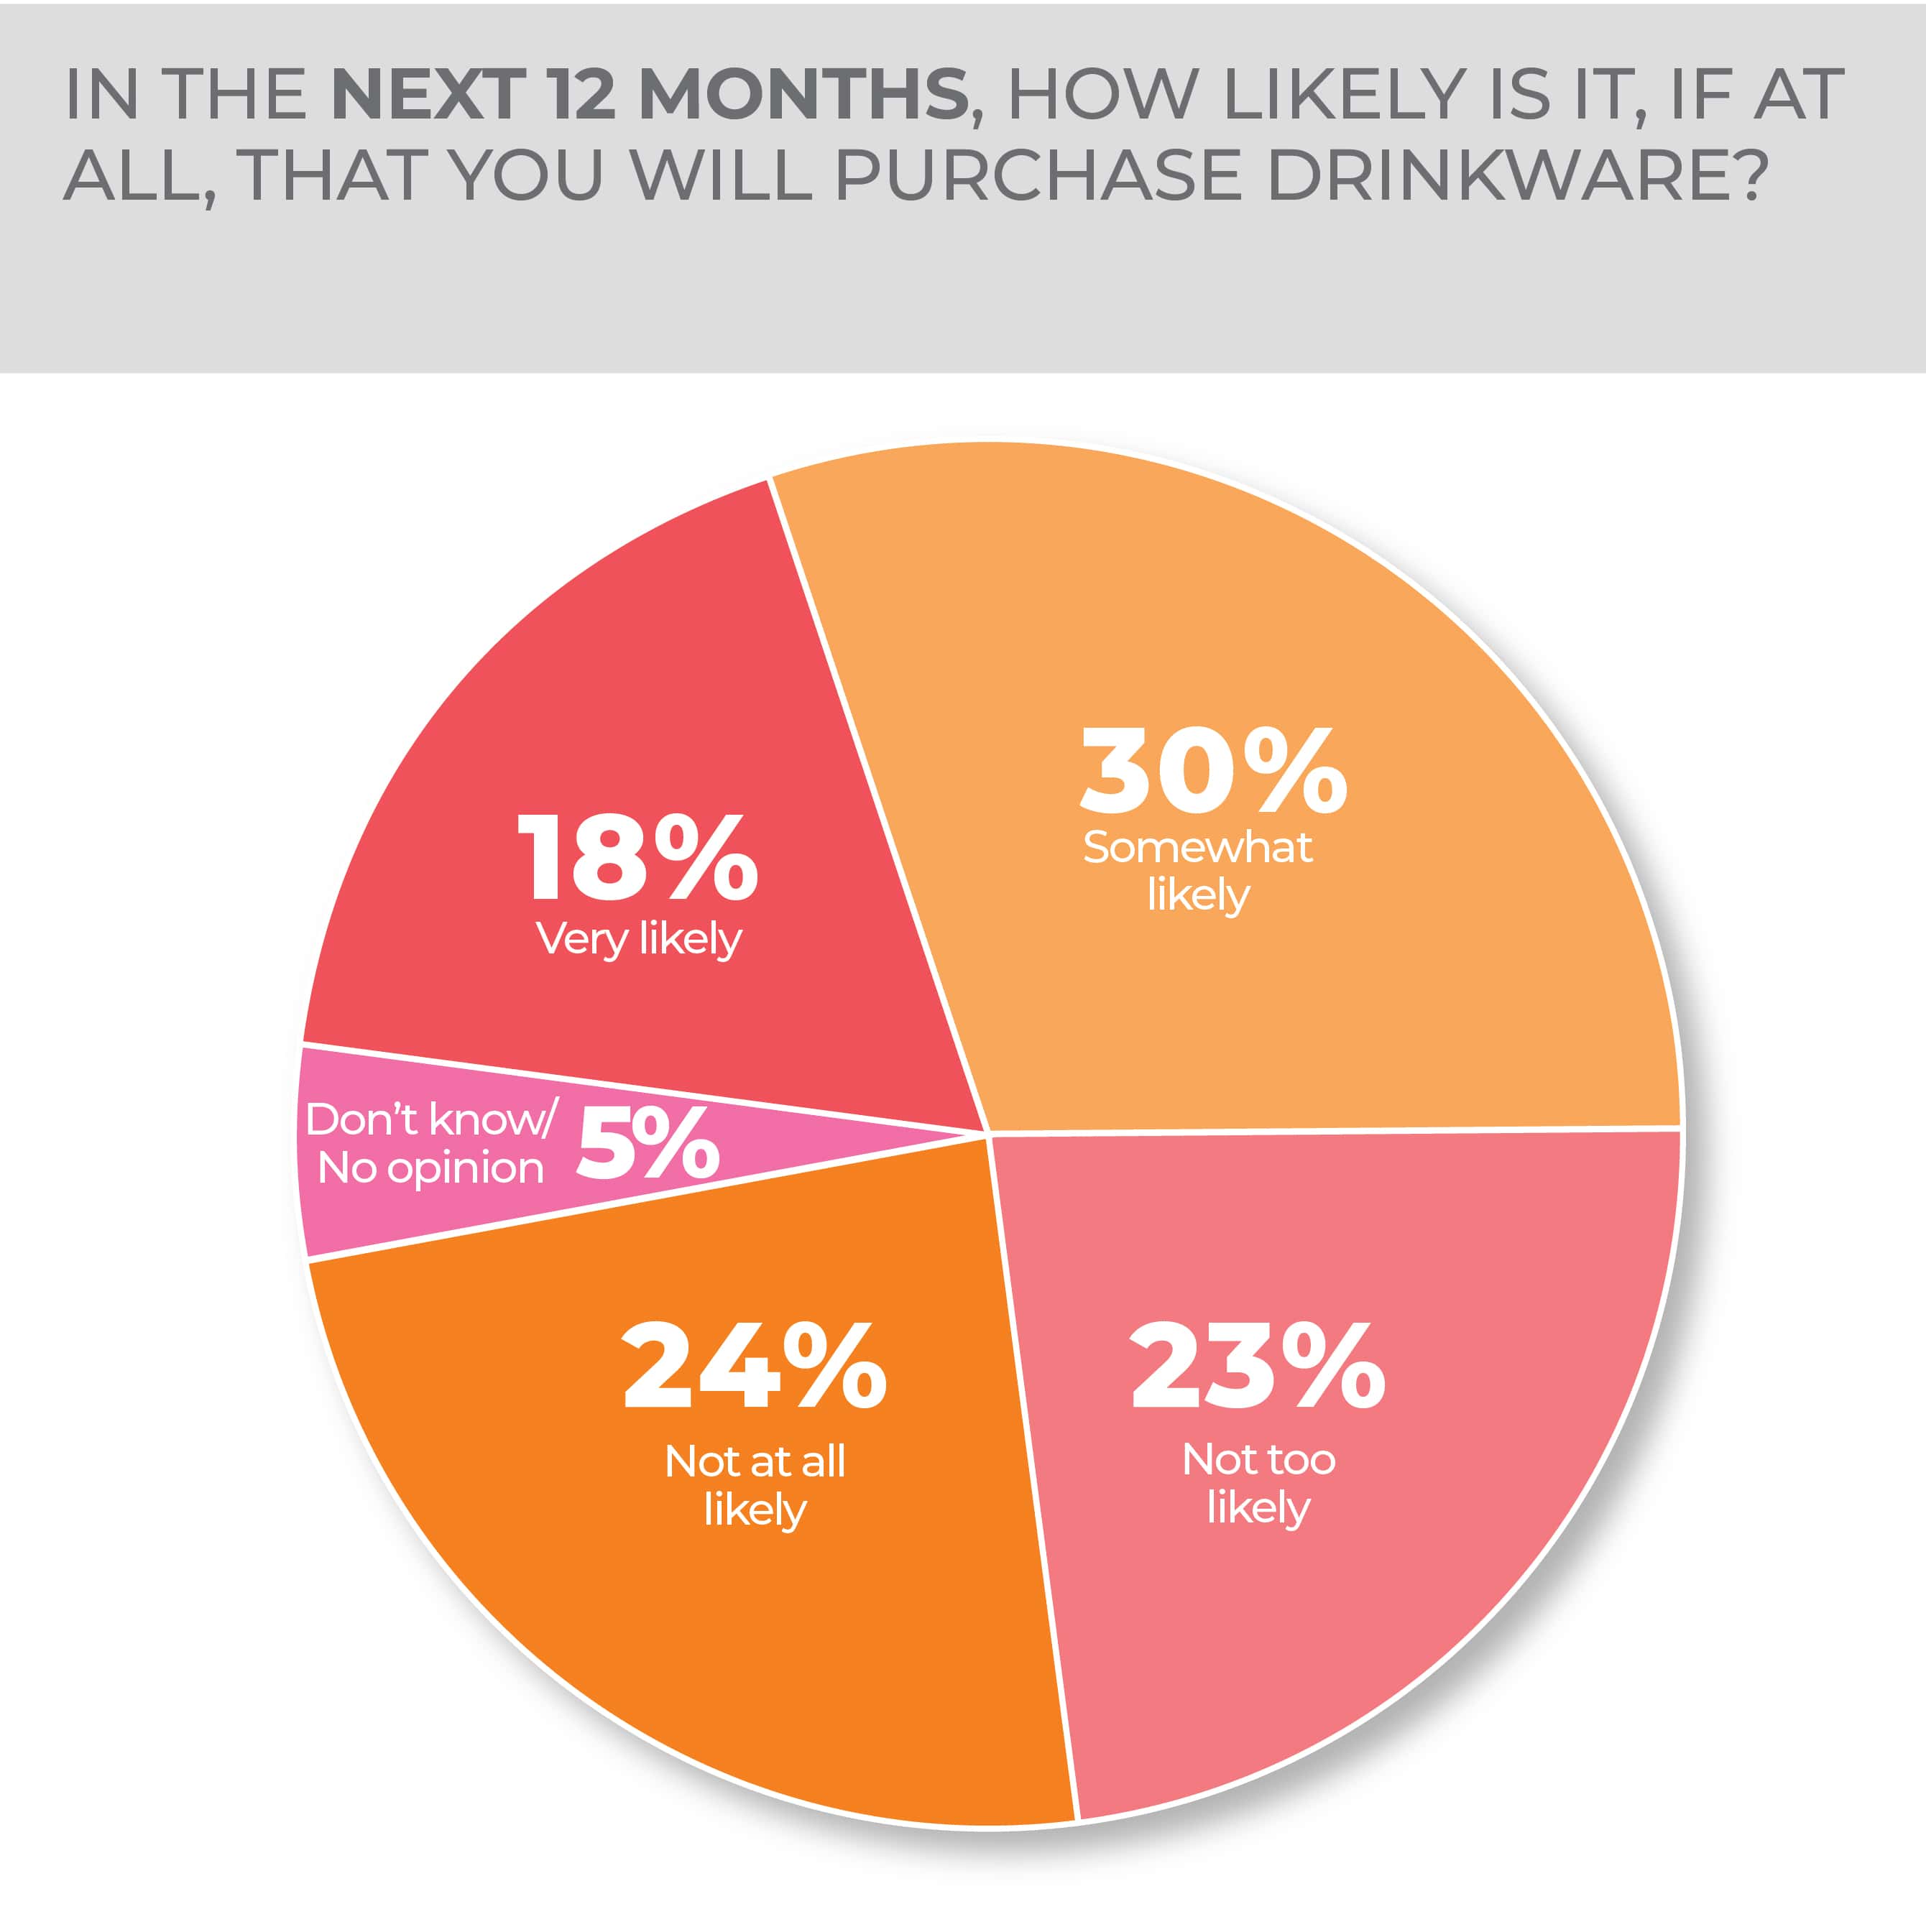
Most respondents to this year’s HomePage News 2023 Consumer Outlook Survey are only somewhat likely to purchase drinkware in the next 12 months at 30%, followed by not at all likely at 24%, not too likely at 23% and very likely at only 18%.
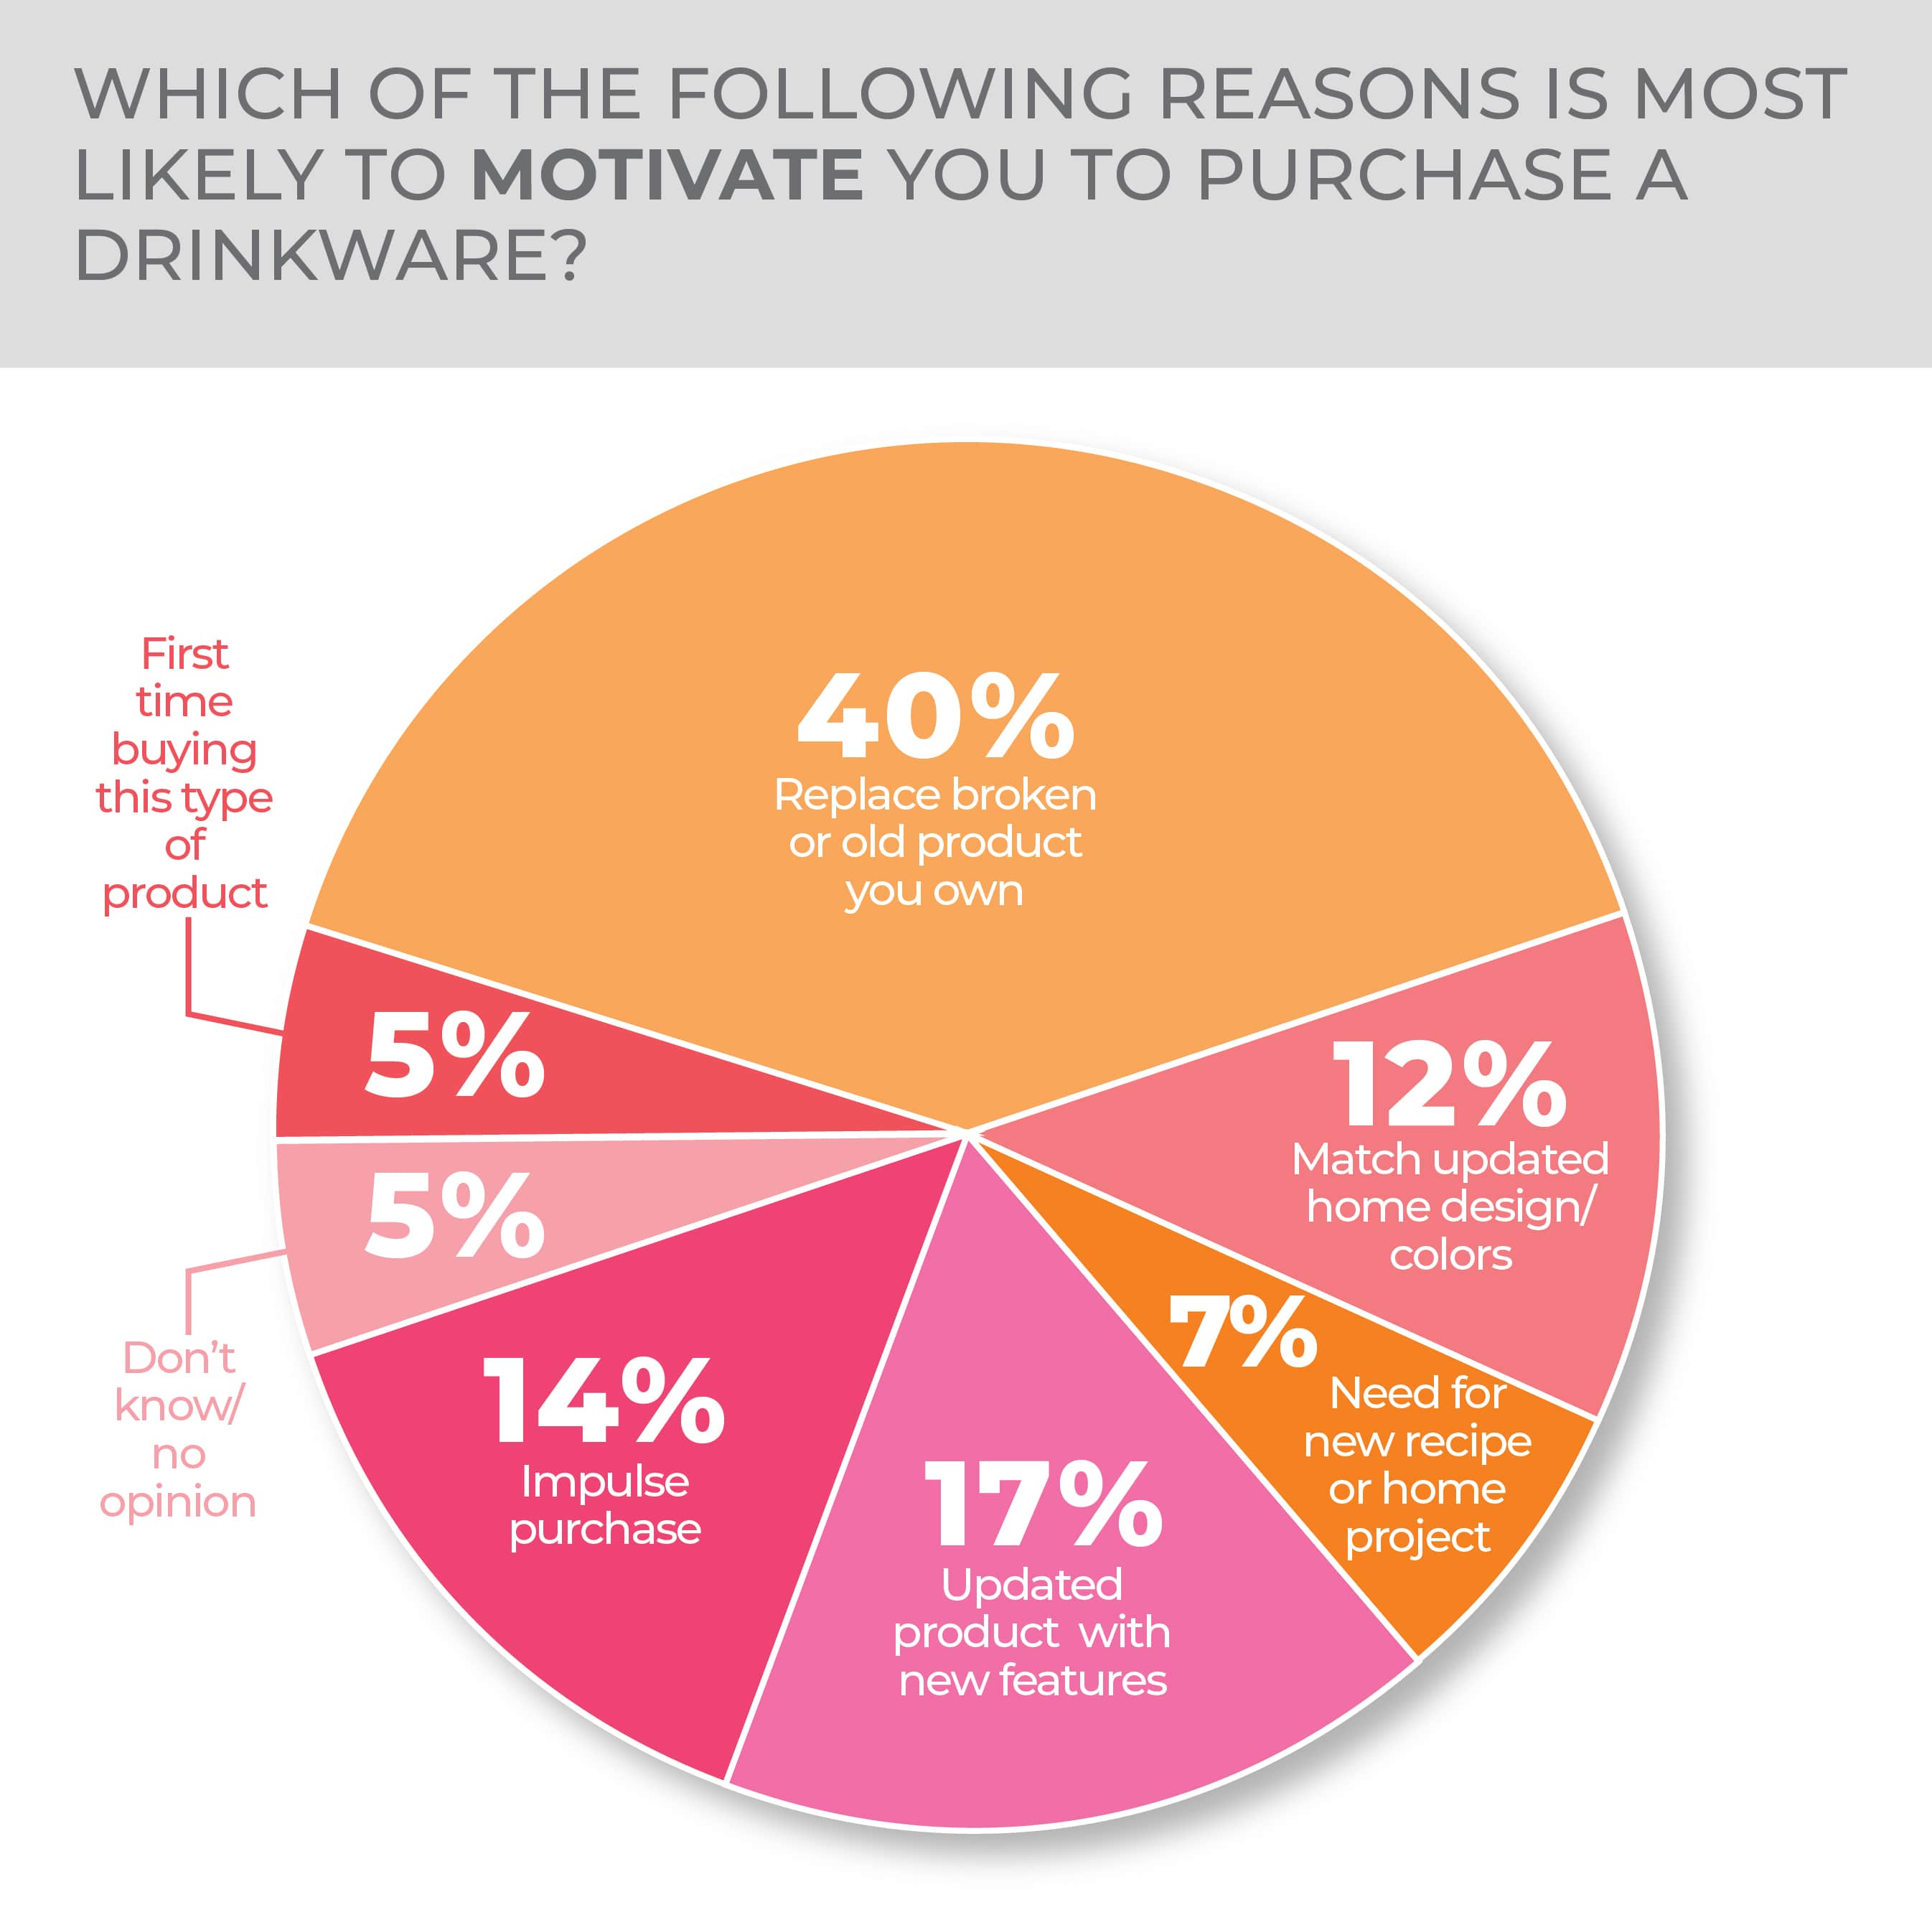
The most common reason chosen for purchasing a drinkware product is to replace a broken or old product, followed by purchasing an updated product with new features. Purchasing as an impulse purchase comes in third.
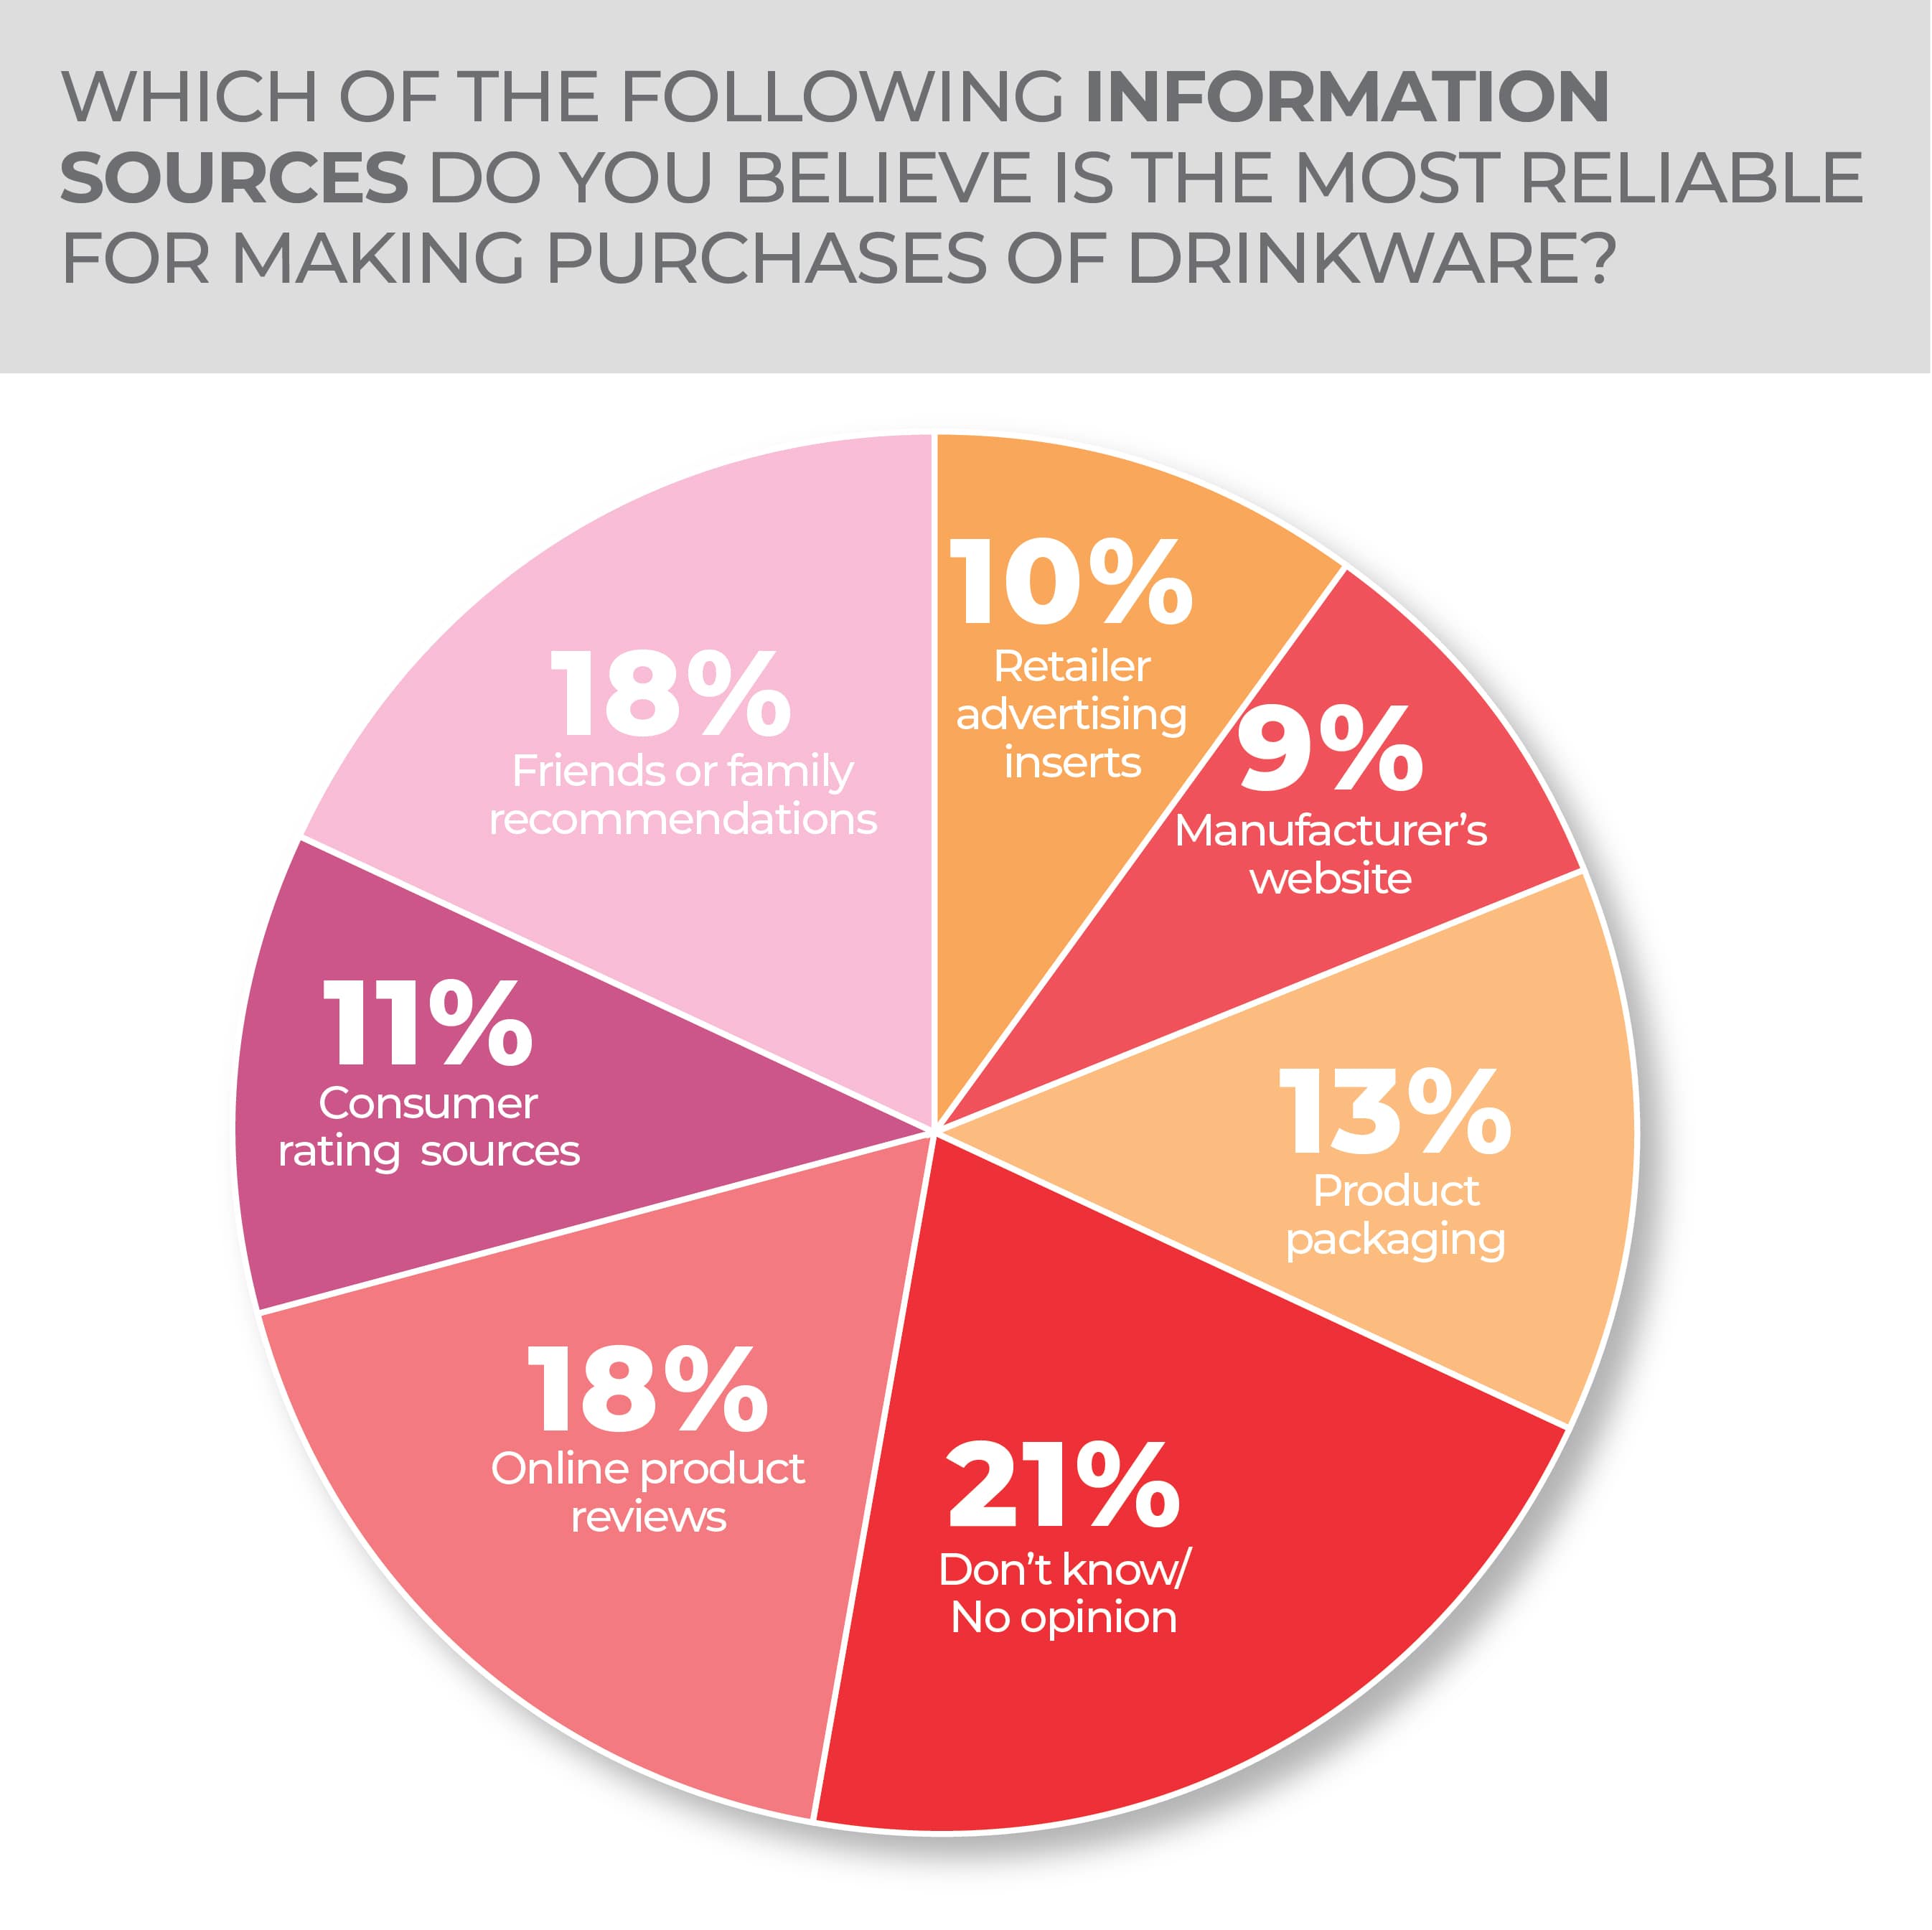
When it comes to information sources respondents thought were most reliable for making purchases of drinkware, most don’t know or don’t have an opinion at 21%. Online product reviews and friends and family recommendations tied for second at 18%, slightly down from last year when they tied at 22%.
-
- Respondents to the survey expect a lot from their drinkware with five attributes of portable drinkware they consider important coming in over 50%.
- Generationally, Gen Zers are most likely to make a drinkware purchase followed closely by Millennials one point down.
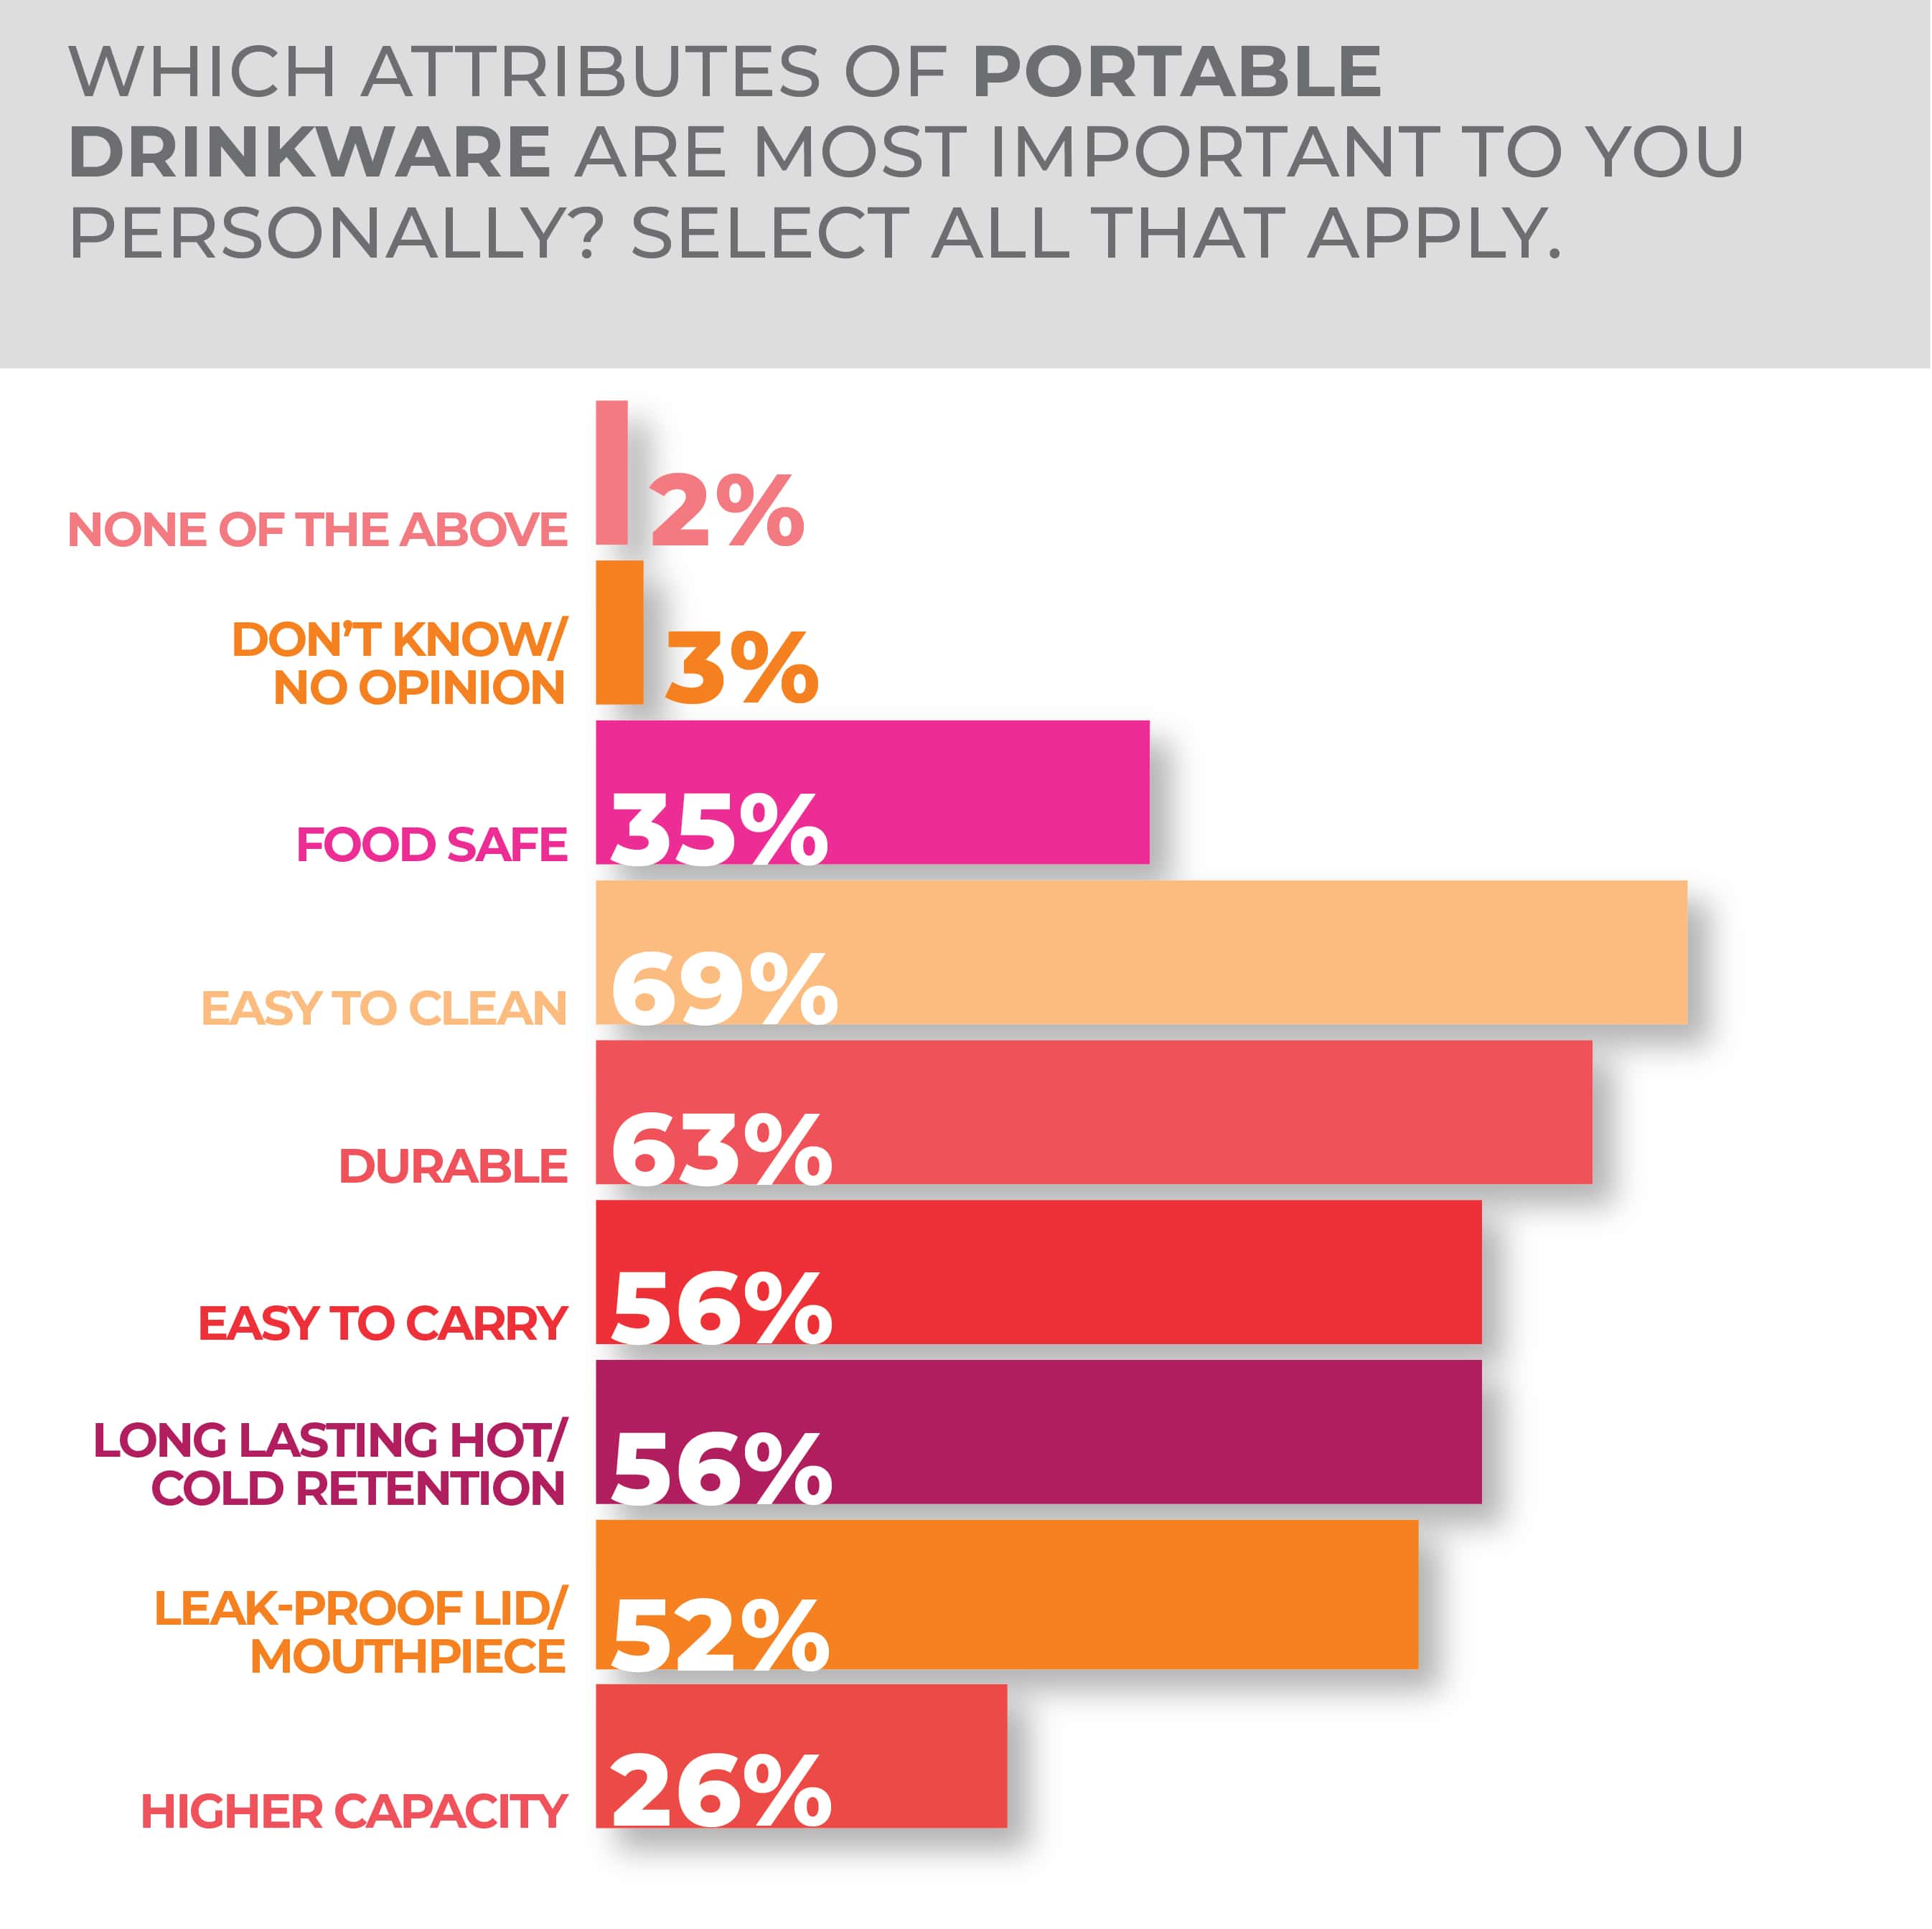
Respondents to the survey expect a lot from their drinkware with five attributes of portable drinkware they consider important coming in over 50%: easy to clean at 69%, durable at 63%, easy to carry at 56% and leak-proof lid/mouthpiece at 52%. Food-safe at 35%, and higher capacity at 26%, round out the attributes.
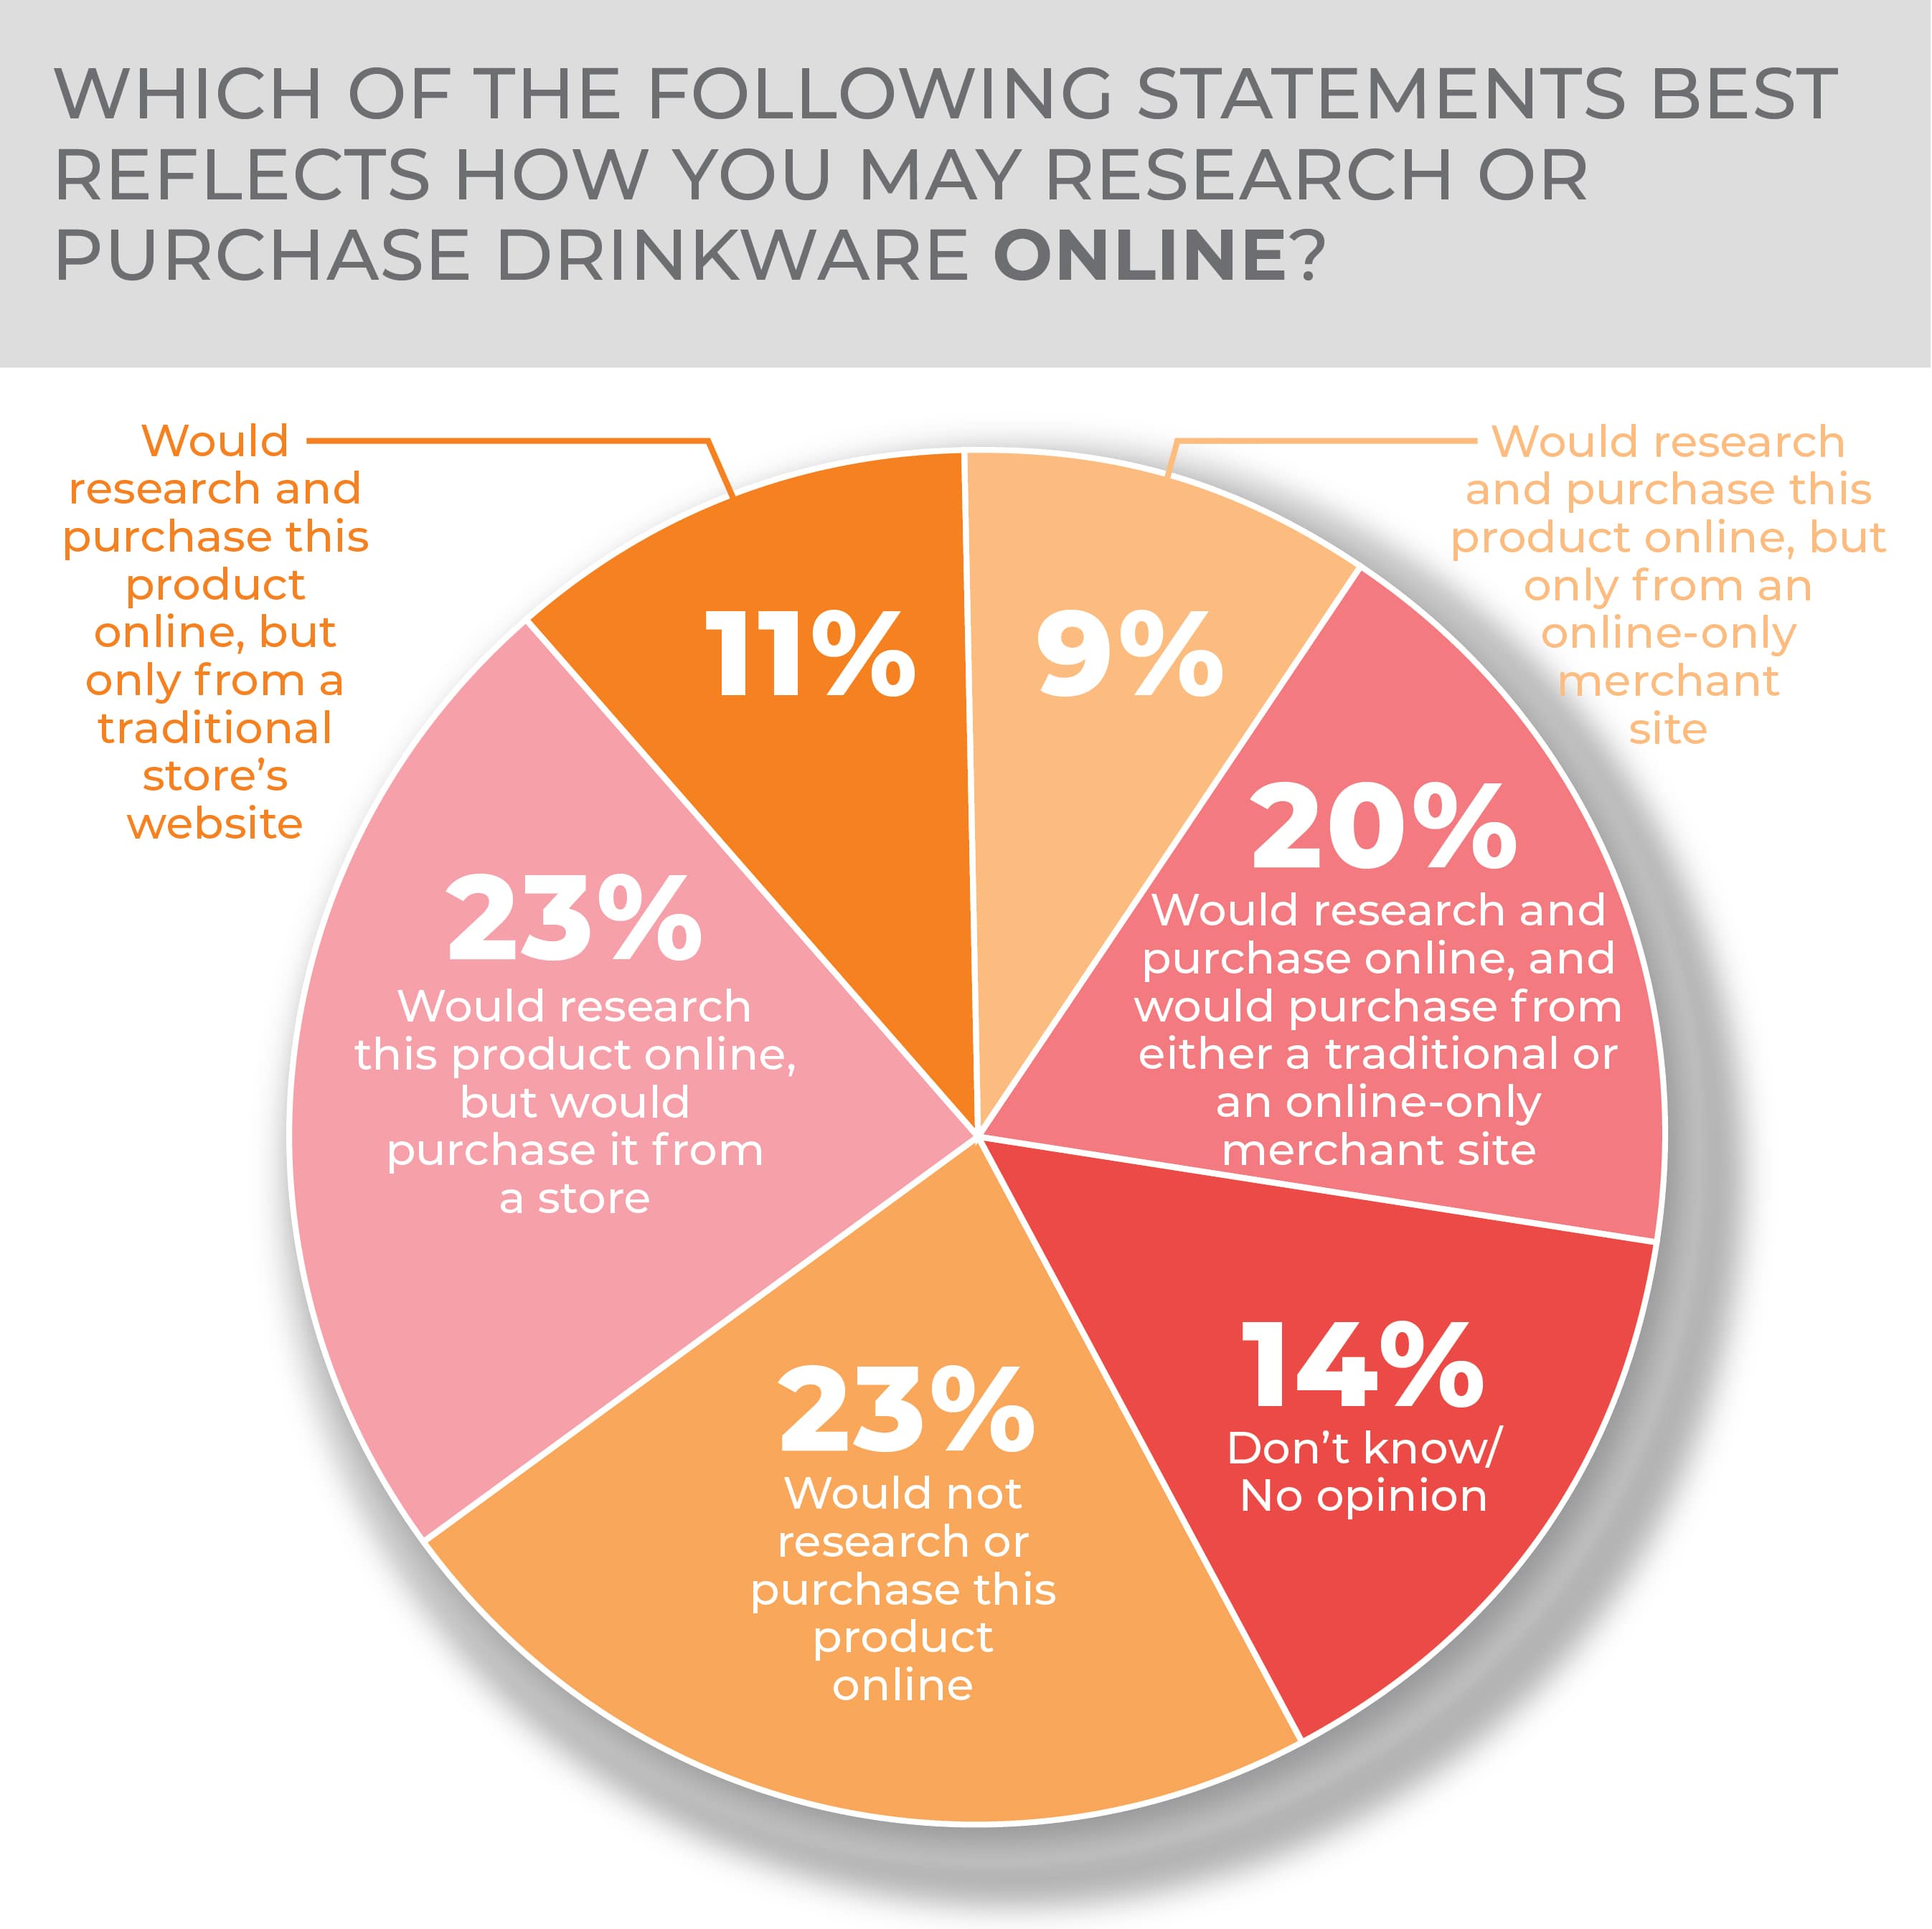
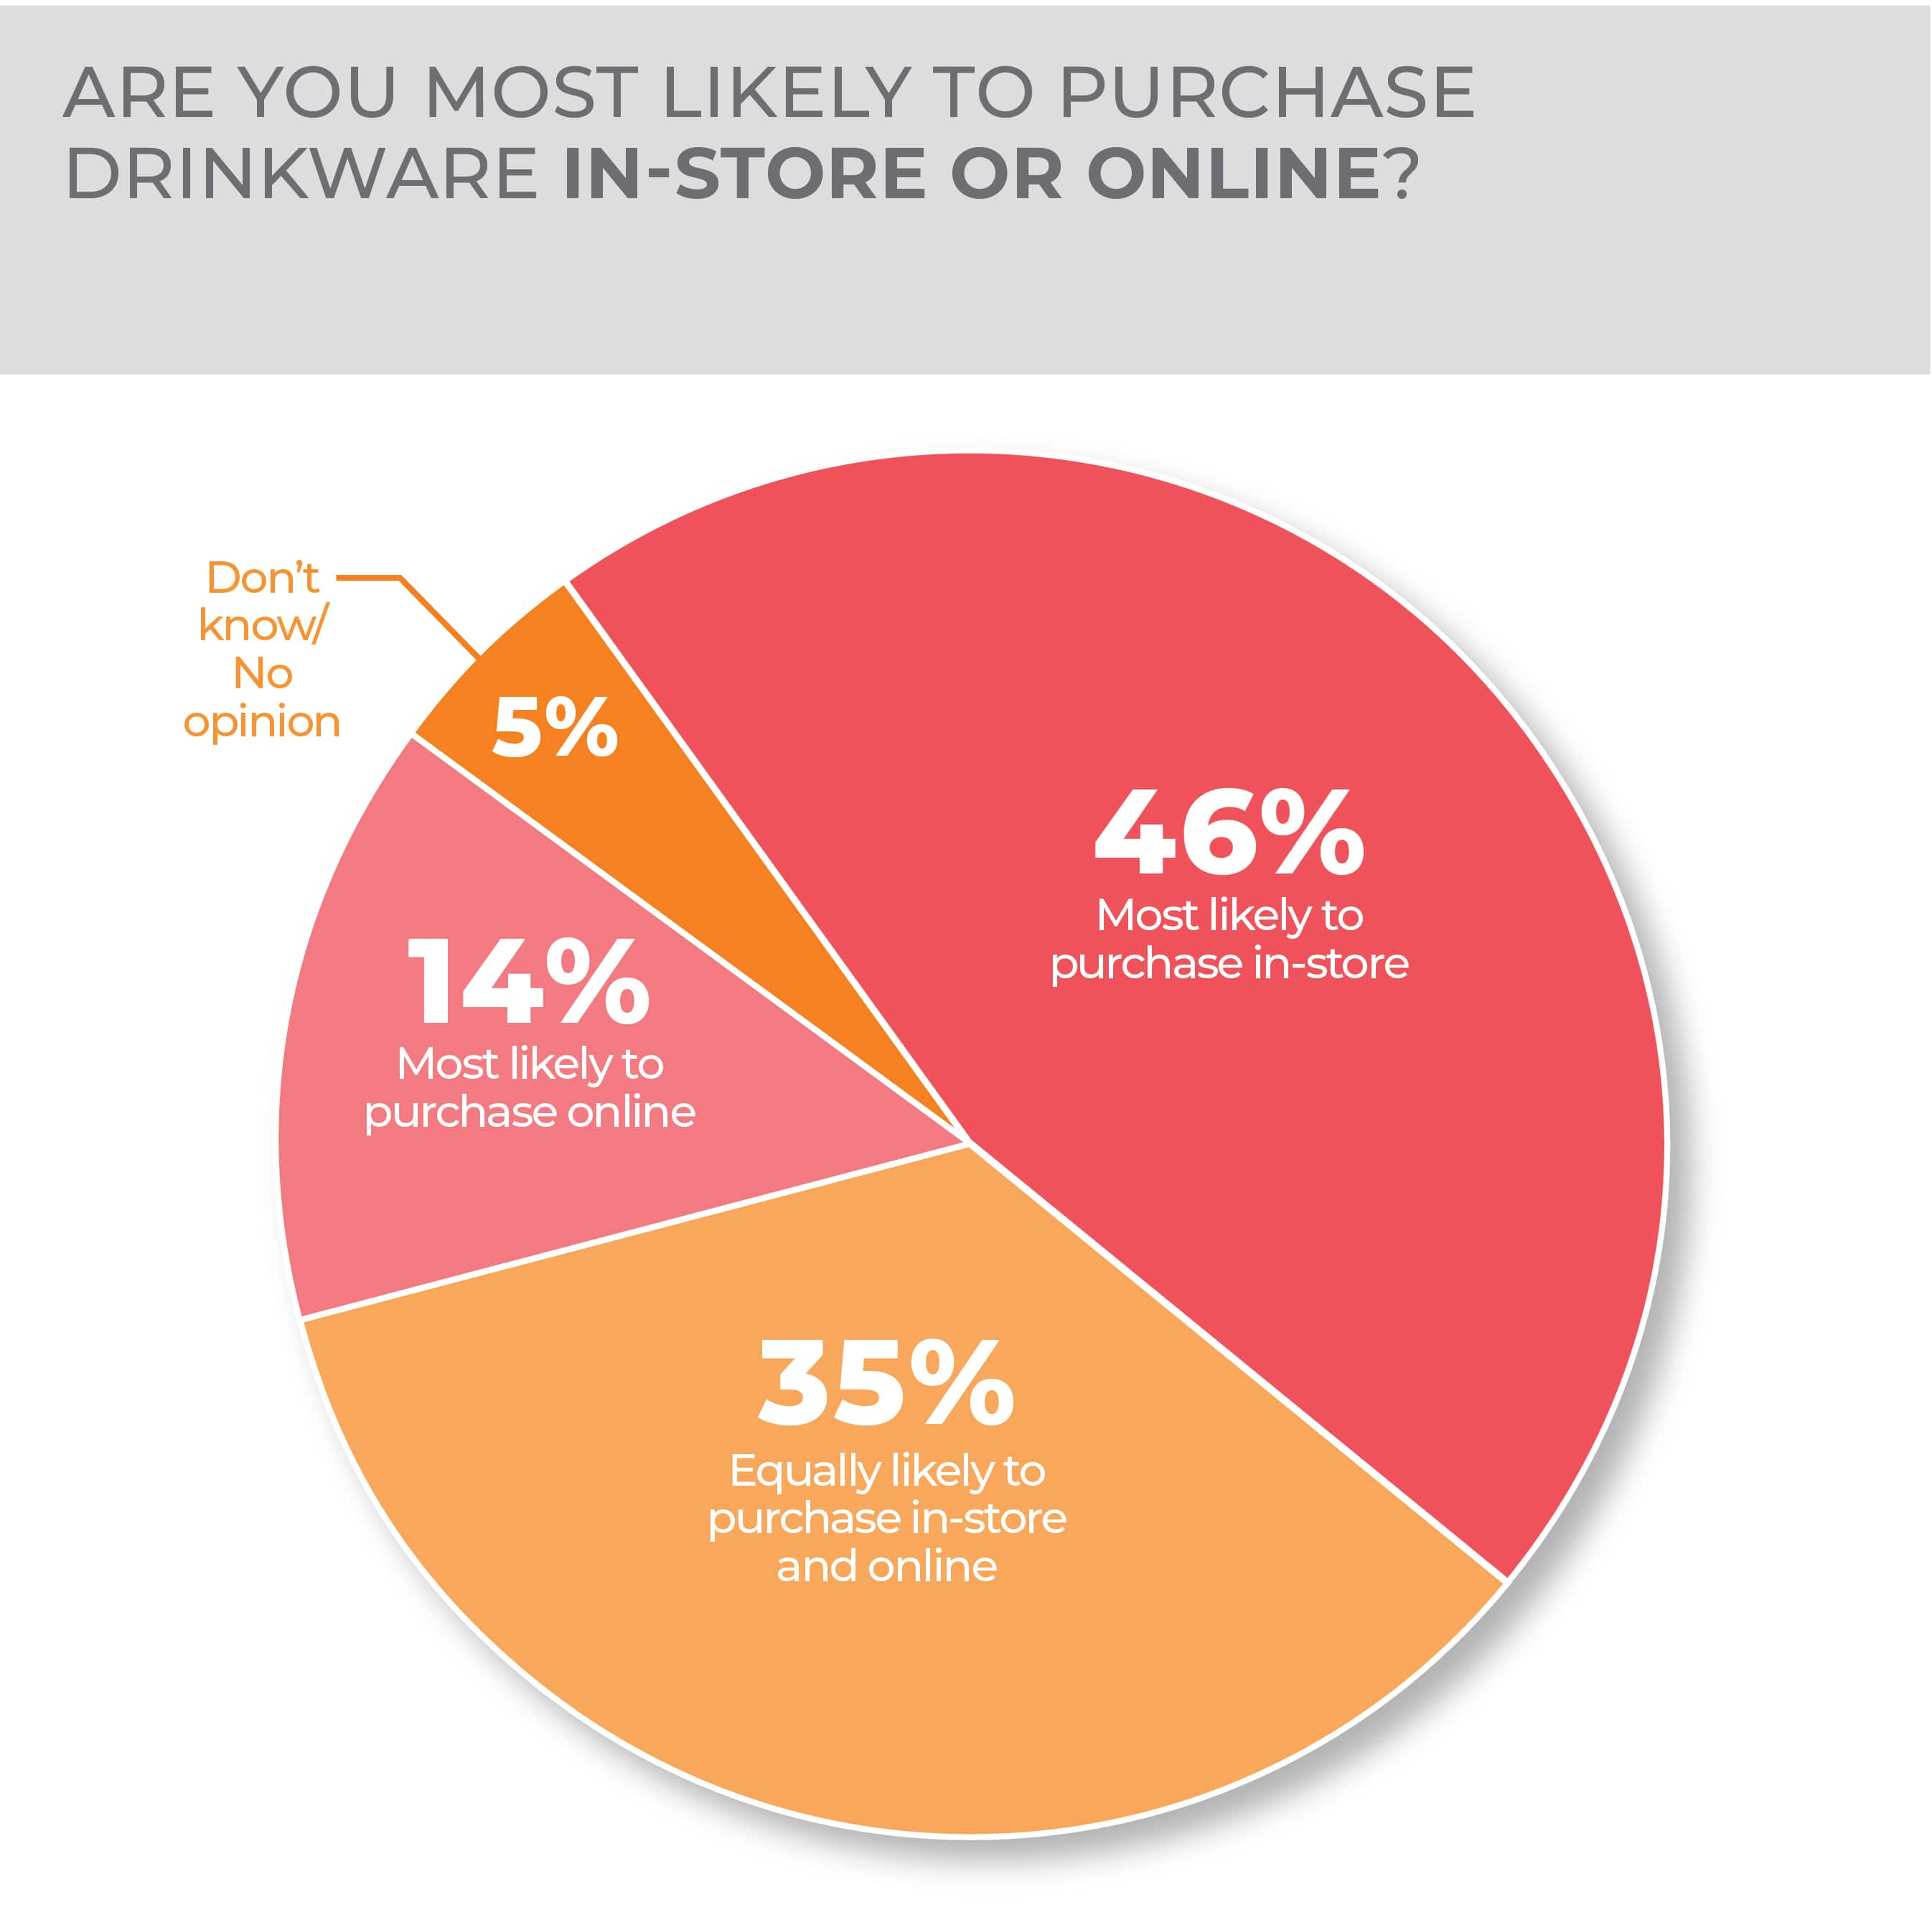
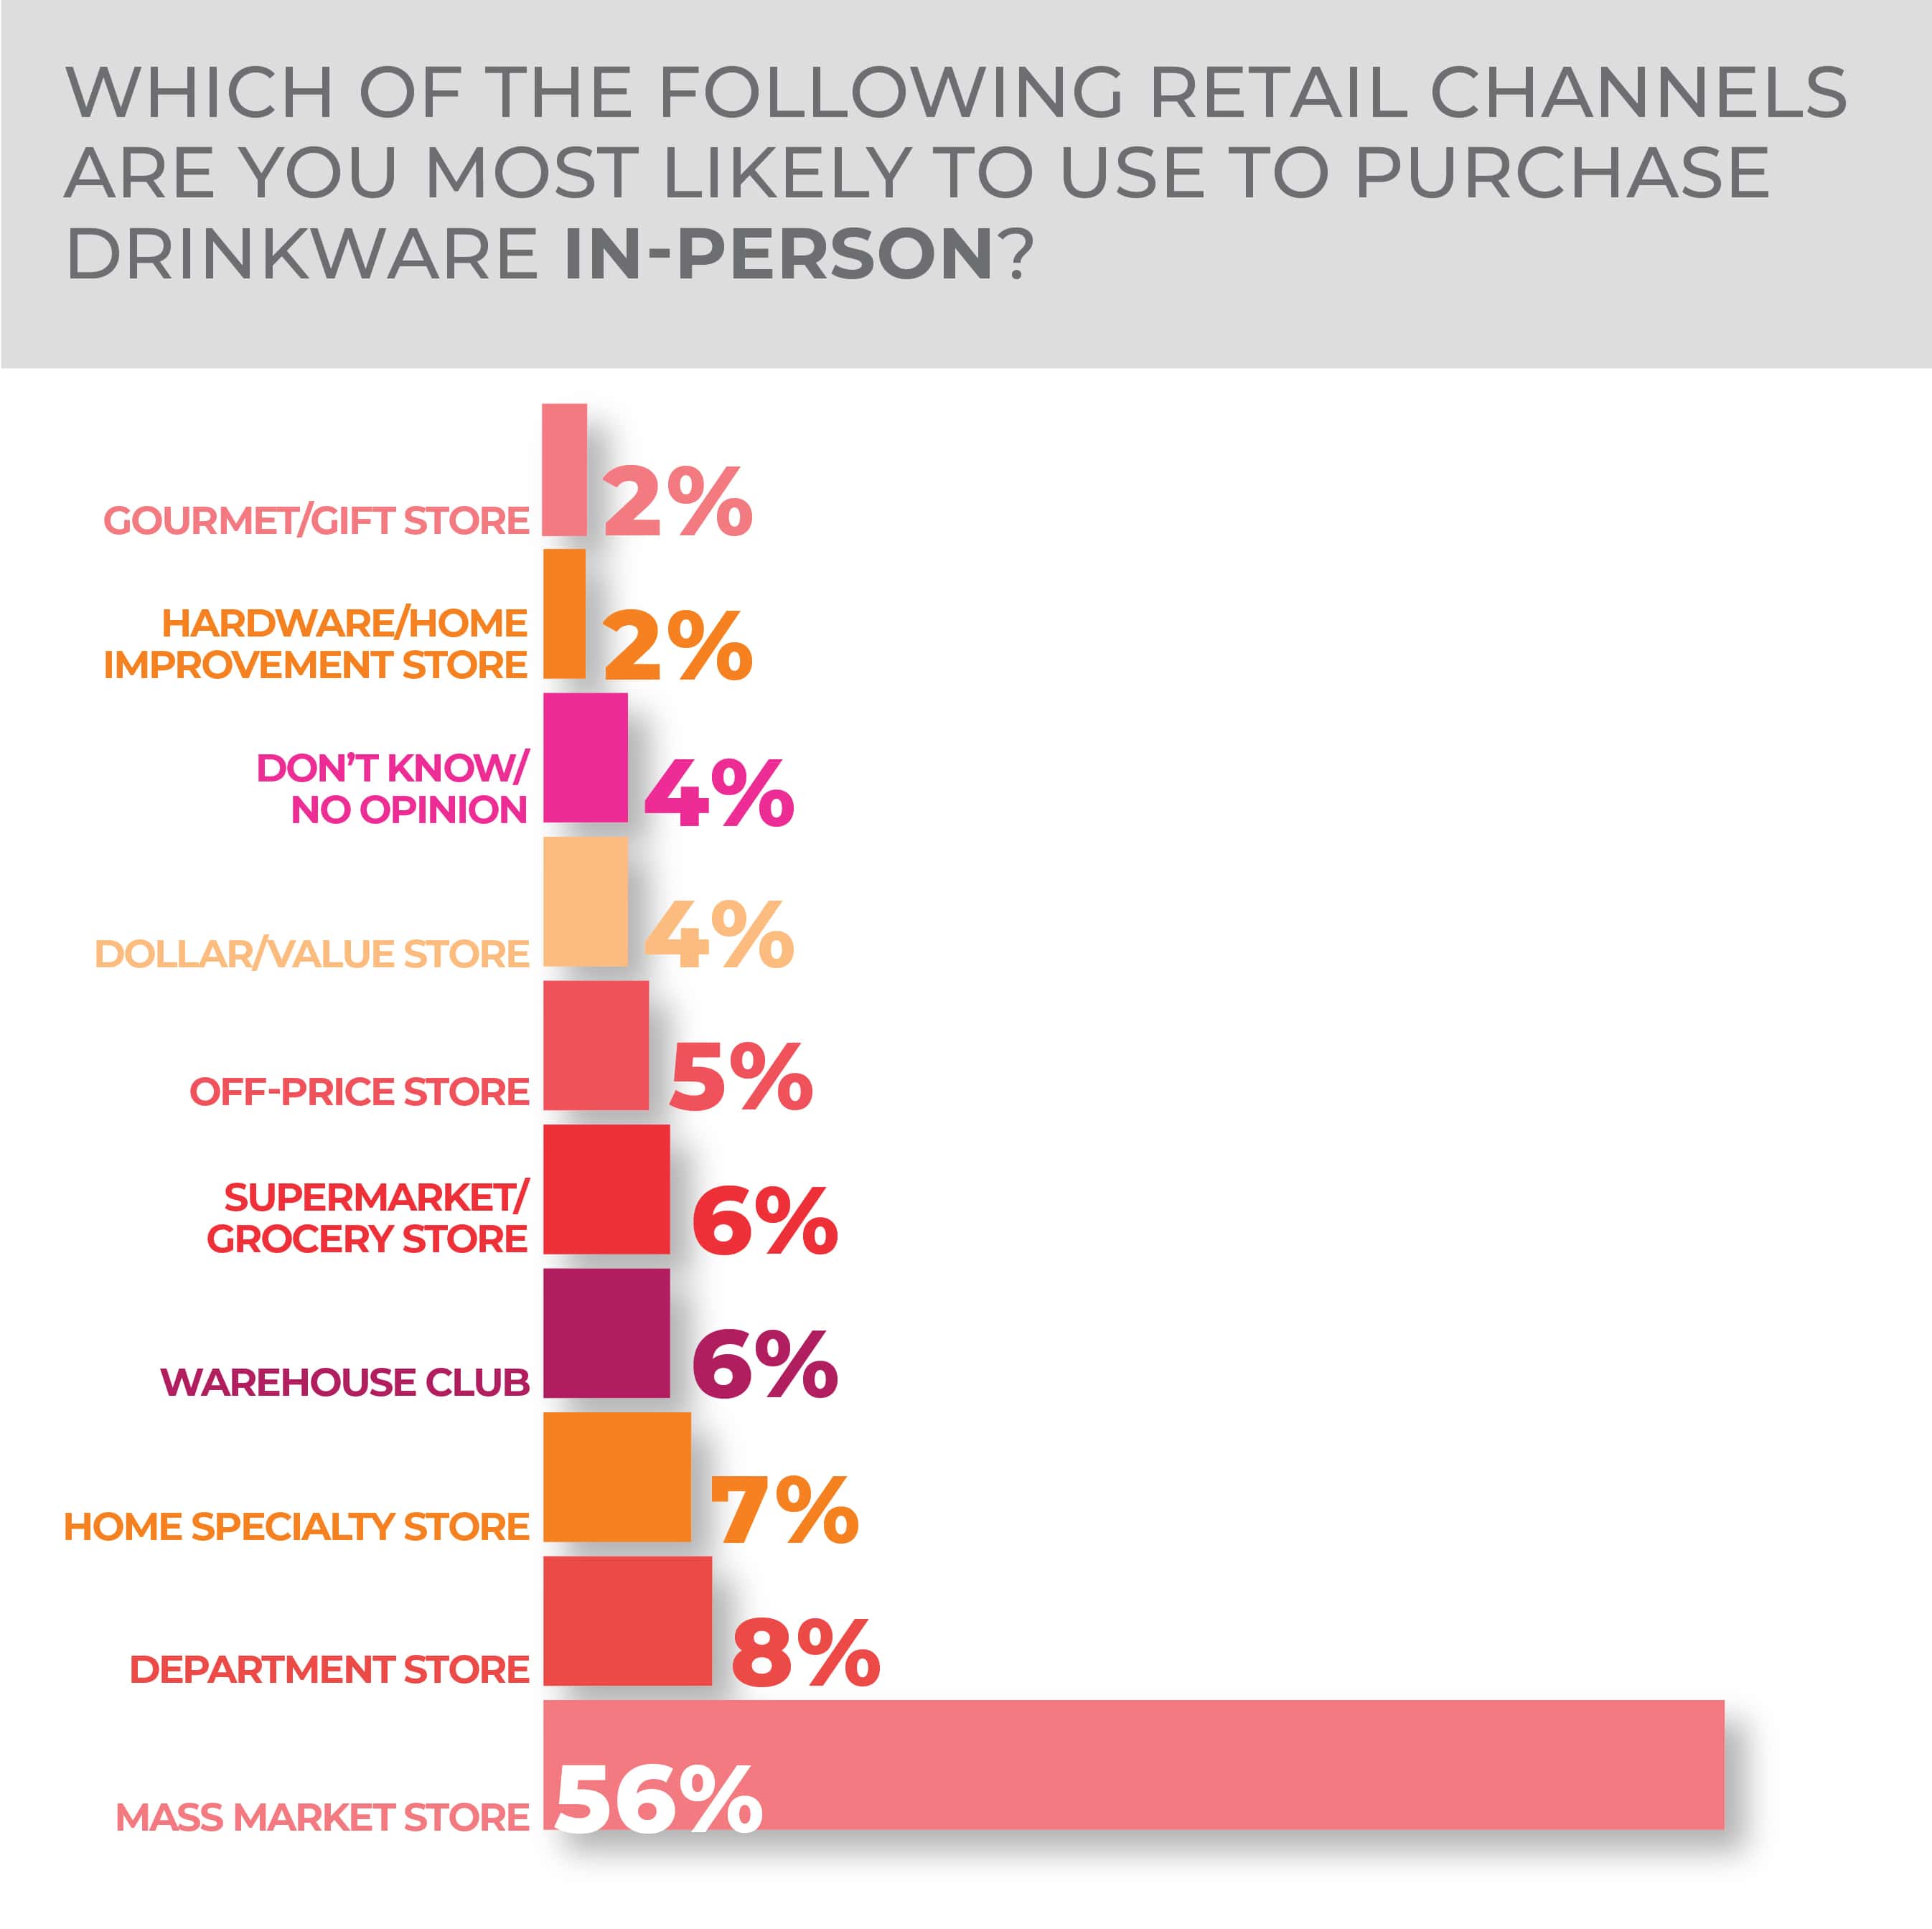
Asked directly, consumers said they were most likely to purchase in-store, followed by equally likely to purchase in-store and online. When asked how they researched or purchased drinkware online, 23% said they would research the product online but would purchase the product in store.
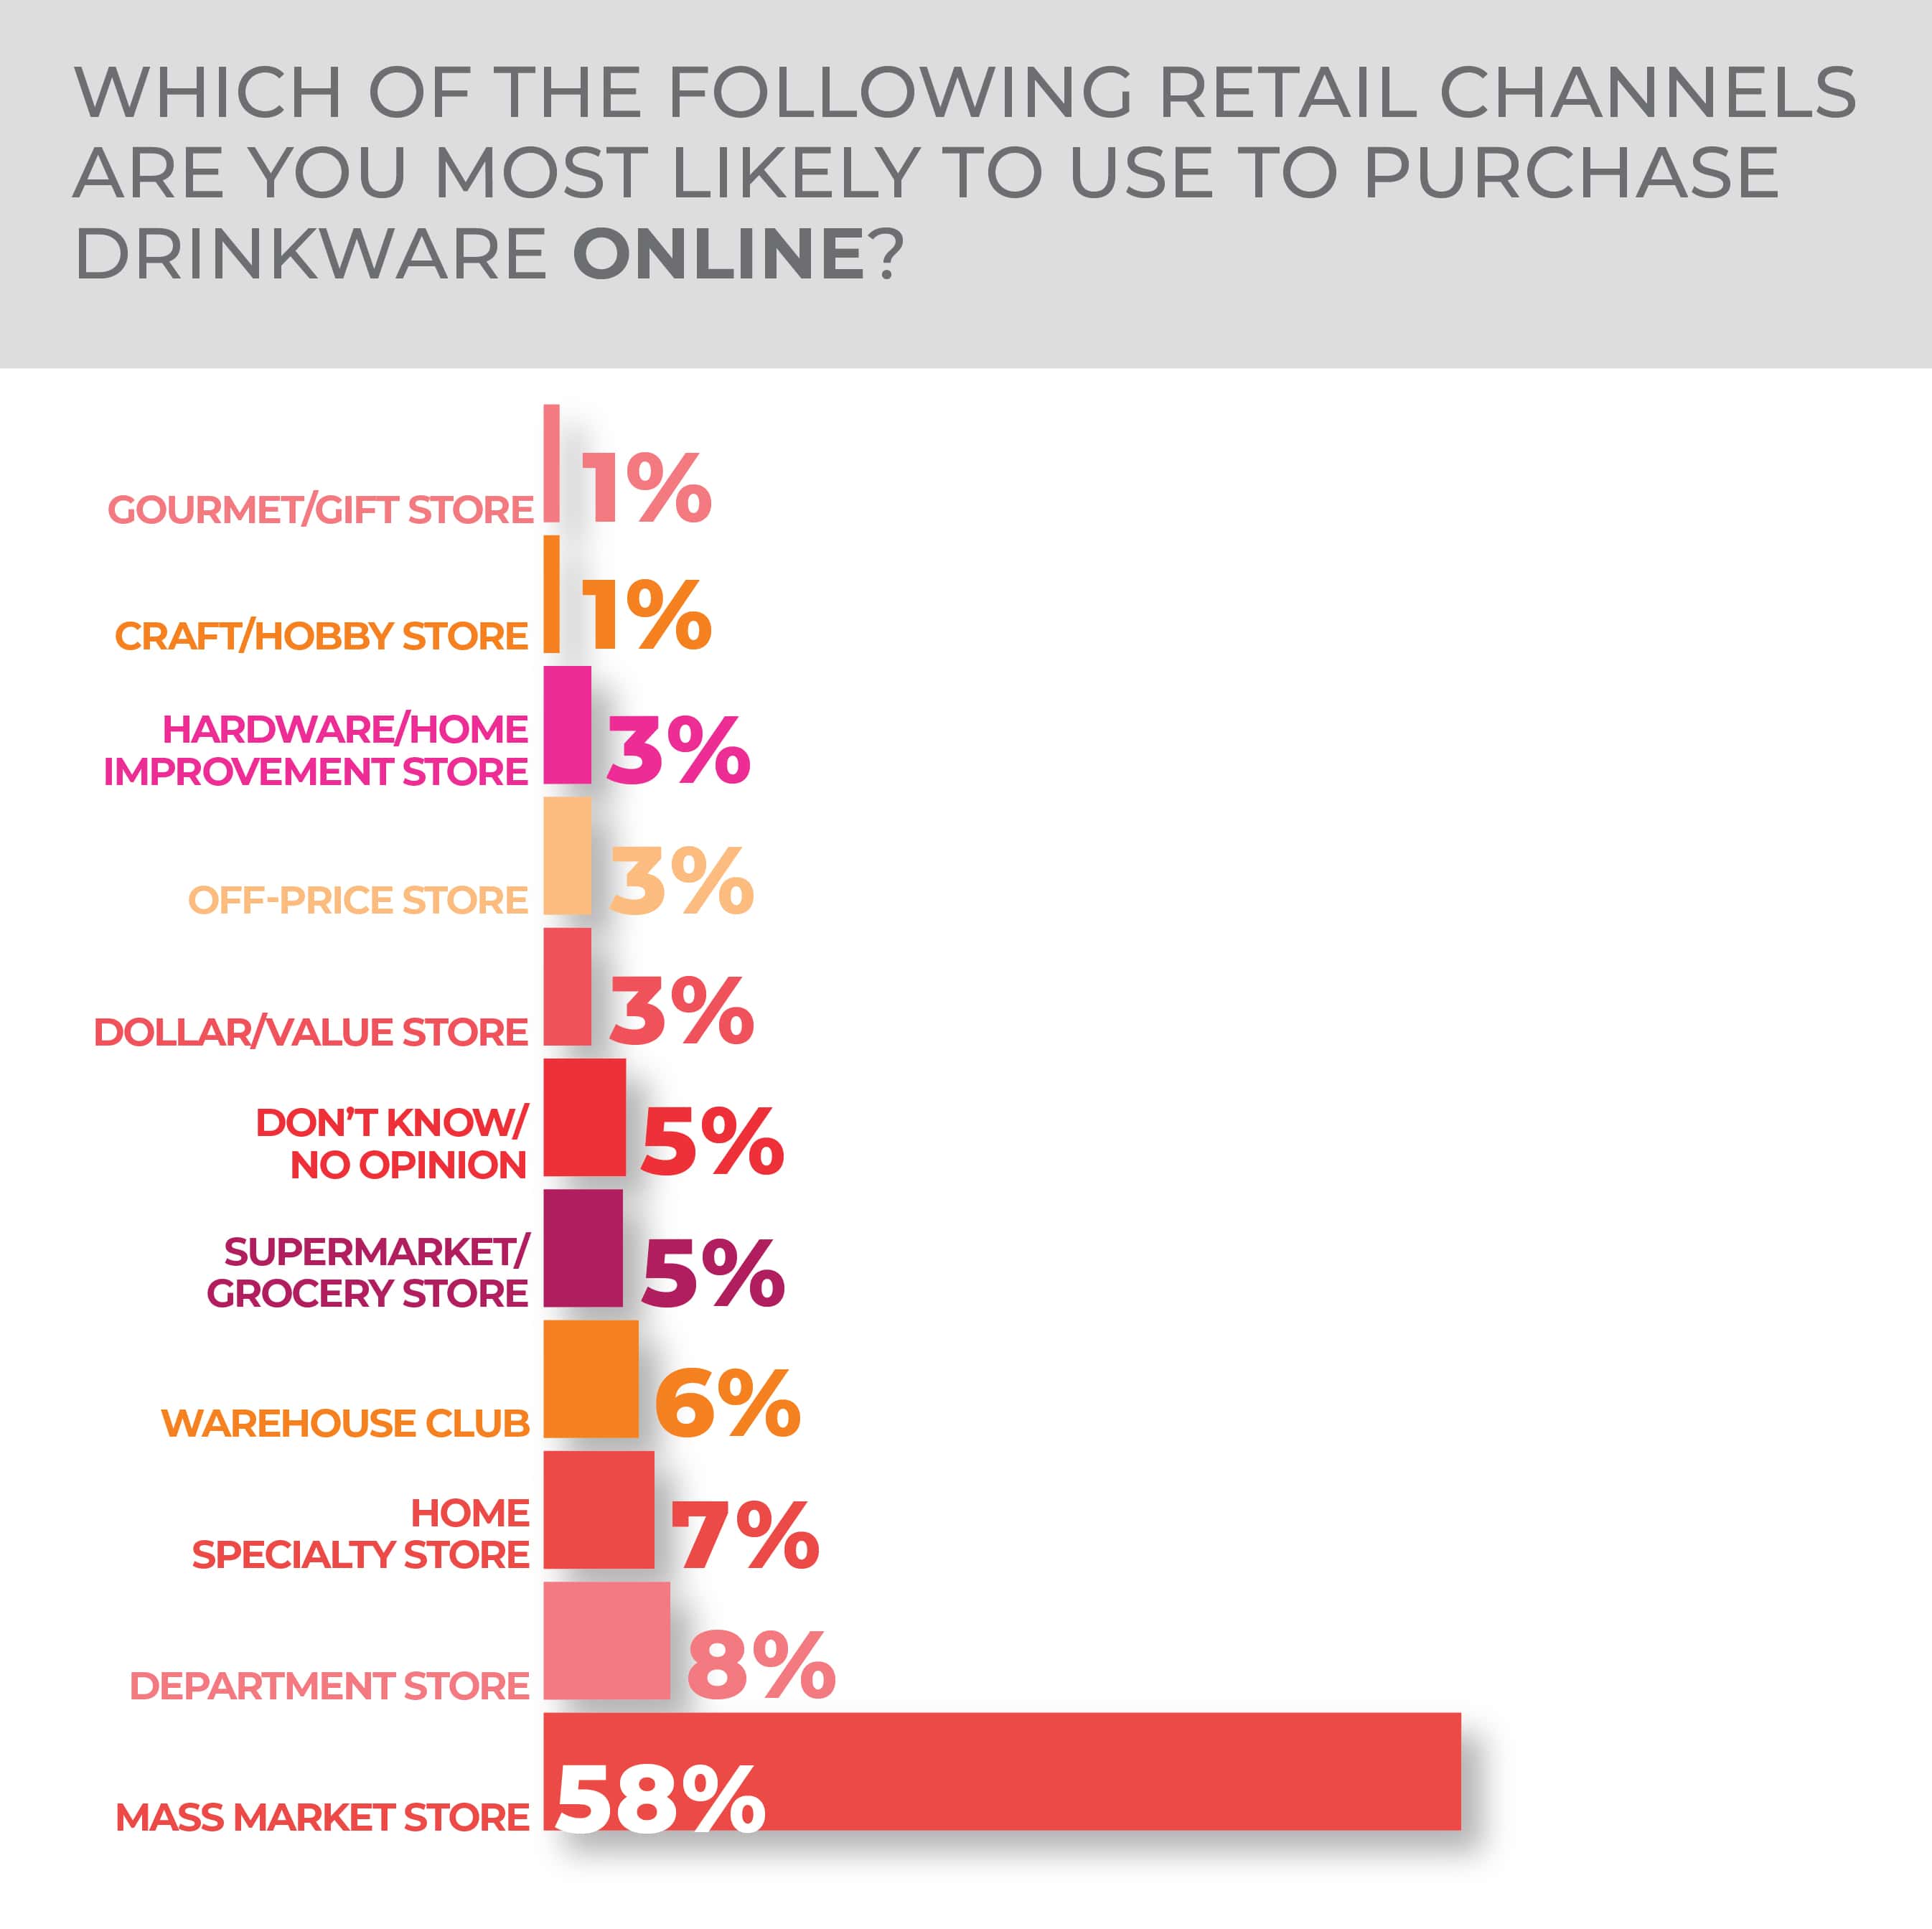
Mass market stores were the most popular retail channel to purchase drinkware both in-person and online, each selected by more than 50%. No other channel choice was above 8%.
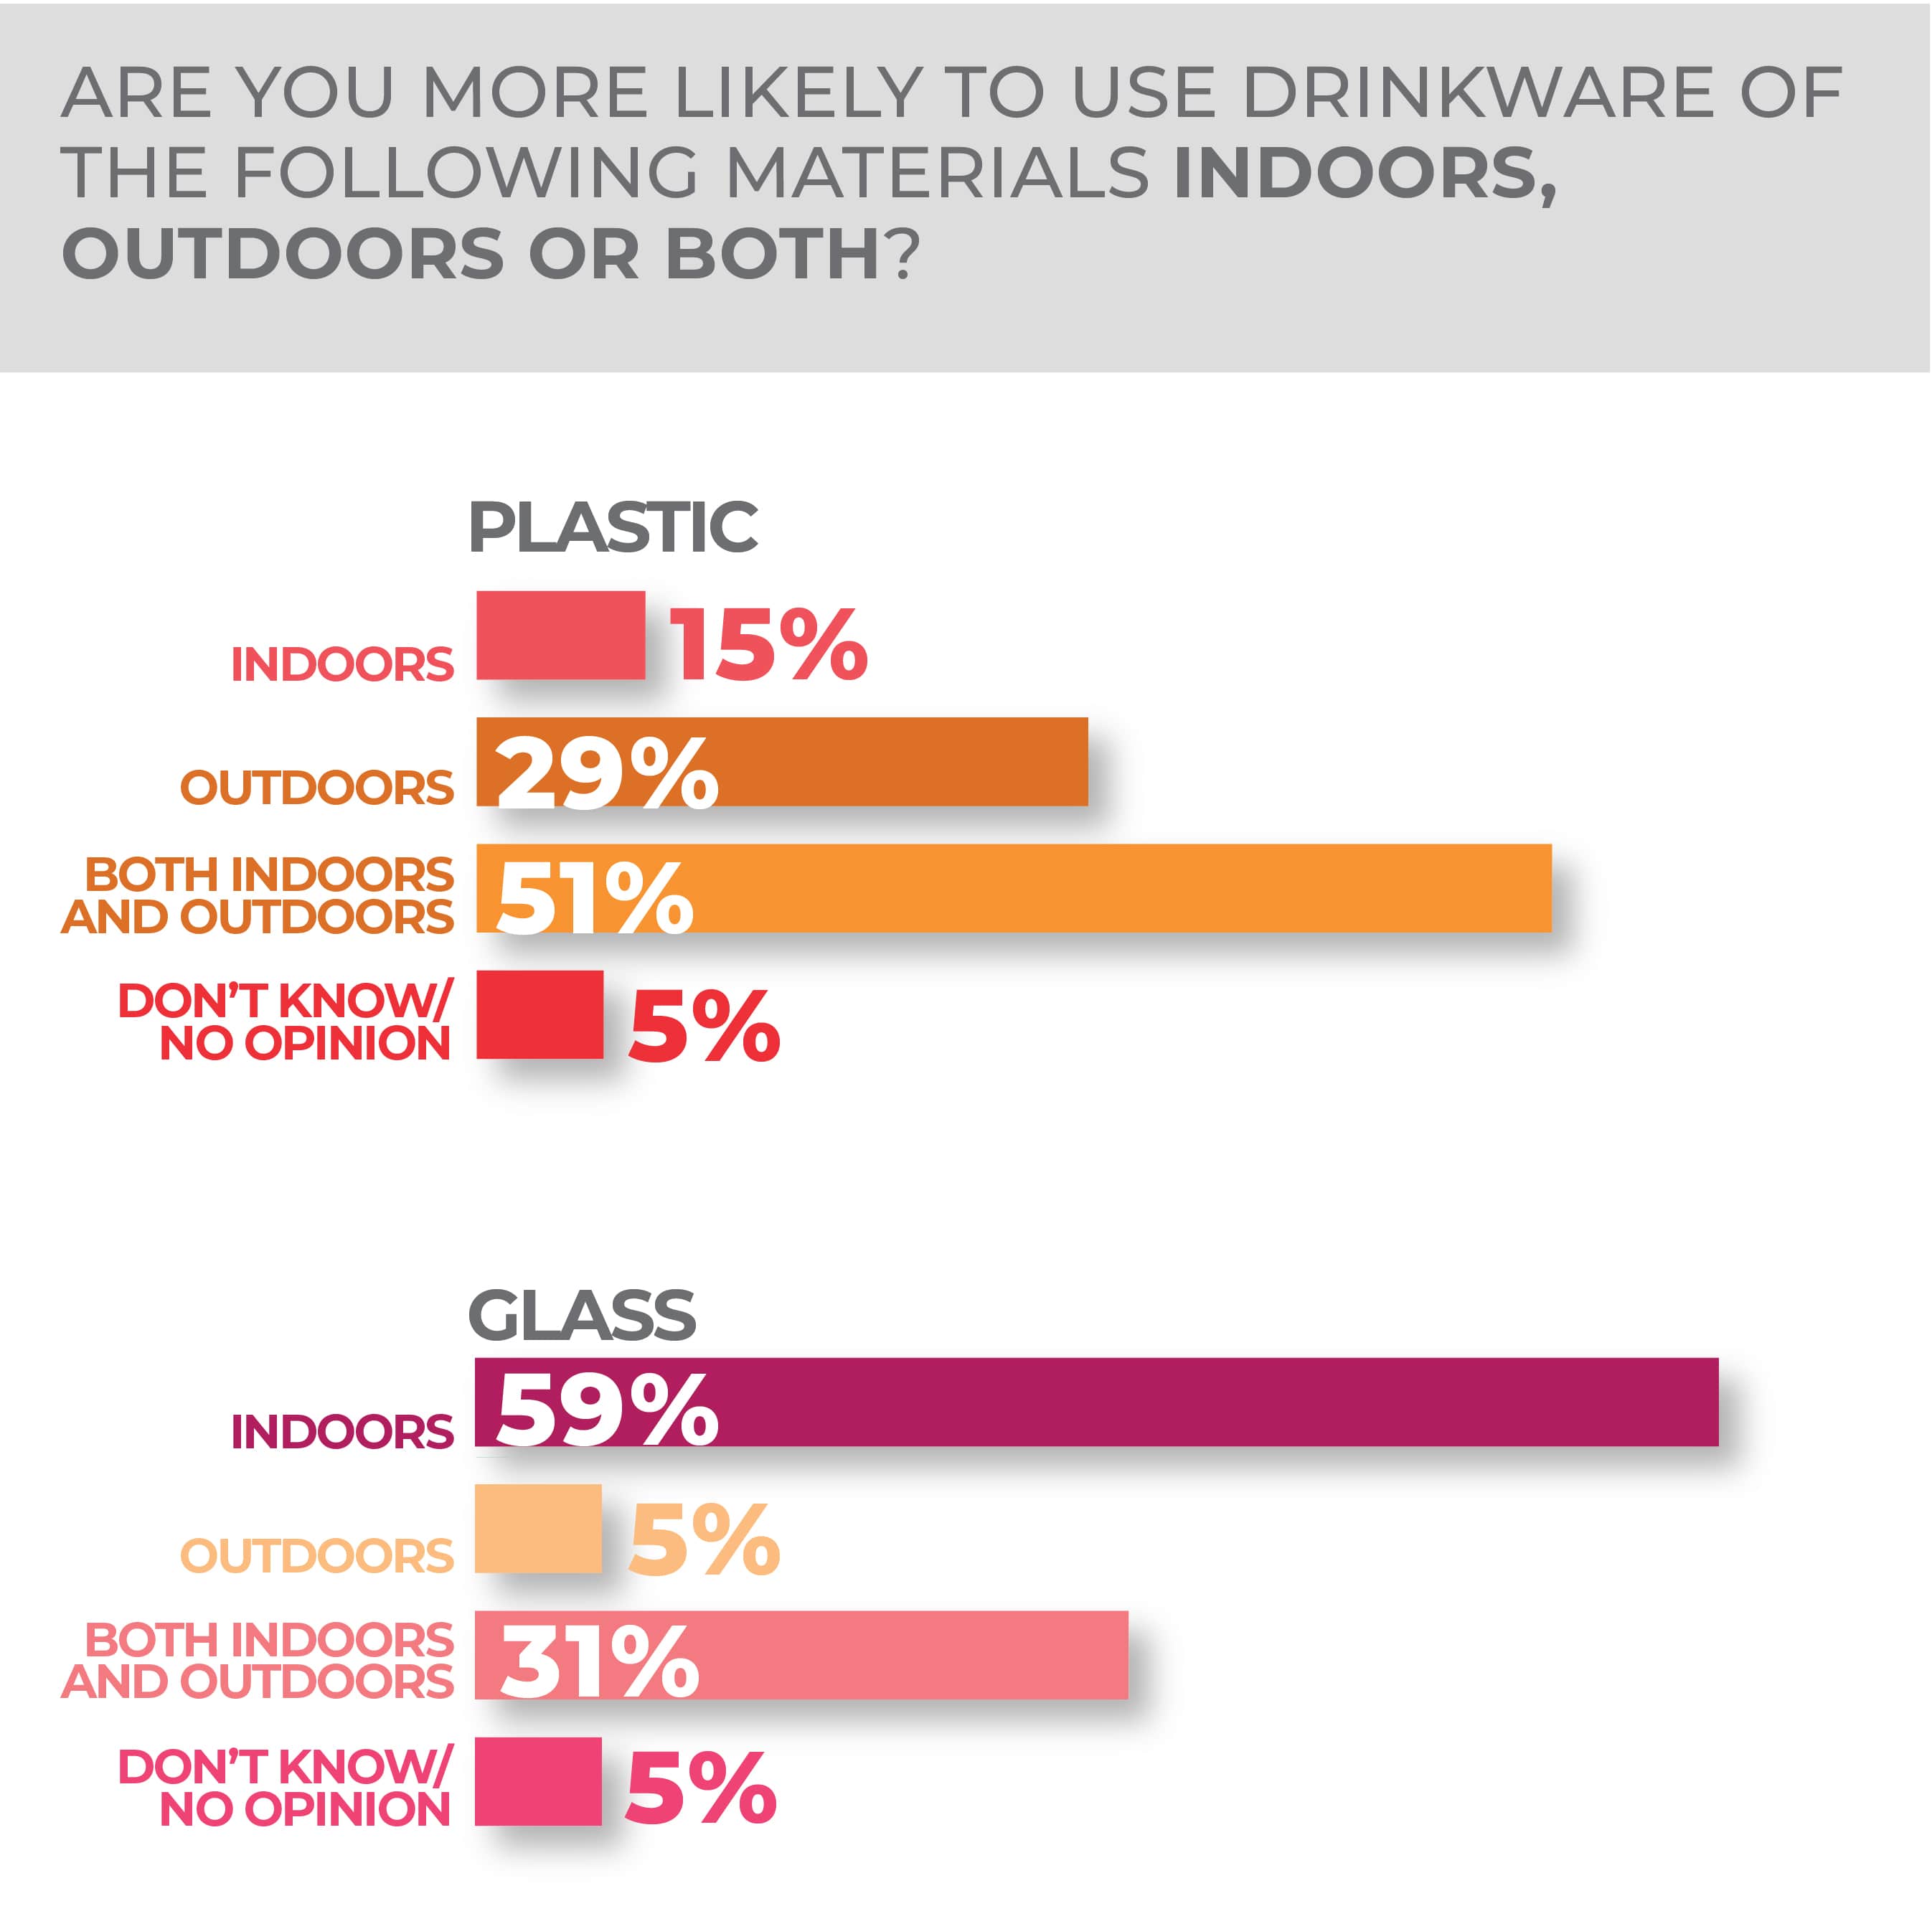
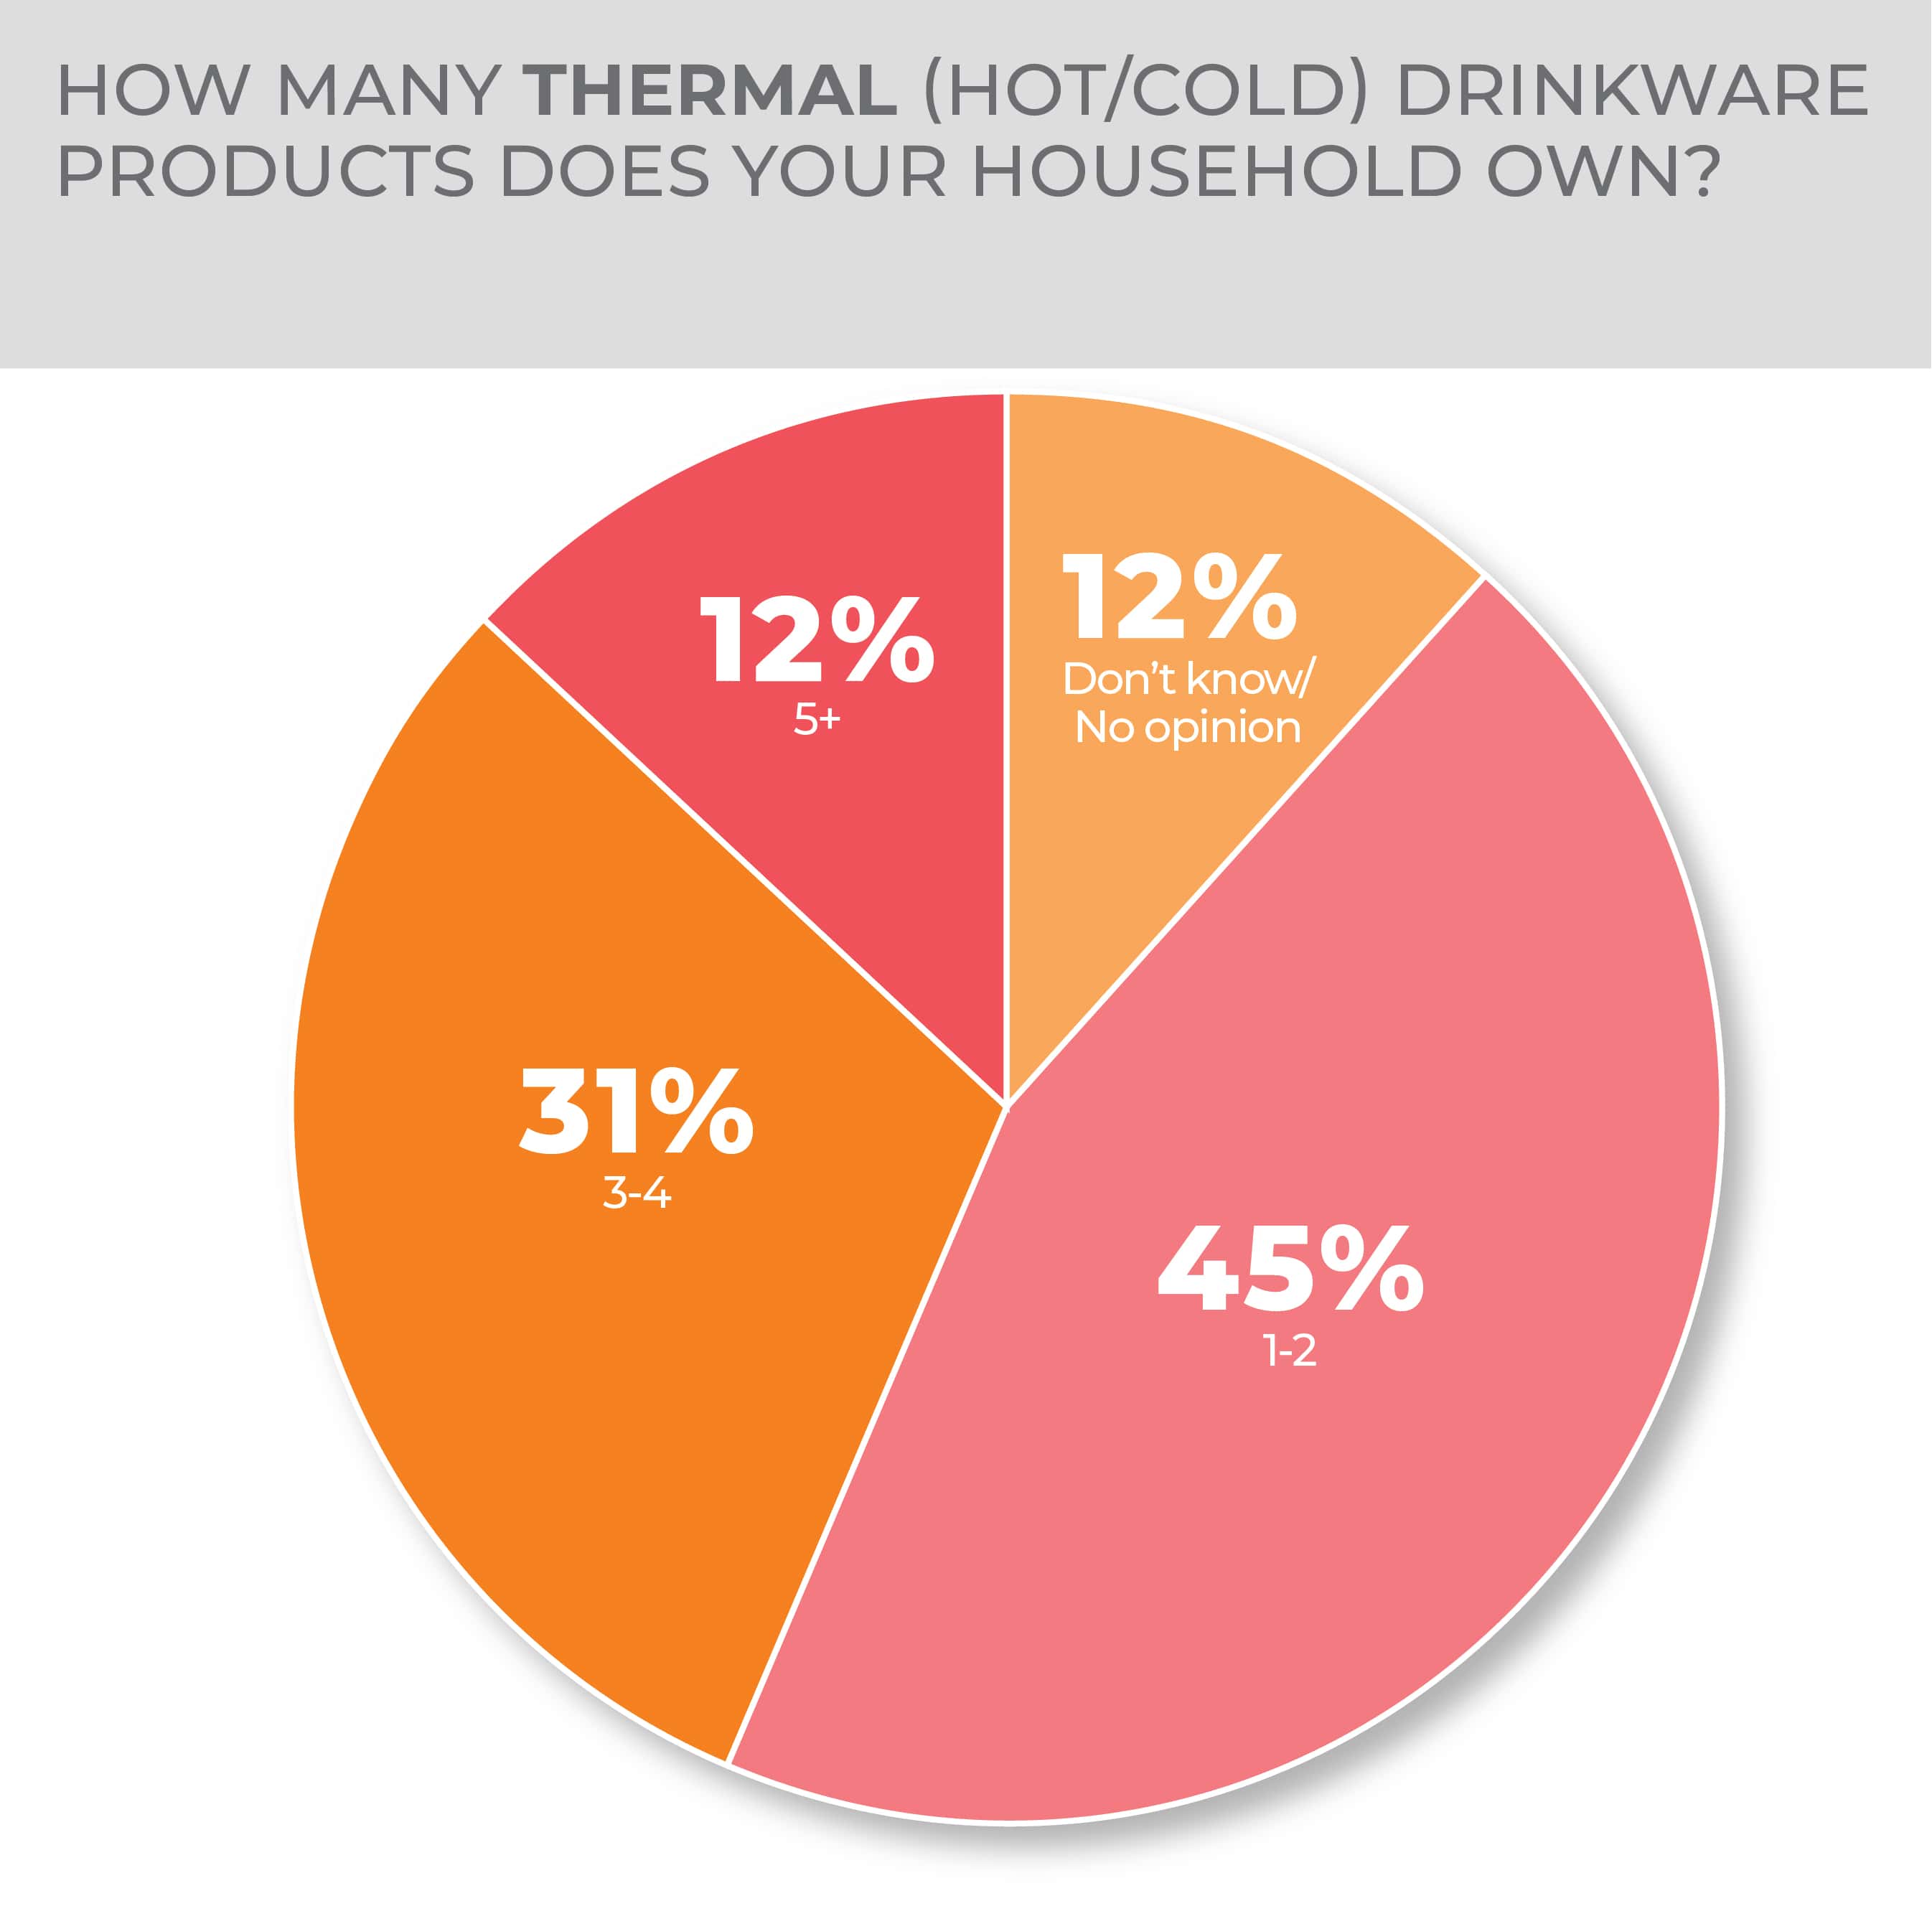
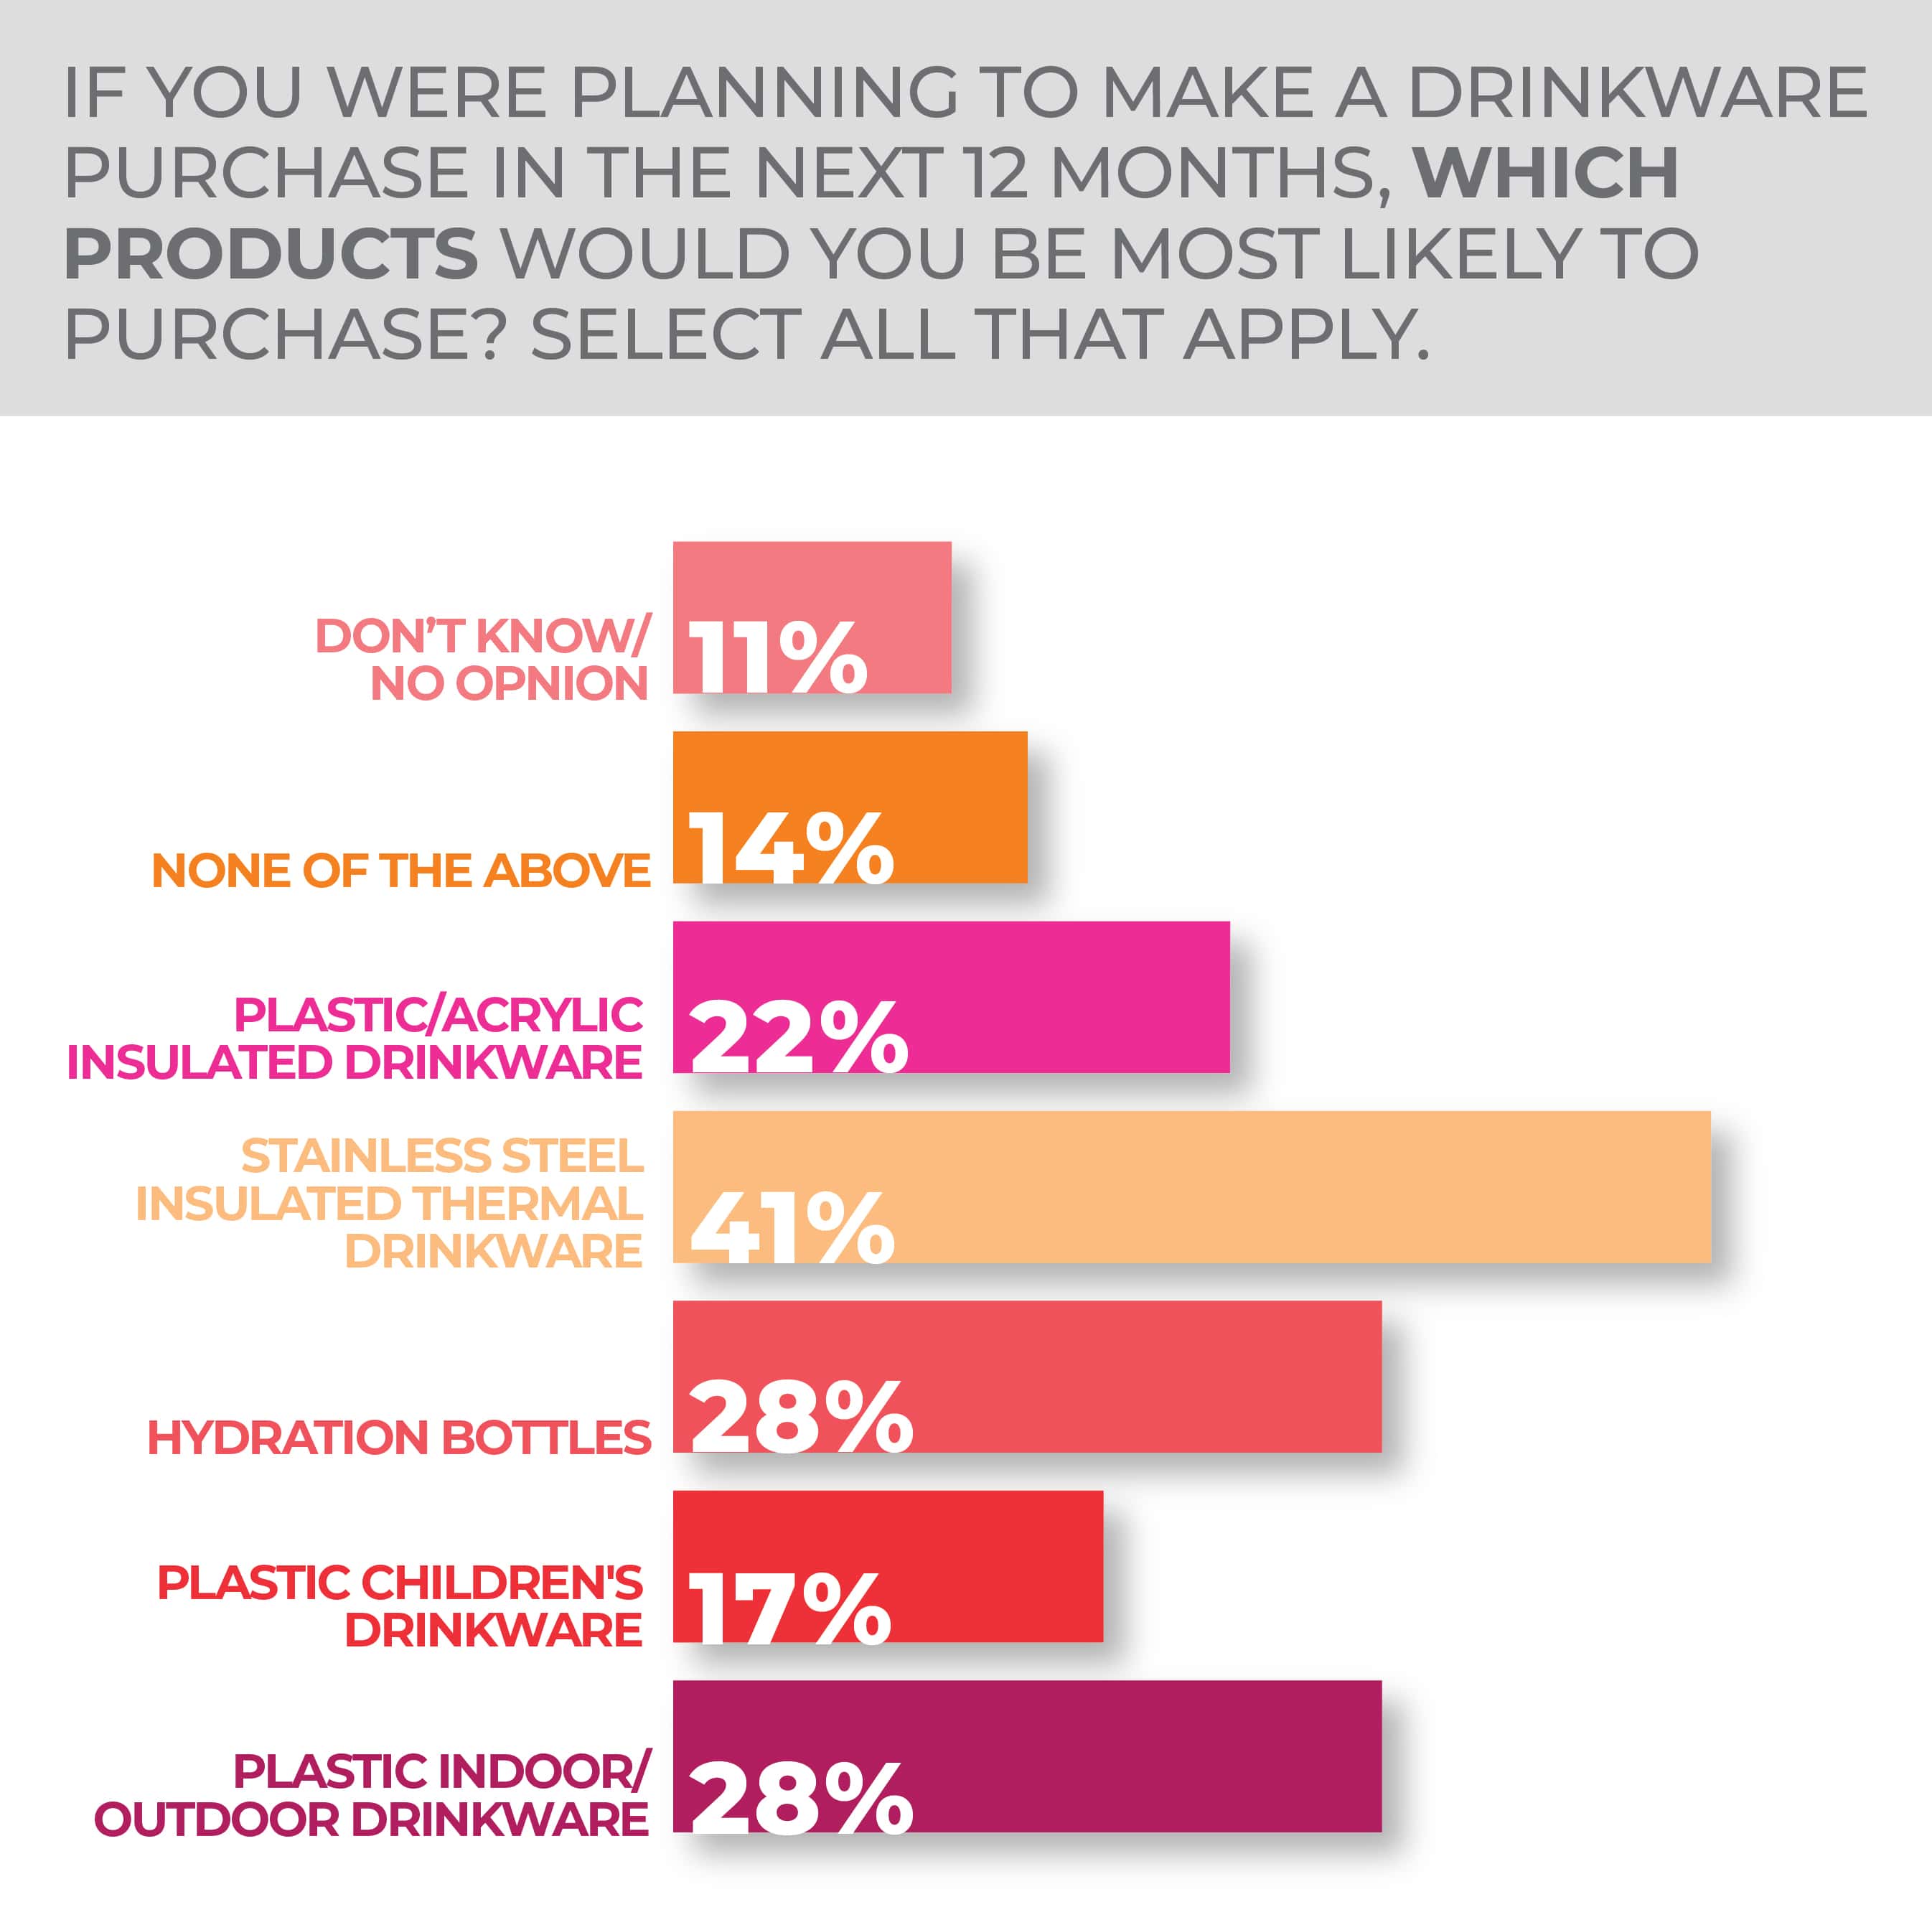
Consumers planning to make a drinkware purchase in the next 12 months were most likely to choose stainless steel insulated thermal (hot/cold) drinkware at 41%, followed by plastic/acrylic insulated drinkware and plastic indoor/outdoor drinkware tied at 28%.
Generationally, Gen Zers were most likely to make a drinkware purchase, followed closely by Millennials.
Respondents to the survey expect a lot from their drinkware with five attributes of portable drinkware they consider important coming in over 50%.
Generationally, Gen Zers are most likely to make a drinkware purchase followed closely by Millennials one point down.
More Drinkware Findings:
Flatware
The flatware business got a lift from the steep increase in at-home dining frequency during the pandemic. Now, the category might be primed for new growth opportunities from an increase in at-home entertaining, gift giving and self-purchasing fueled by a full-fledged return of key life moment celebrations.
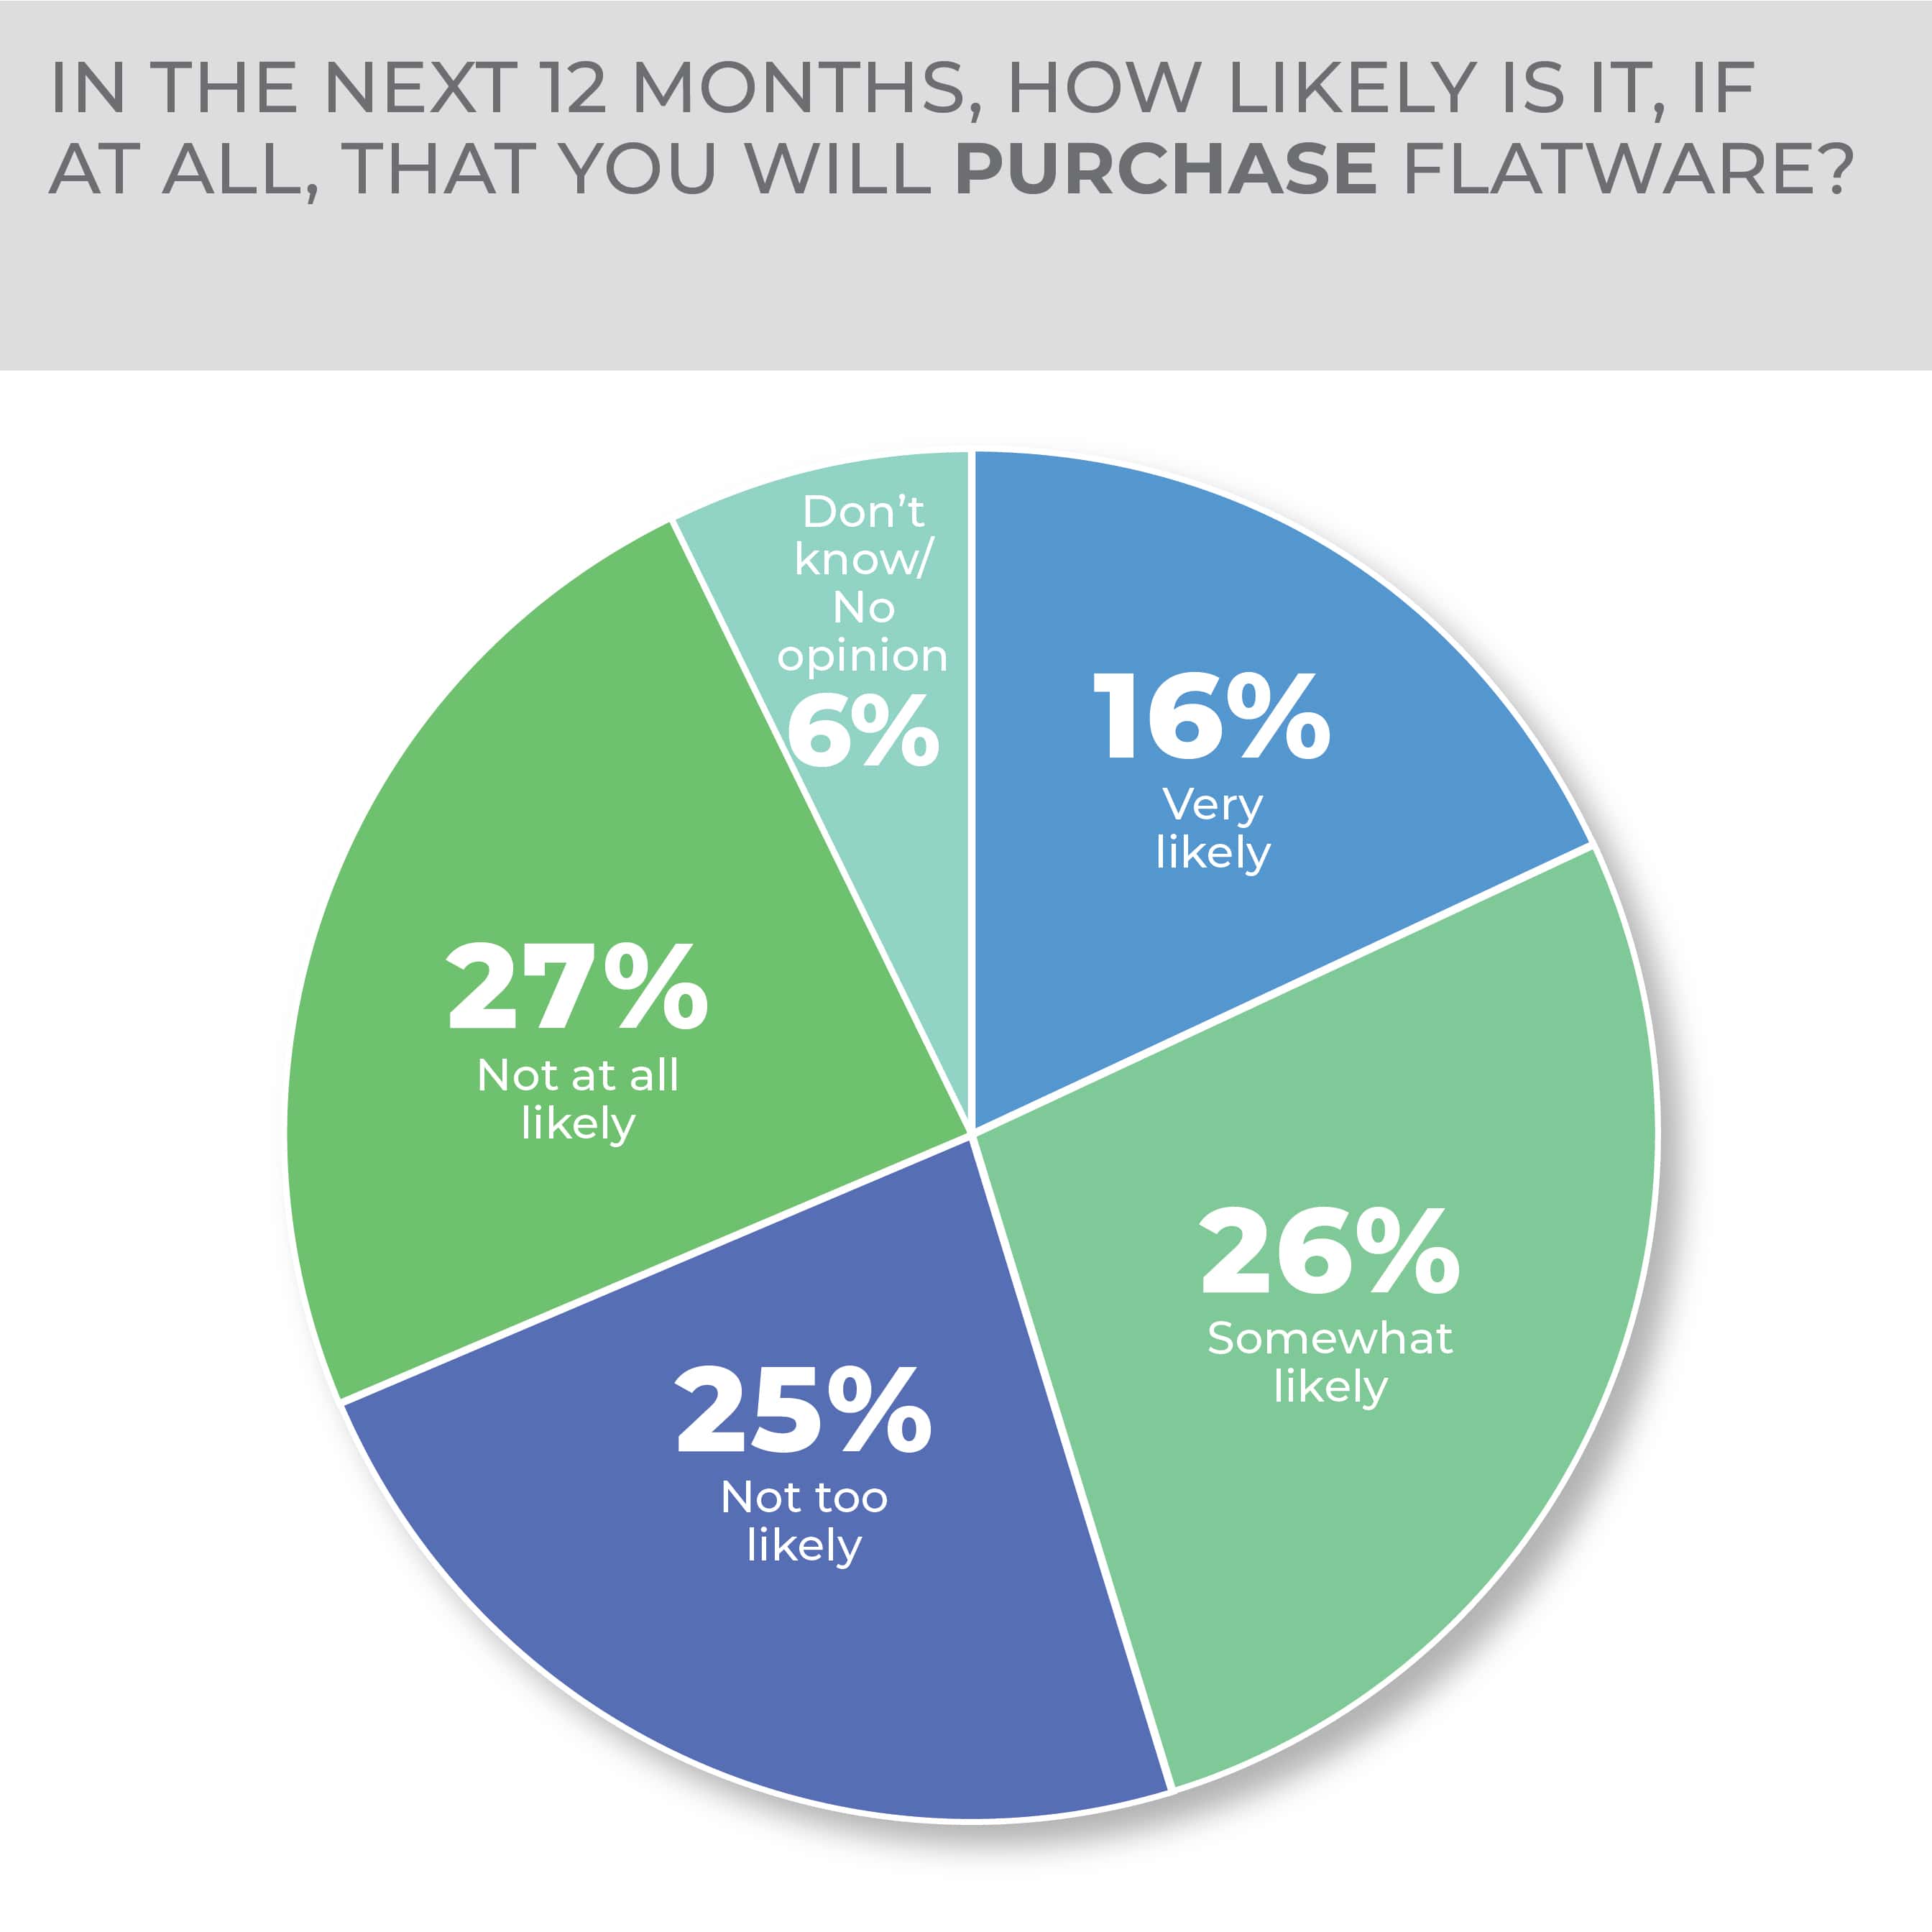
According to the HomePage News 2023 Consumer Outlook Survey, 40% of consumers surveyed are very or somewhat likely to buy flatware in the coming year, down a bit from the 2022 survey results but still at what the industry could view as a promising level. The strongest demand for flatware comes among younger consumer generations, many of whom likely are first-time buyers living on their own or starting new households. The category was selected by 57% of consumers 18 to 34 and 56% of consumers 35 to 44, compared to 19% aged 65 and older.
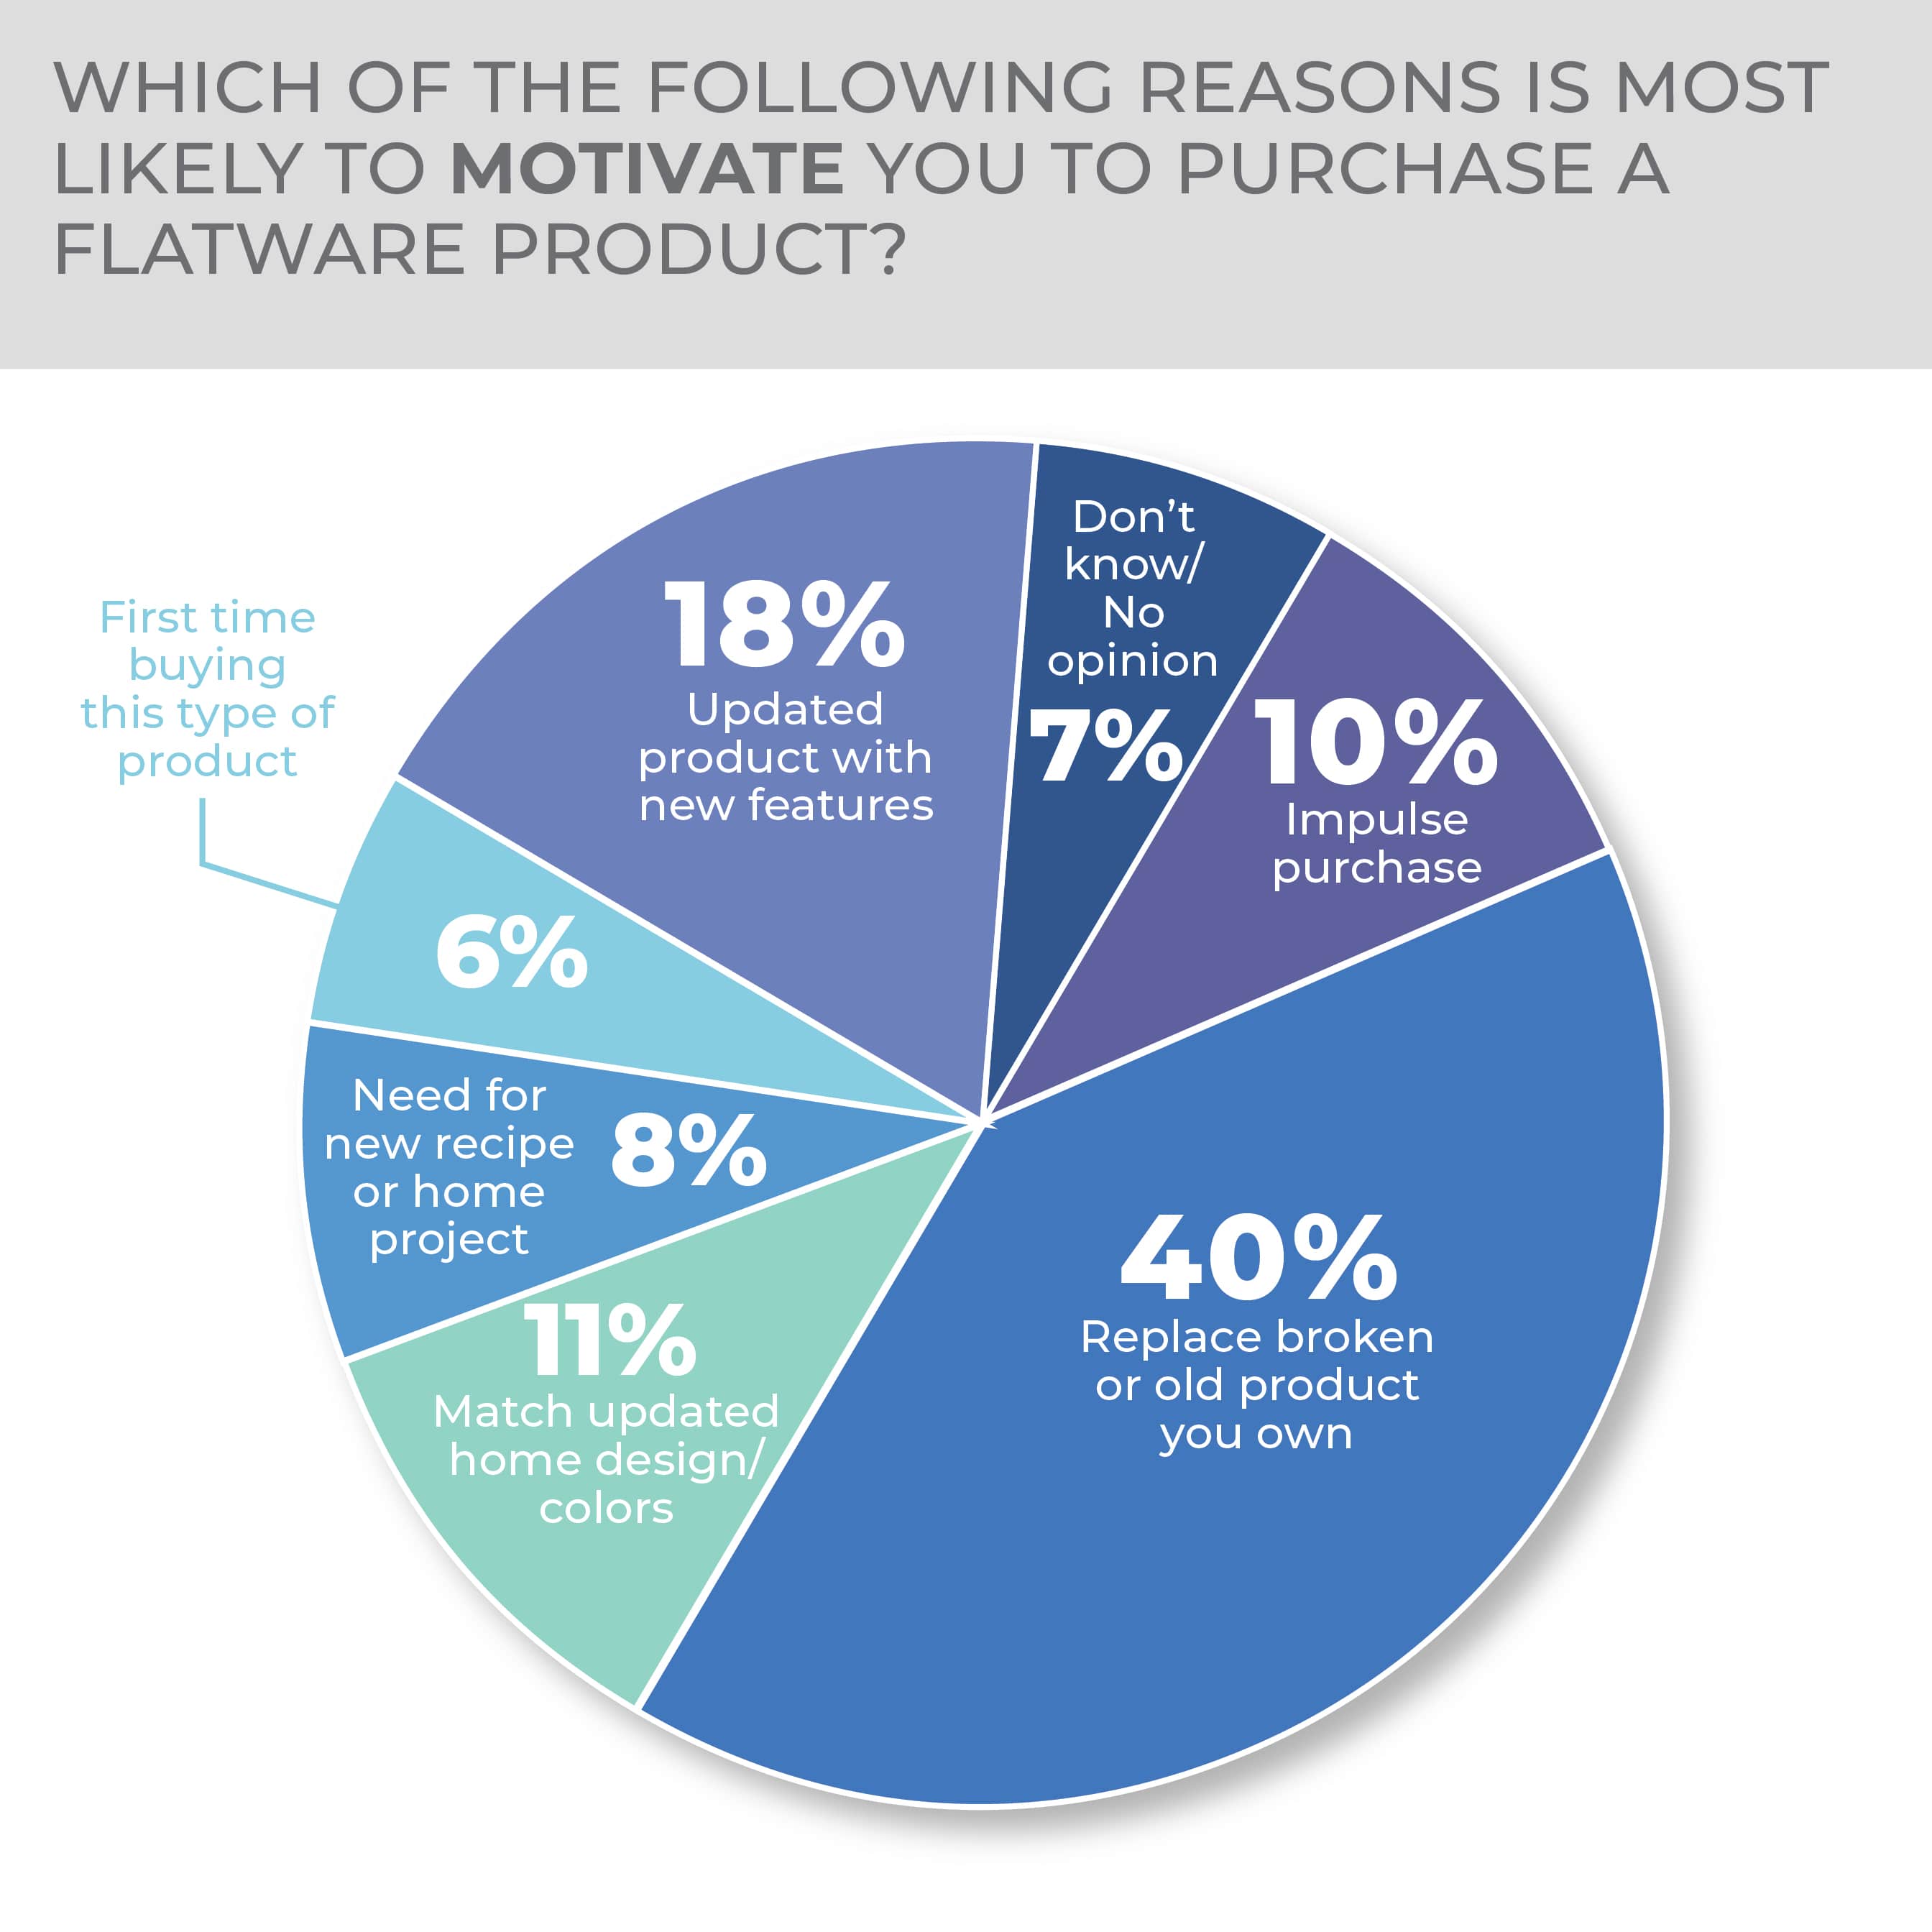
Flatware might also be in a position for a solid replacement market among consumers looking for a fresh, newly fashionable way to dine and decorate the everyday tabletop. Some 40% of respondents said they would buy new products to replace old items.
-
- The strongest demand for flatware comes among younger consumer generations, many of whom likely are first-time buyers living on their own or starting new households.
- The value of flatware styling endurance and versatility from everyday dining to casual entertaining could explain the predominant preference for classic/traditional patterns.
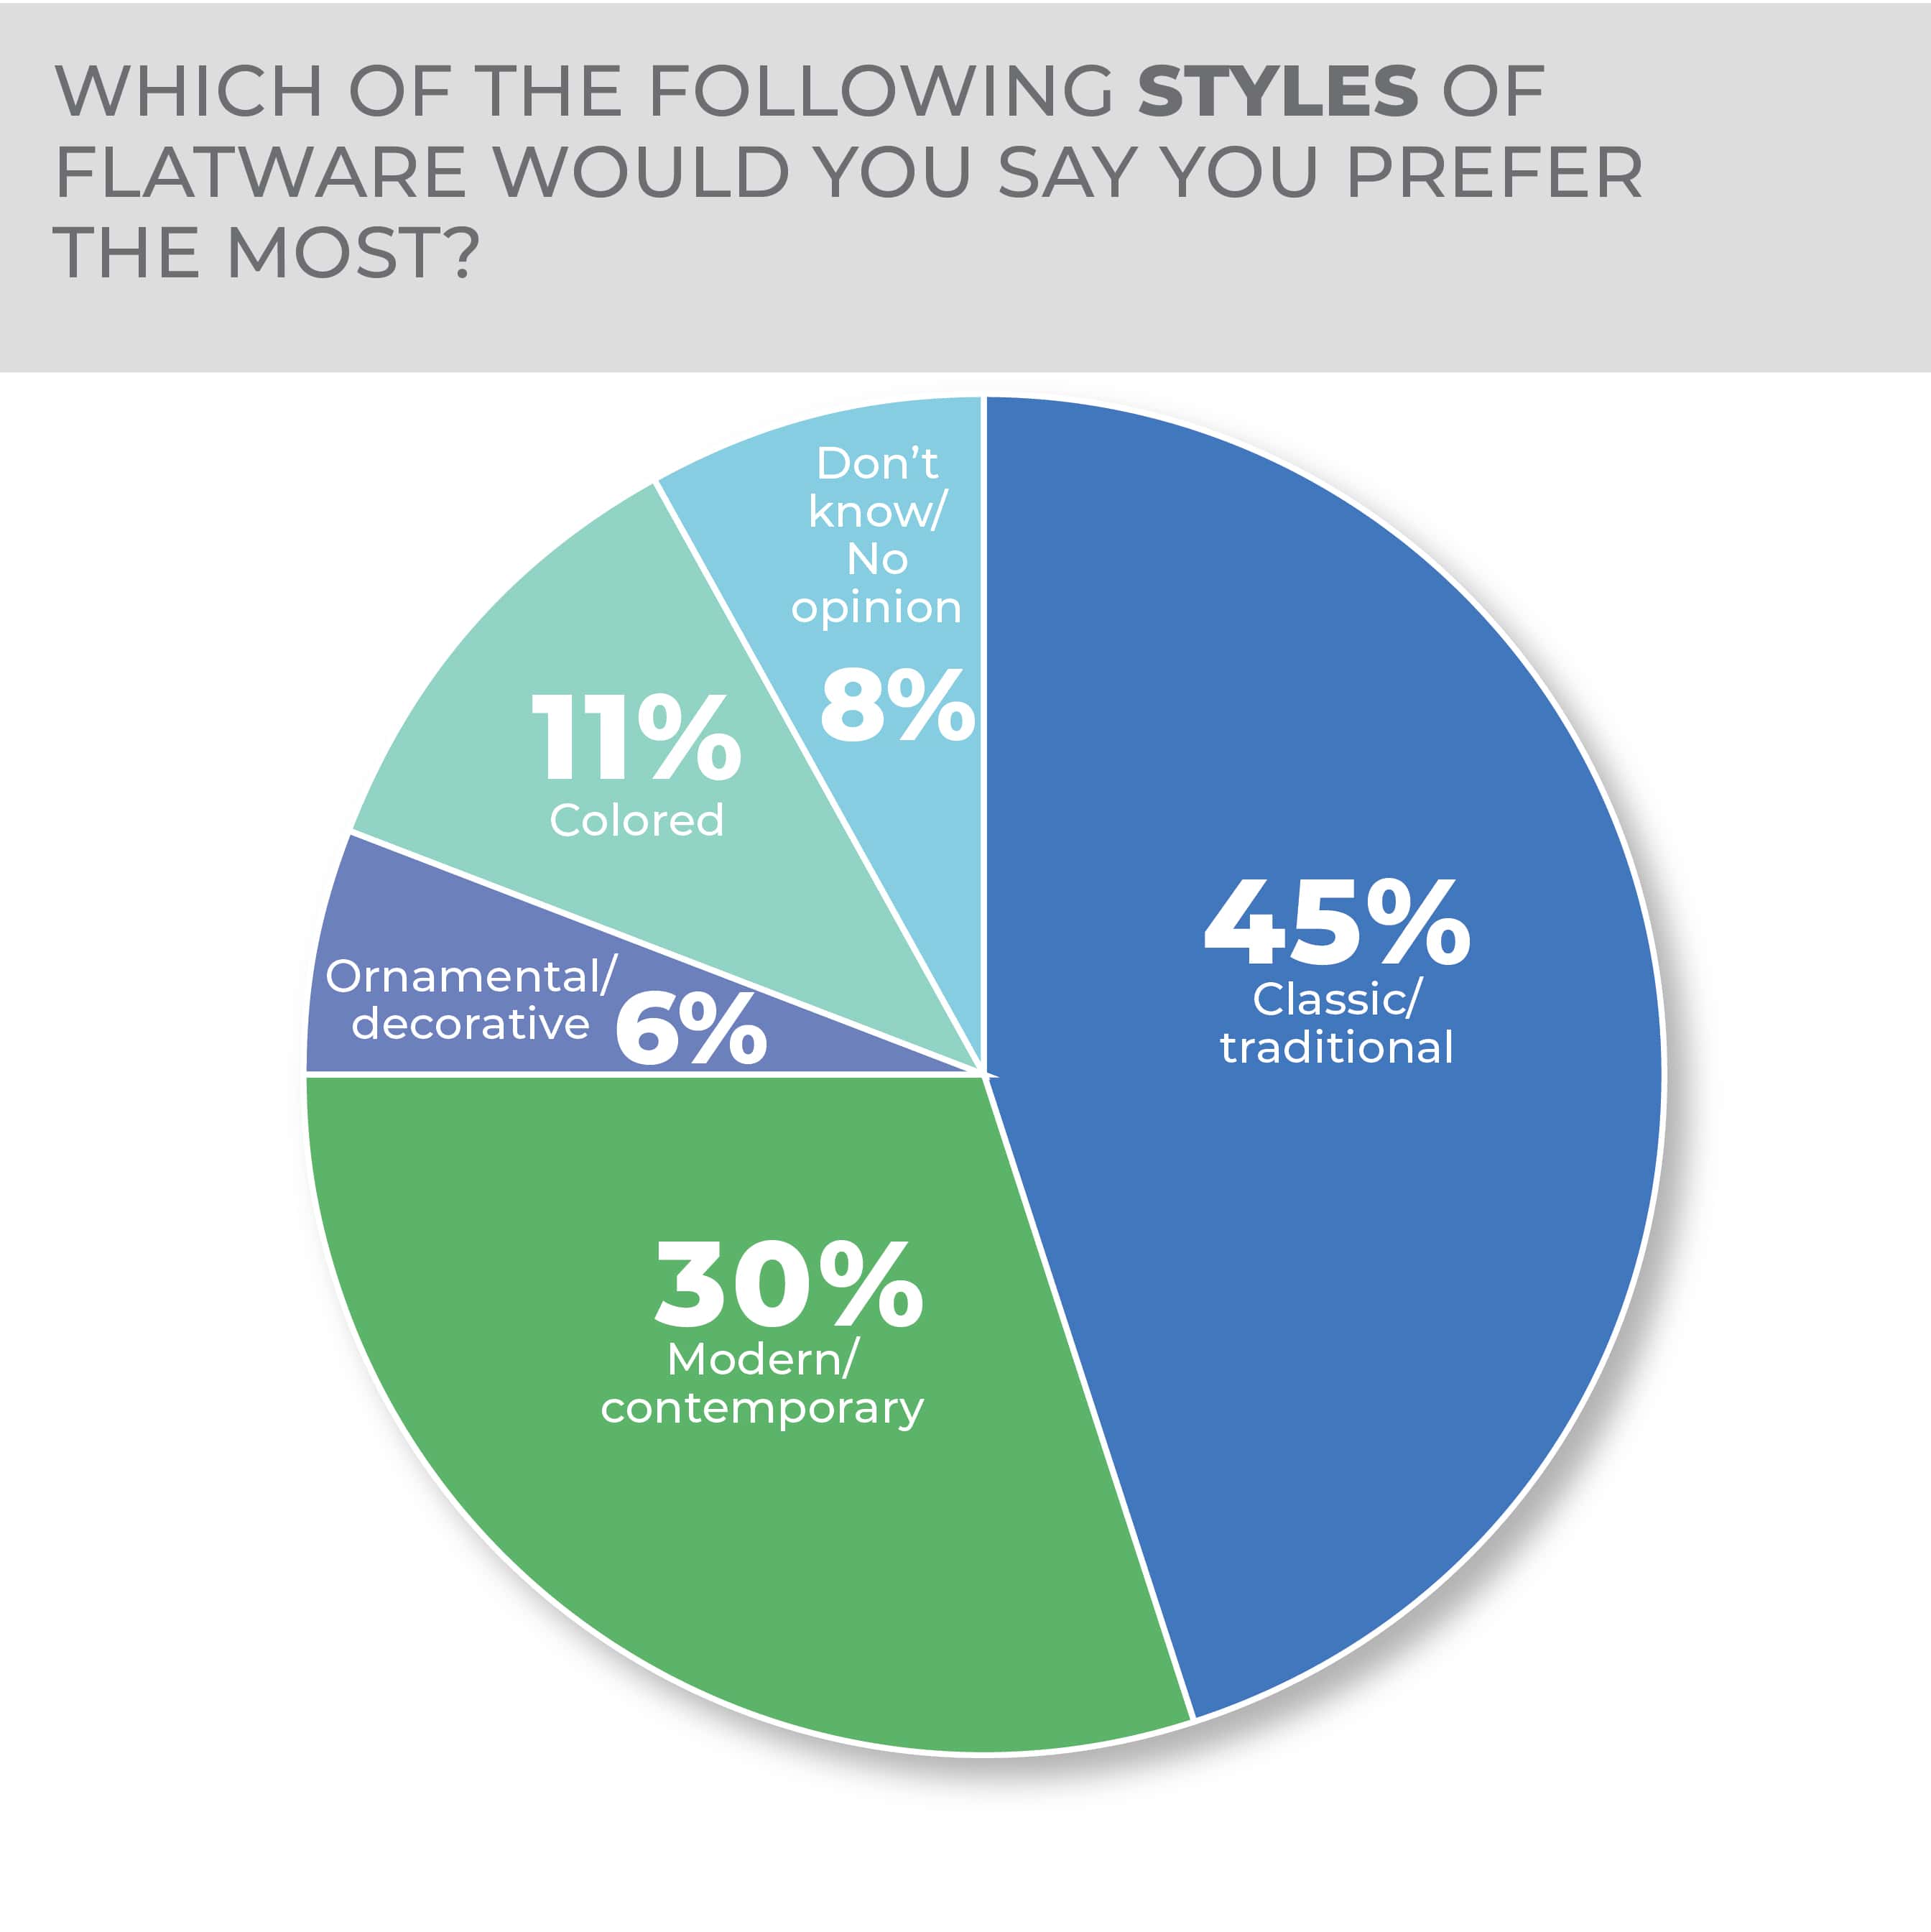
The value of flatware styling endurance and versatility from everyday dining to casual entertaining could explain the predominant preference for classic/traditional patterns (selected by 45% of respondents).
Modern/contemporary patterns continue to hold a solid preference share at 30%, while ornamental decorations are preferred by only 6%.
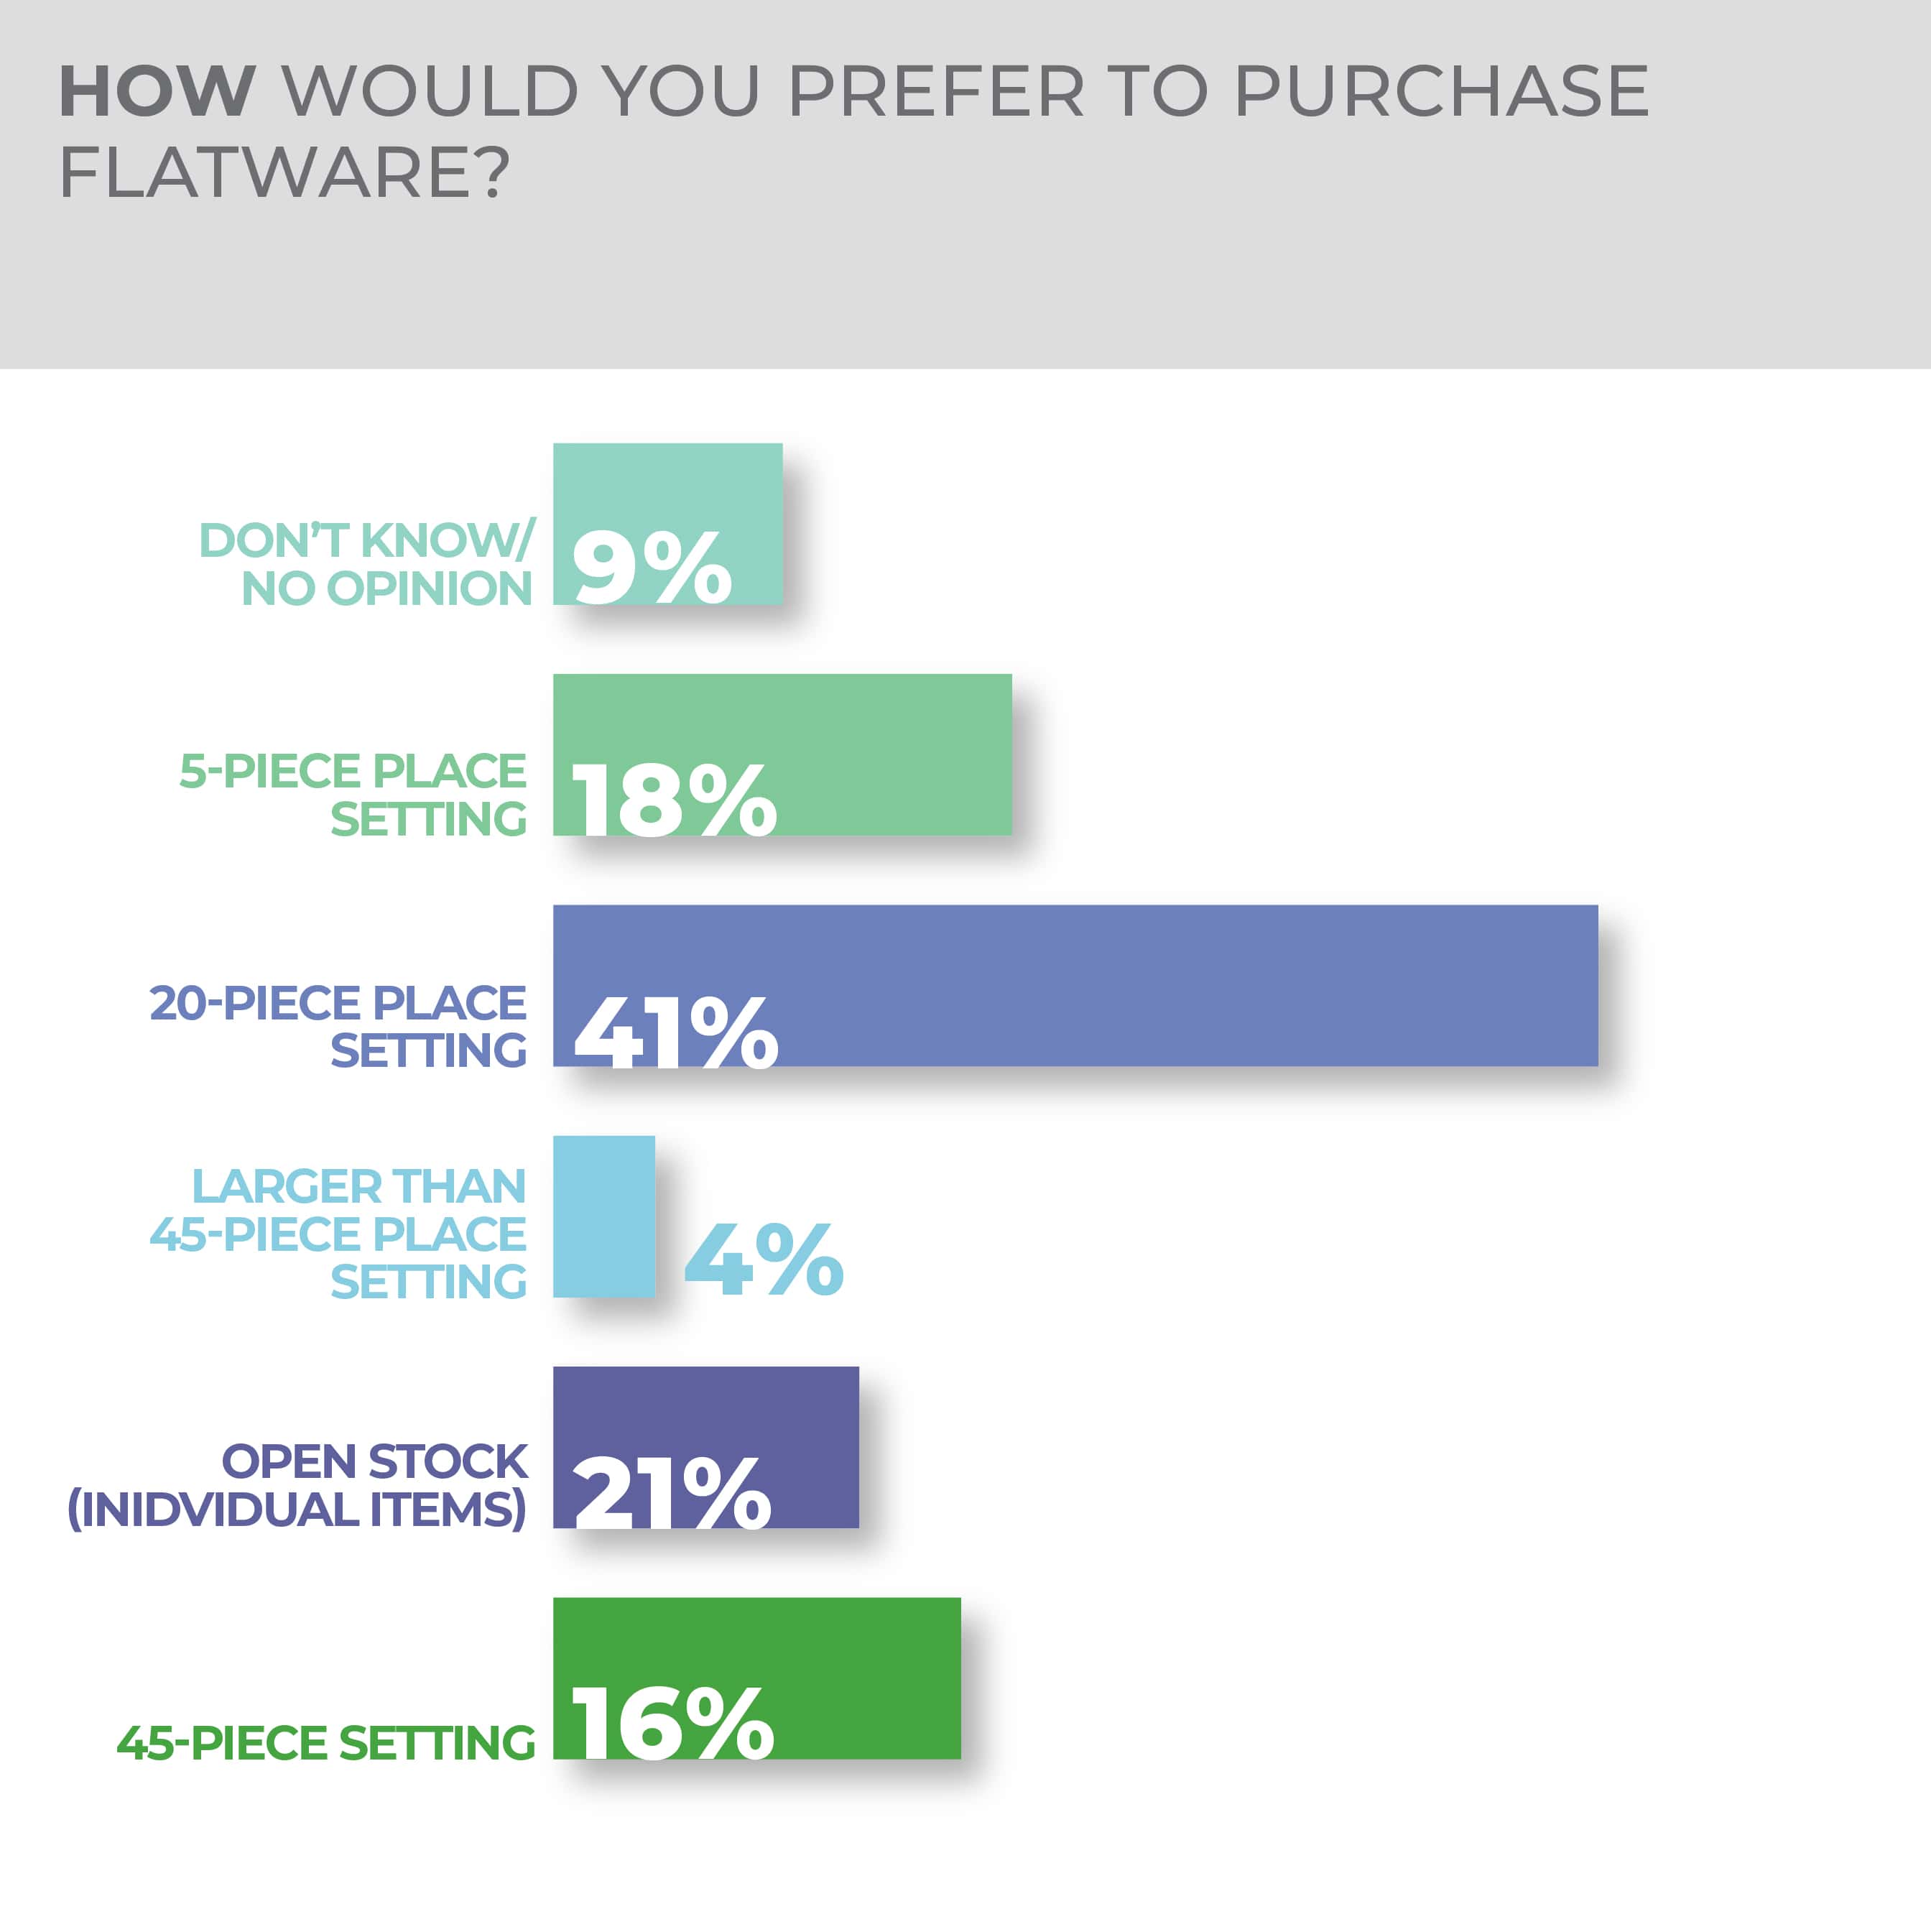
While open-stock flatware has surged in recent years, in part to serve mix-and-match dining trends, the purchasing value and convenience of large-piece counts remain compelling to consumers. For example, 41% selected a preference for a 20-piece setting compared to 21% who chose an open-stock preference.
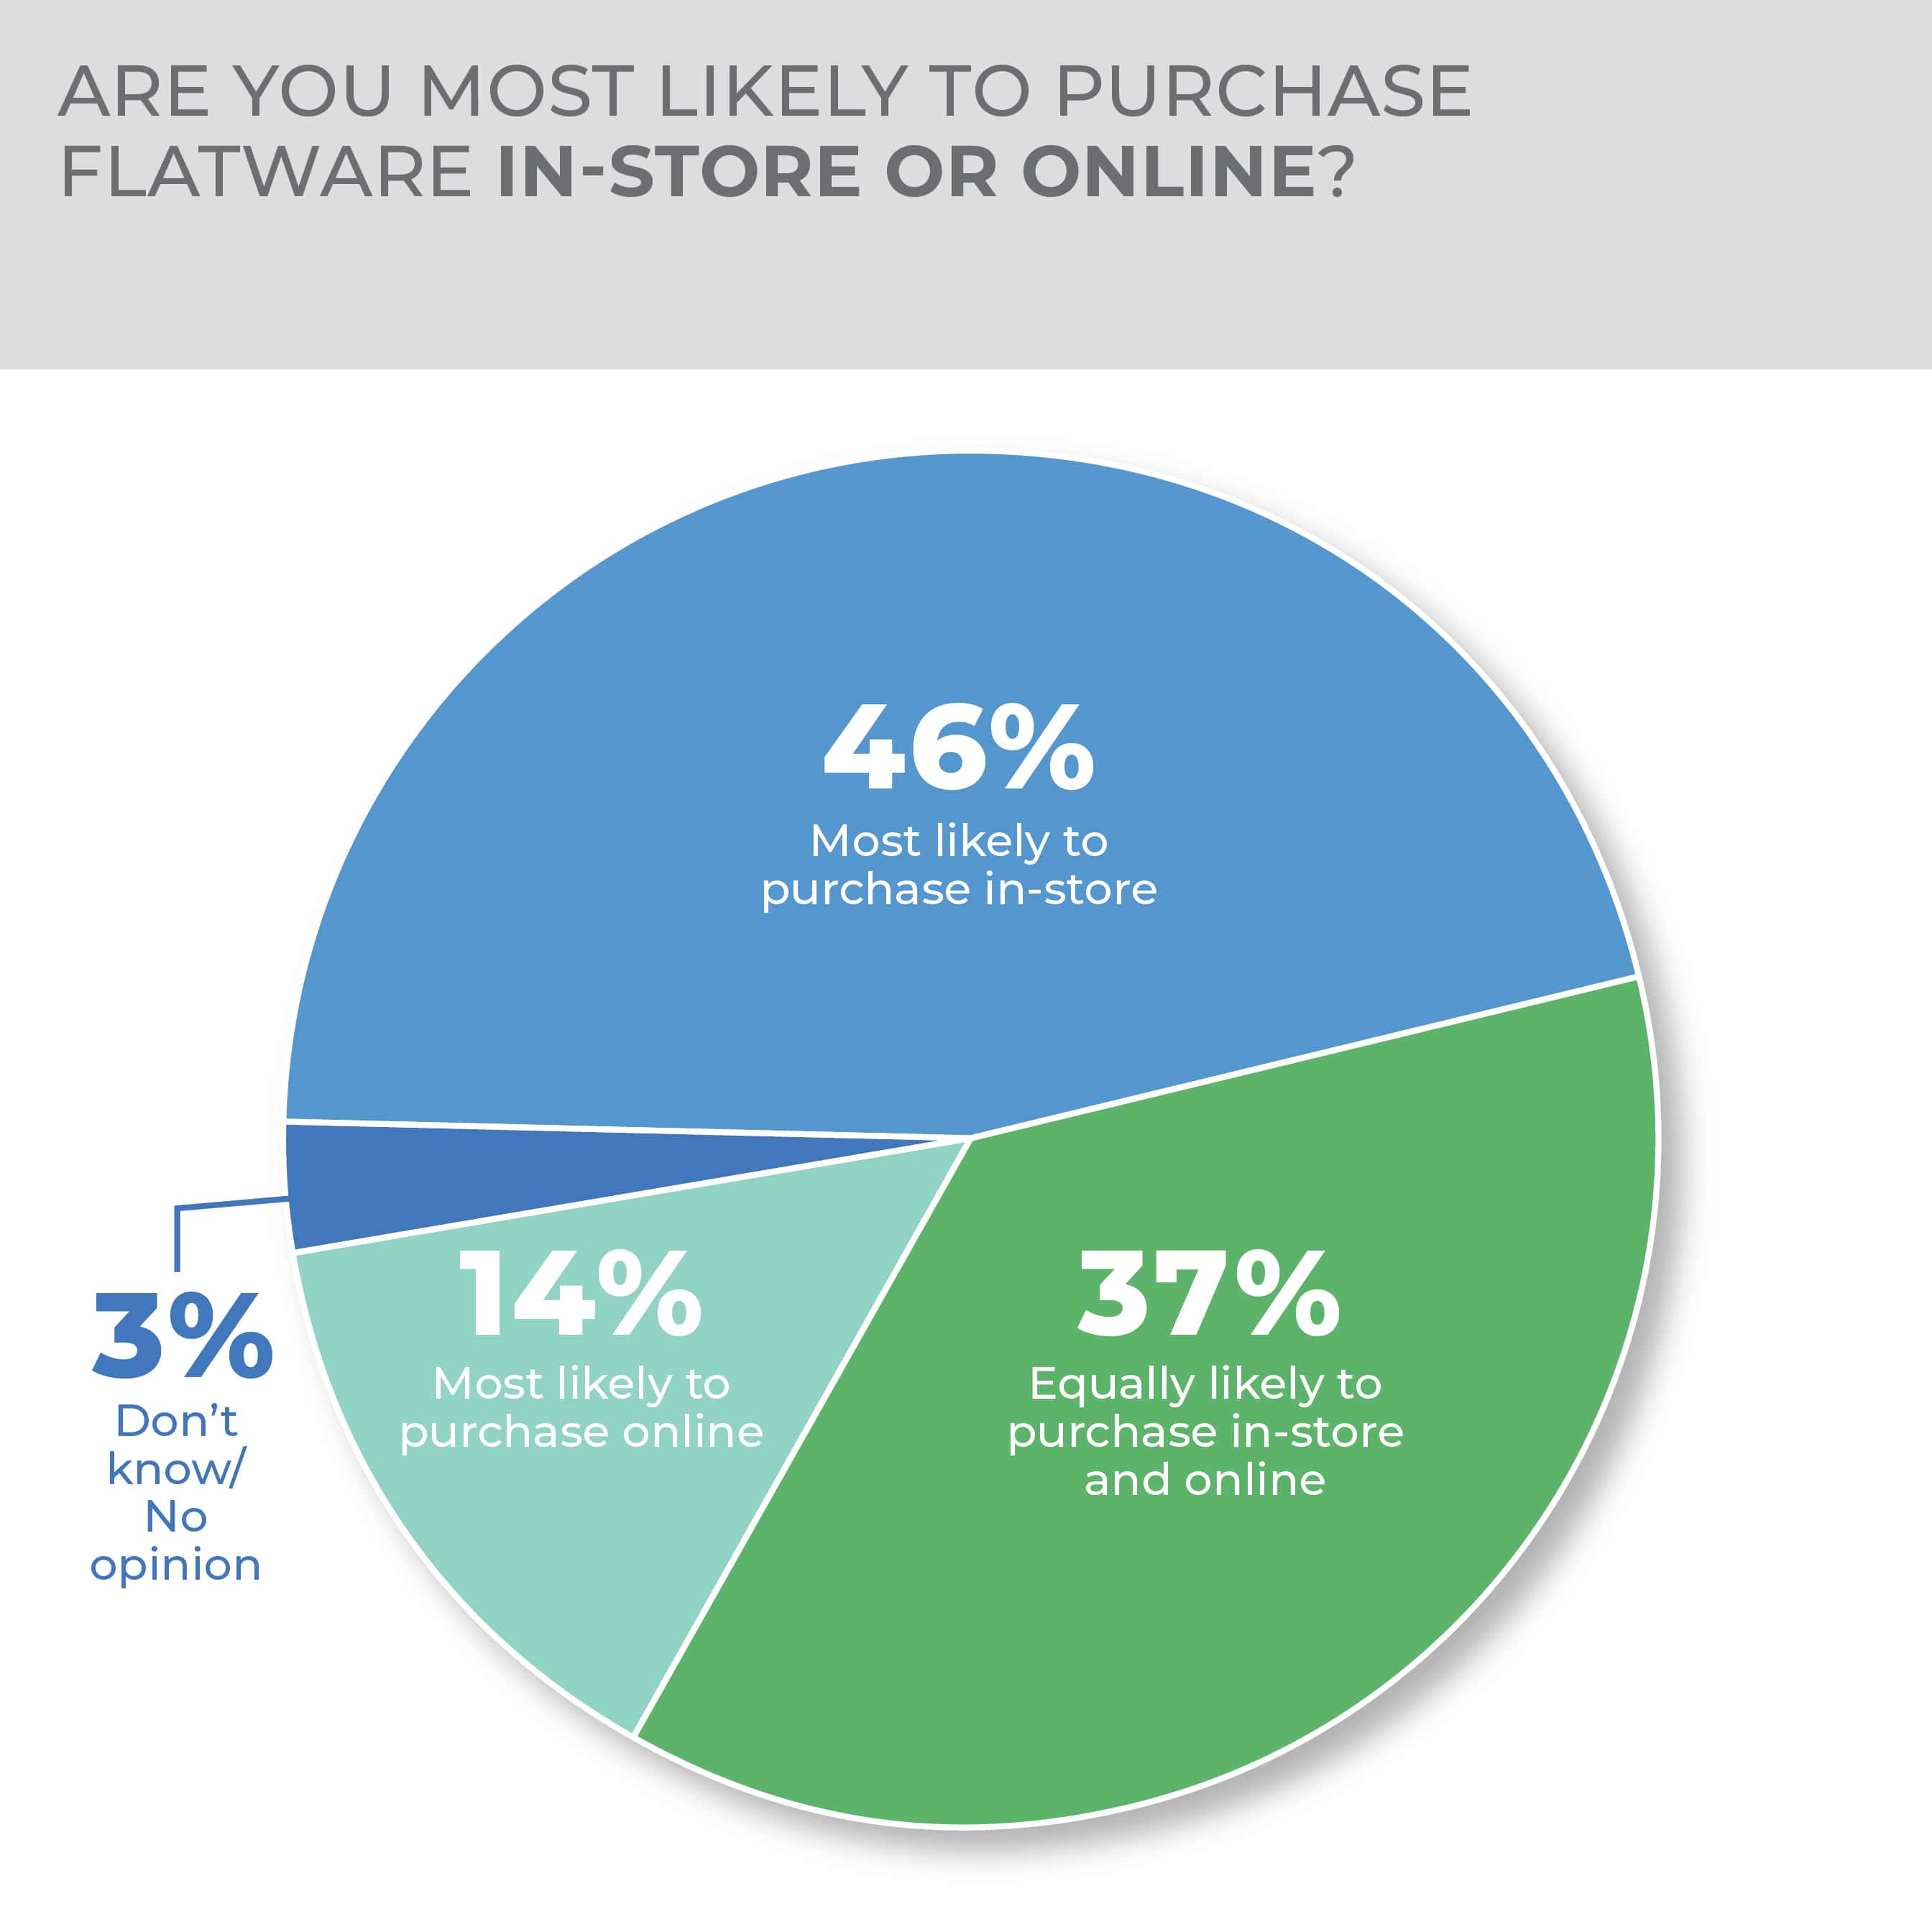
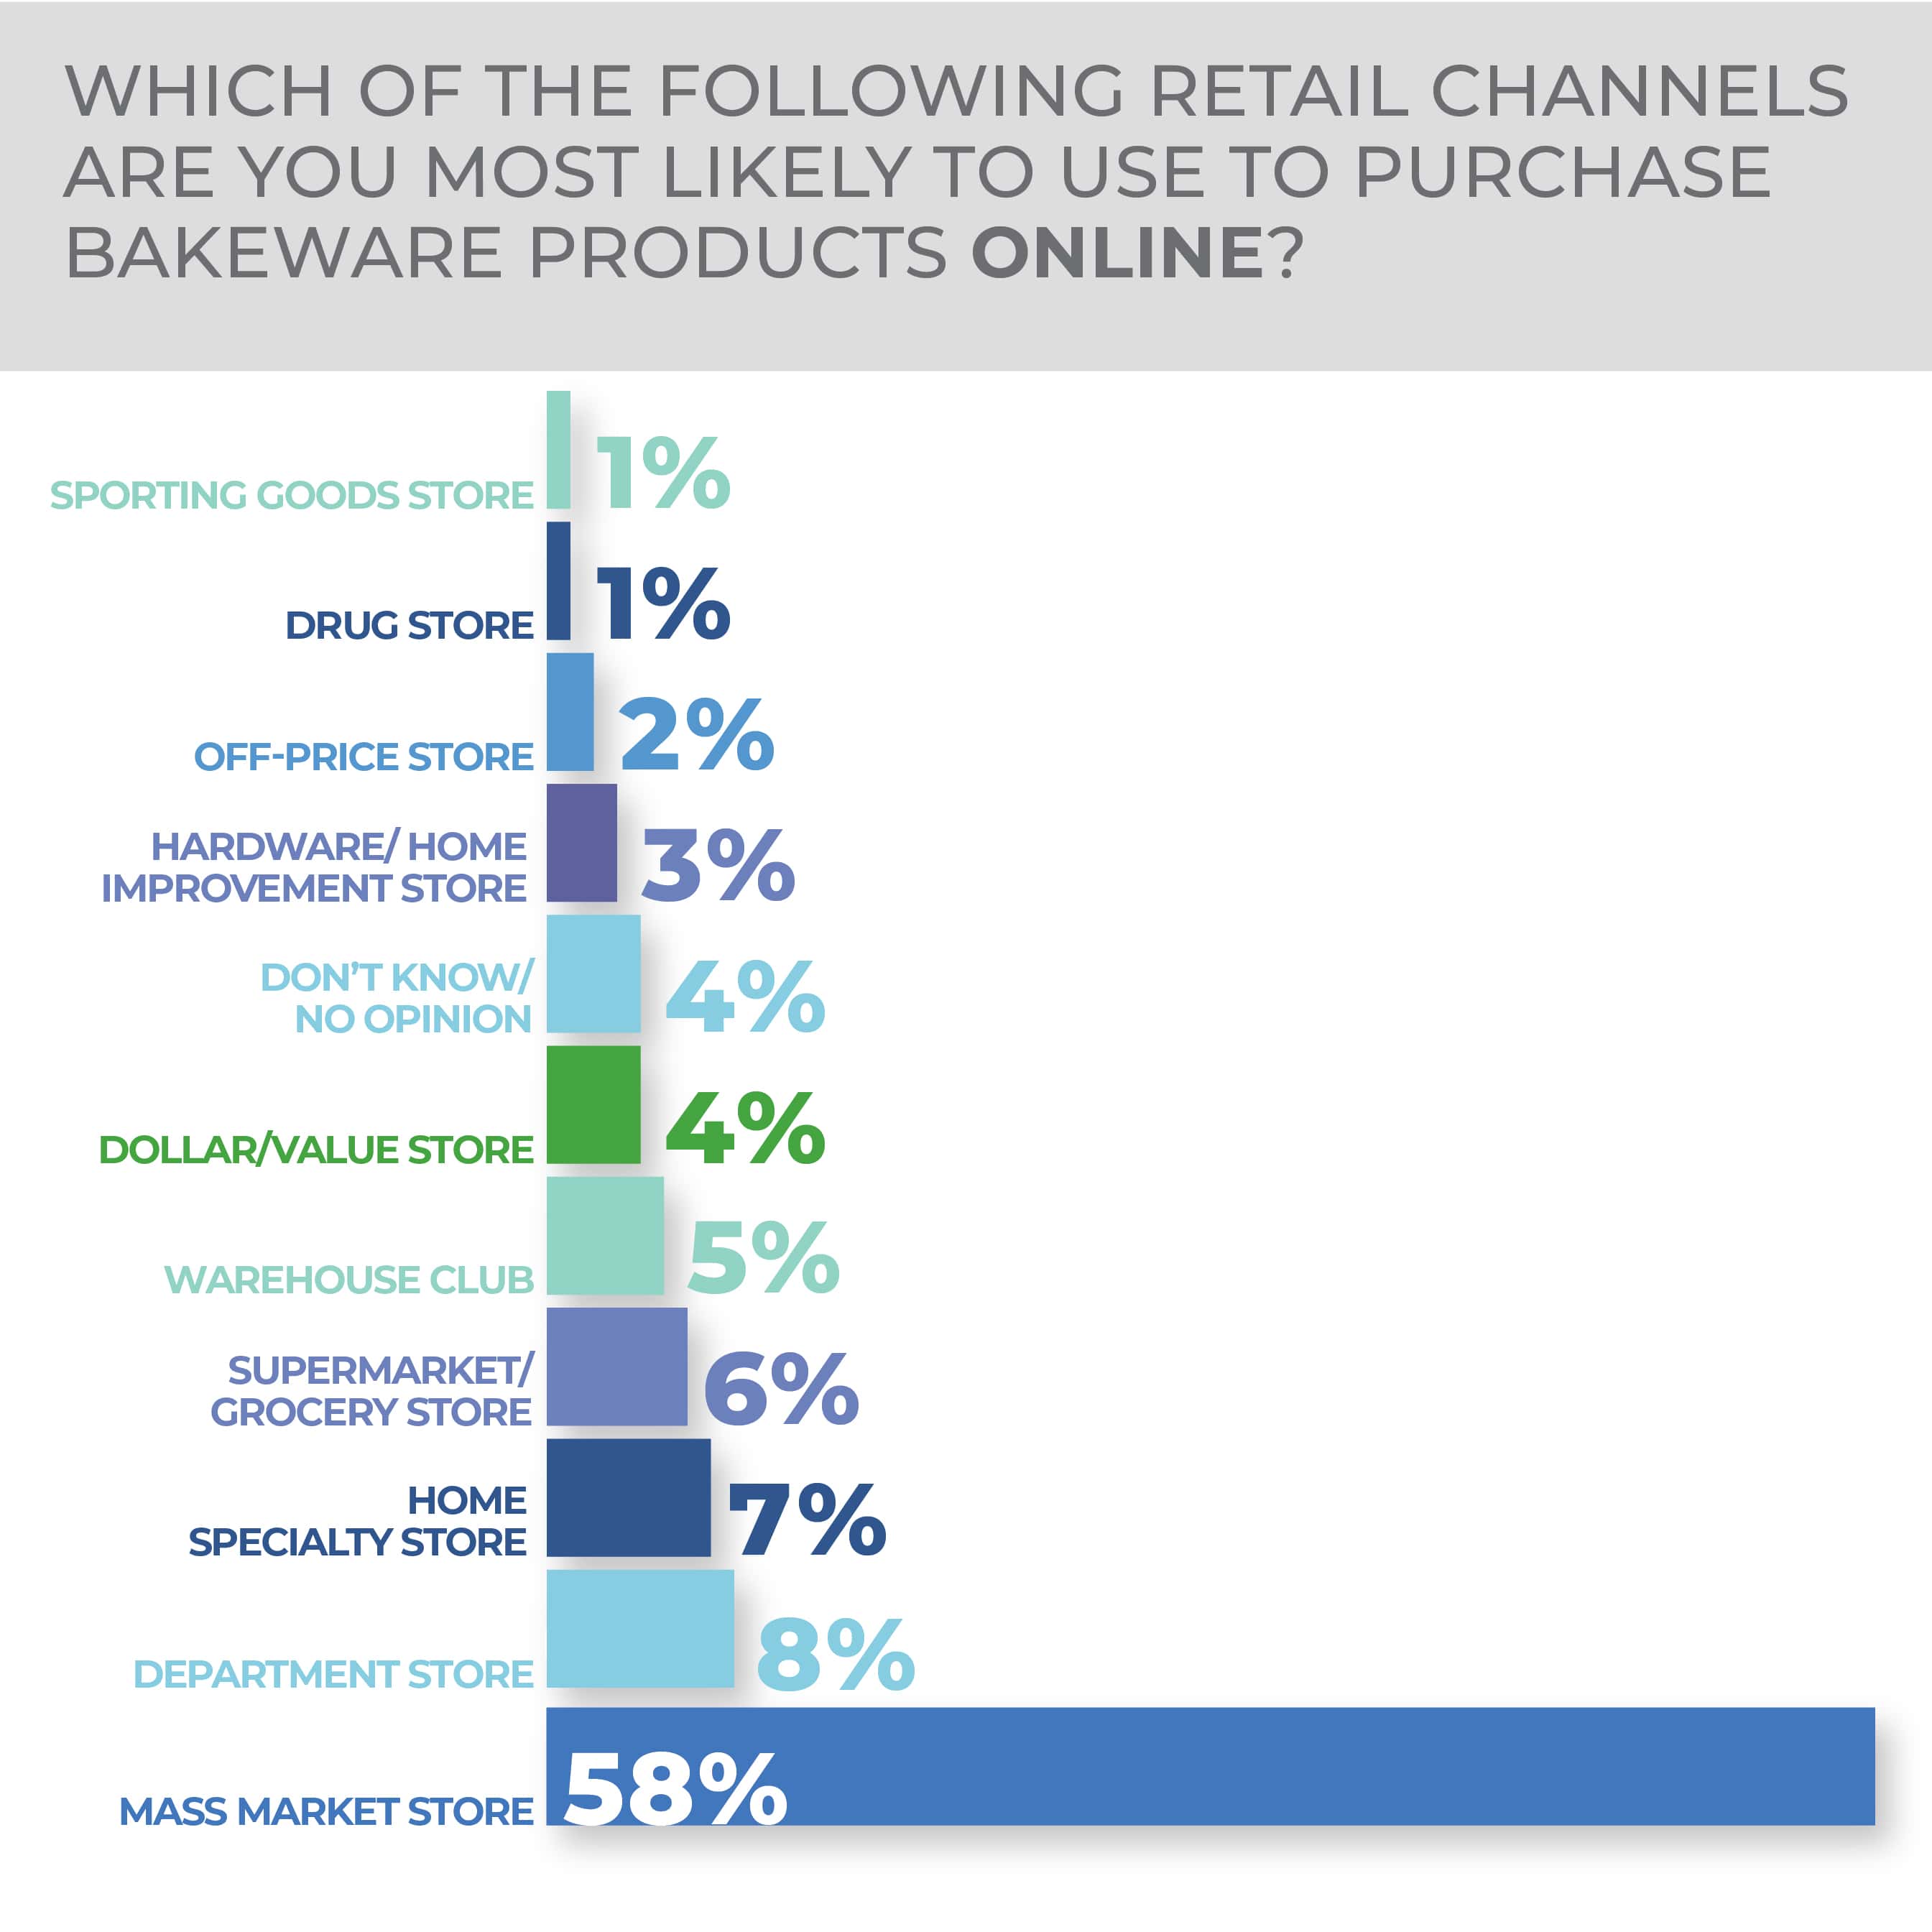
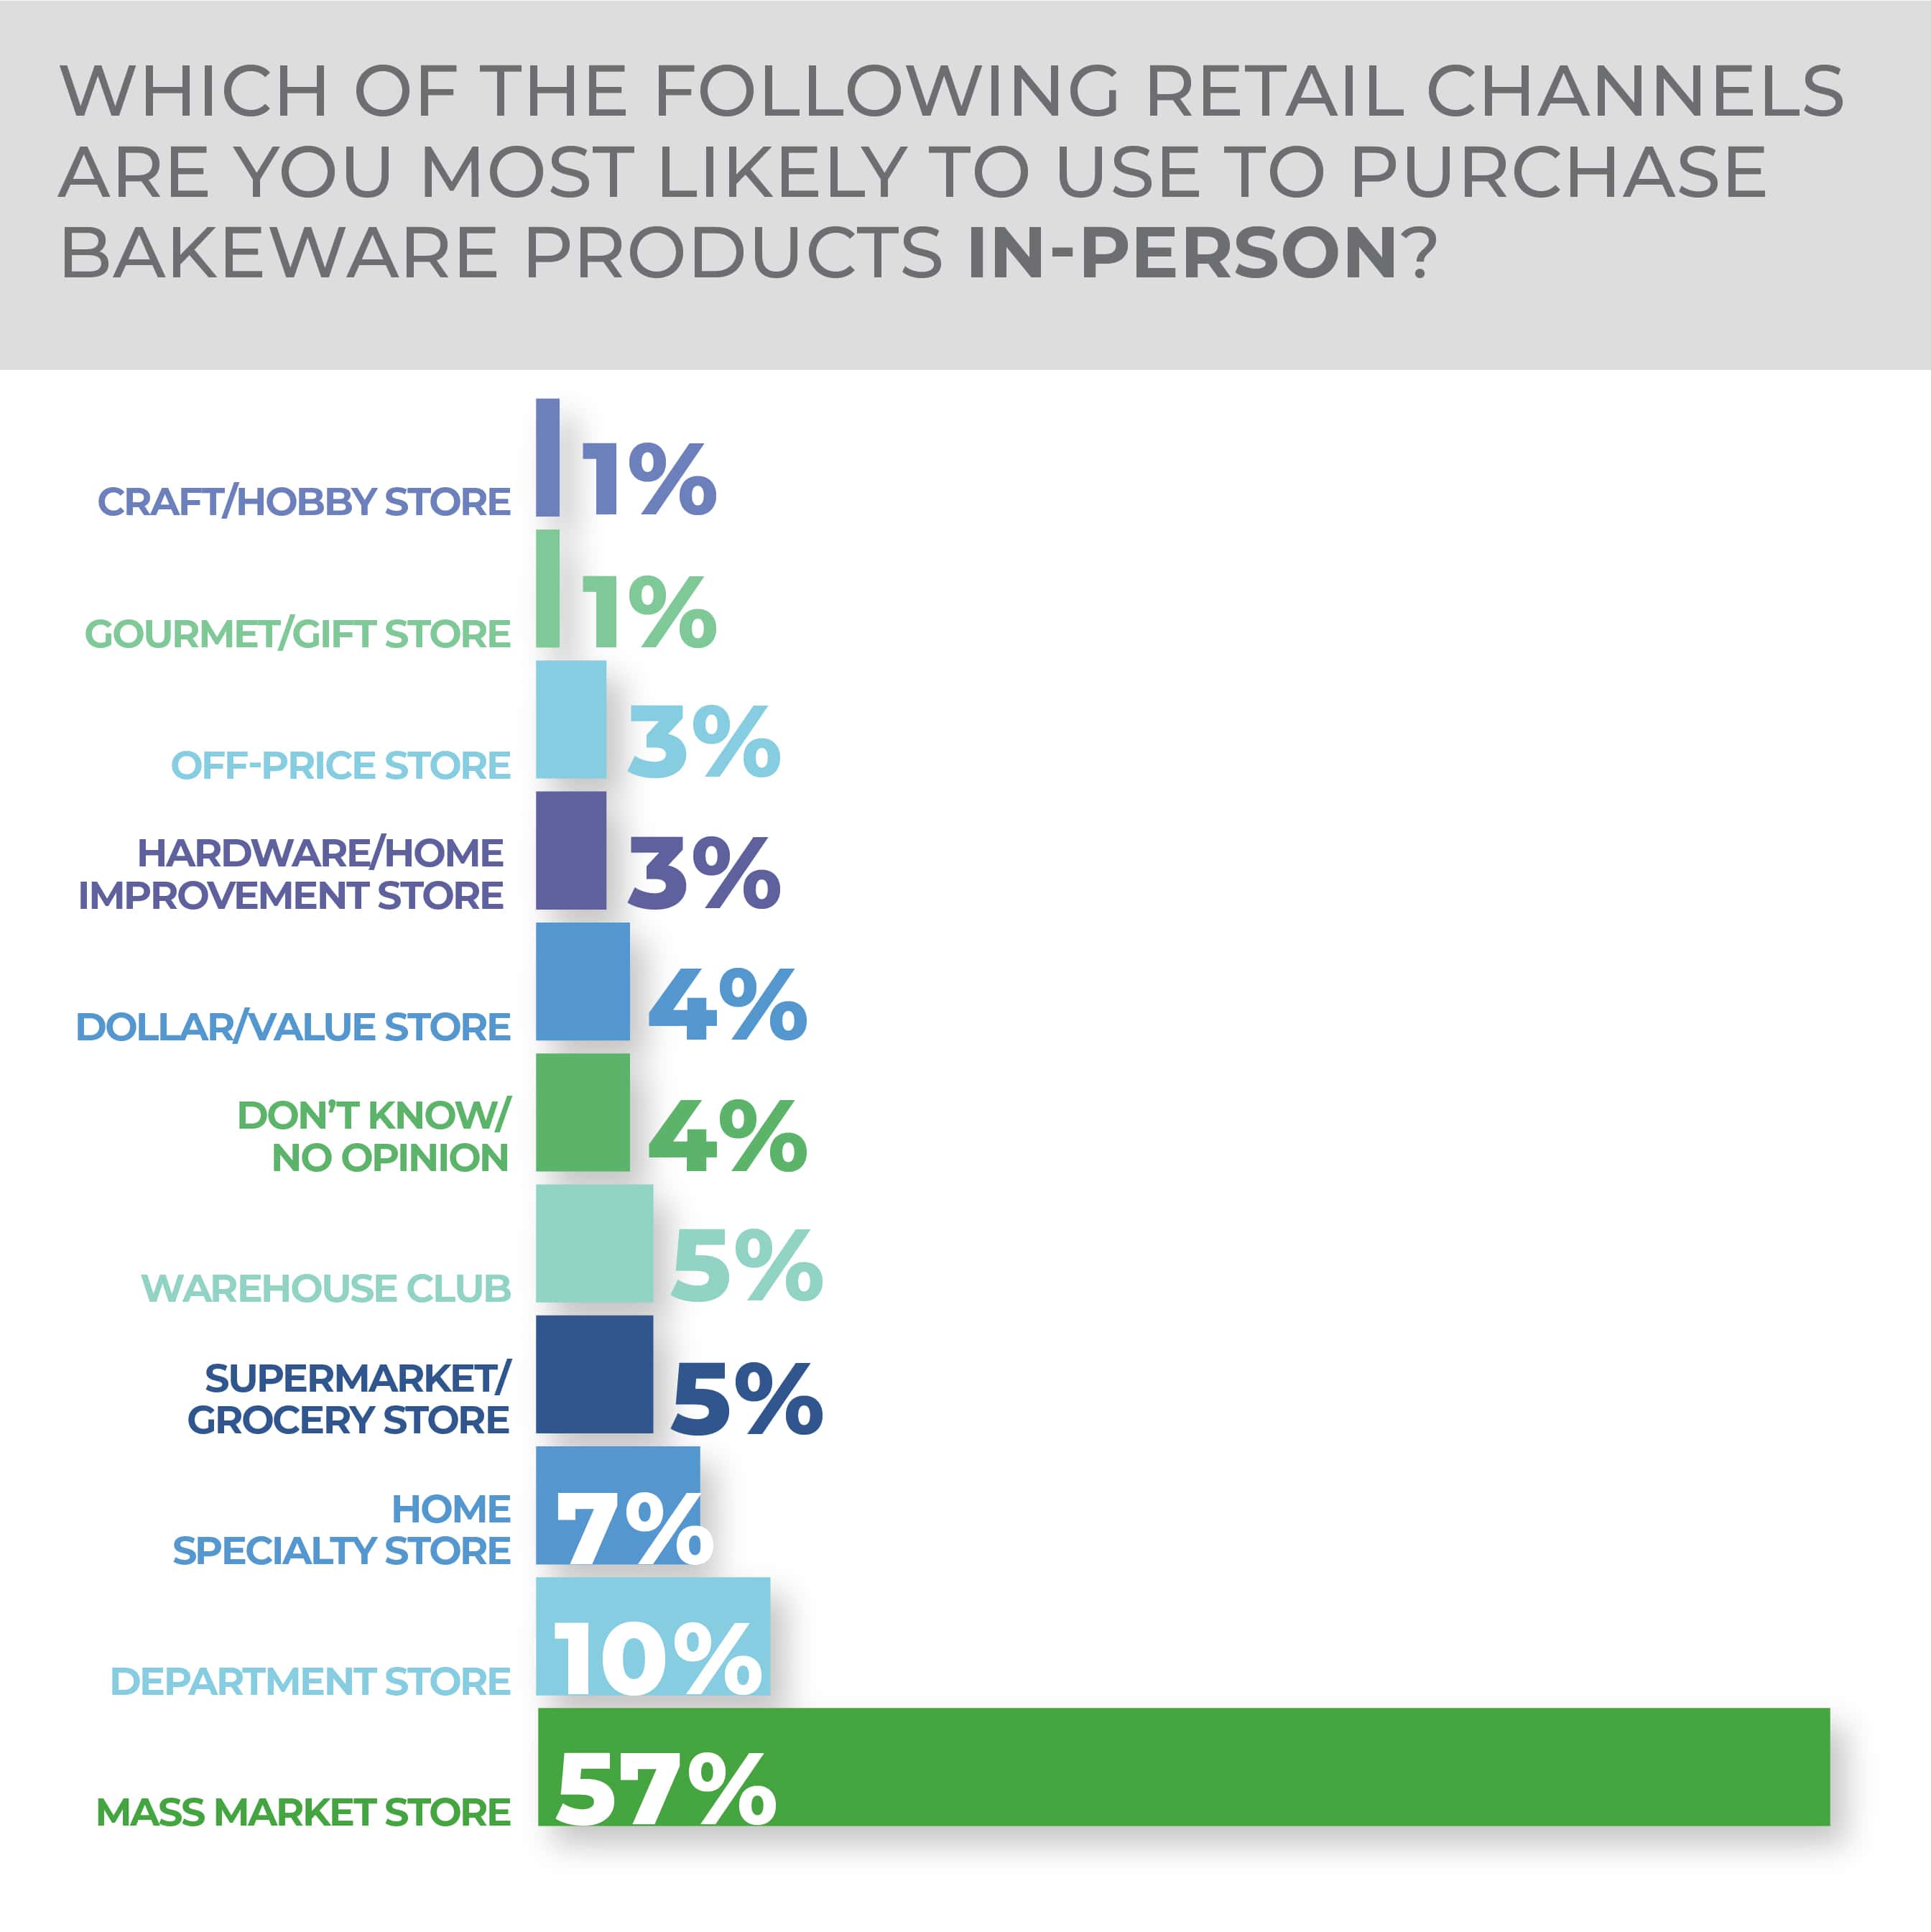
Tactile and weight attributes help explain why physical stores continue as a leading retail outlet choice (46%). More than half of respondents select mass market stores and websites as their top channel choices in flatware. However, physical department stores (10%) continue to be seen as an important channel for this tabletop staple.
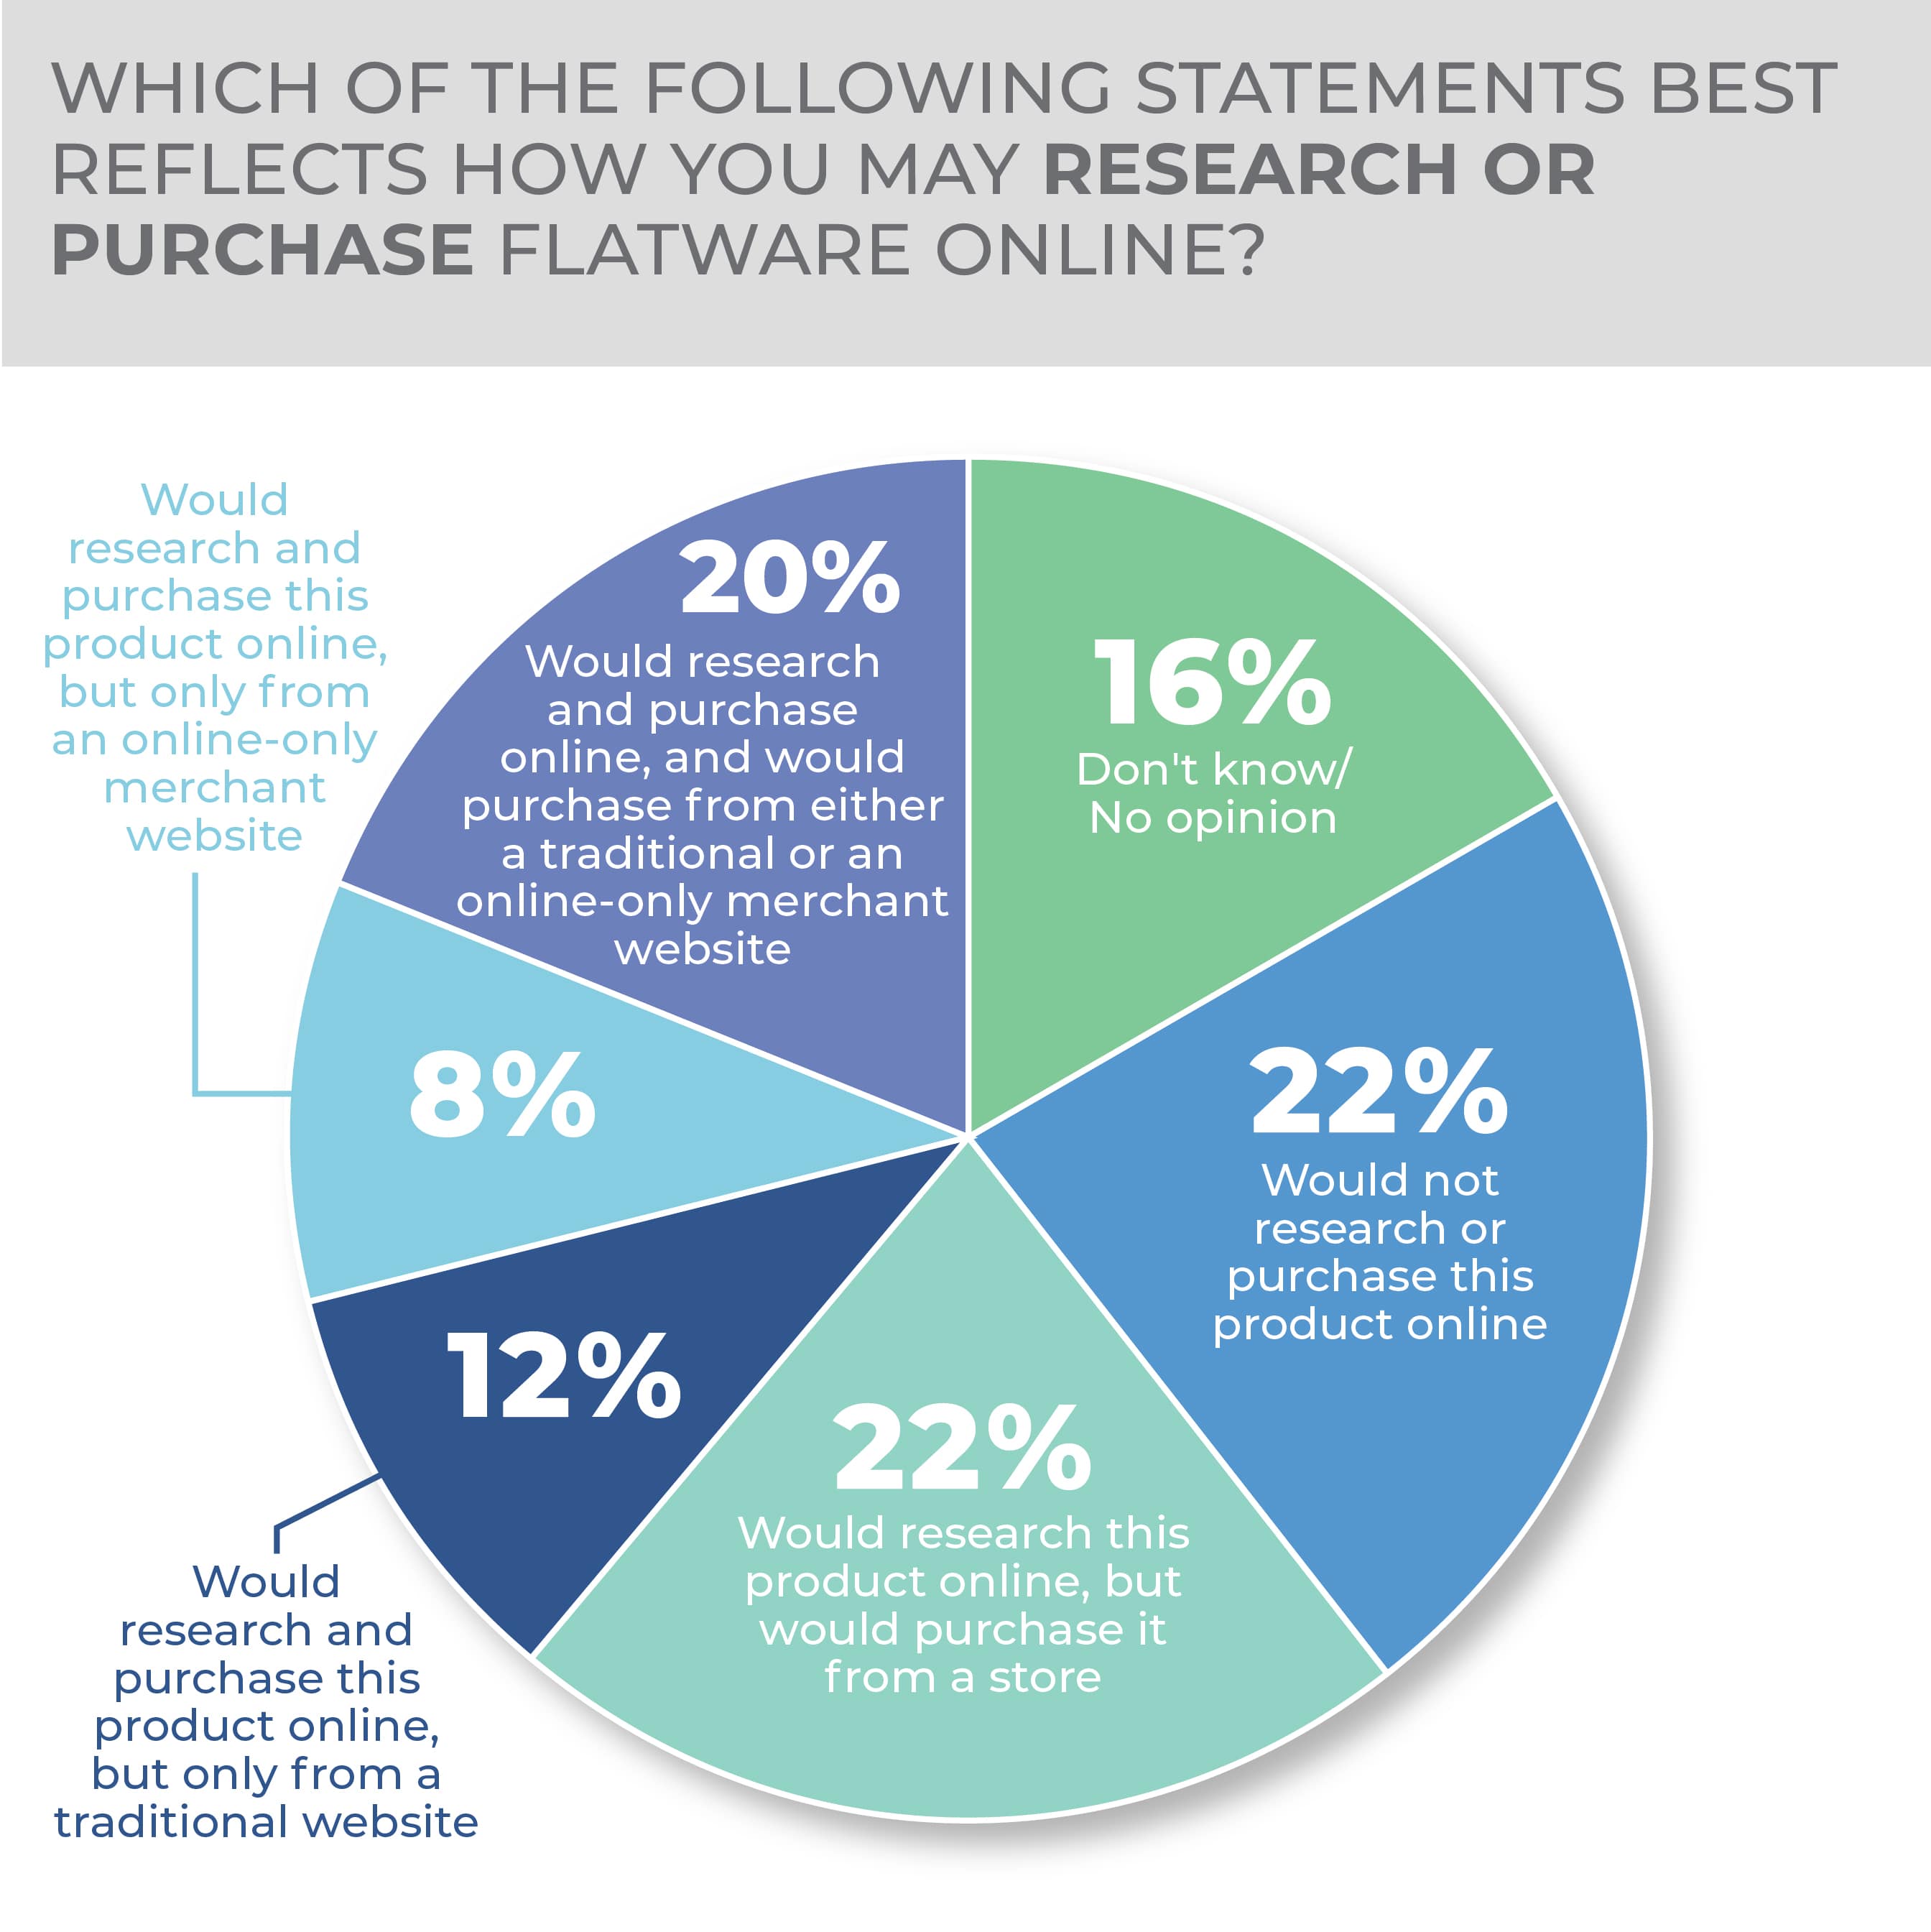
Younger generations are more likely to prefer online flatware purchases.
More Flatware Findings:
Floor Care Electrics
Floor care electrics is a category that has evolved at a high rate over the past few decades, from canister, upright, handheld or cordless vacuums to steam cleaners, carpet shampooers, robotic vacuums and other specialized products that fall into and around those categories.
Although not as frequent a purchase as some other housewares categories, floor care electrics products, with their increased diversity, are more prevalent in consumer homes, where two, three or more may reside. Purveyors, and especially those that are aggressive in their product presentations to consumers, have better chances of selling something from the category in any given year than was the case in the past.
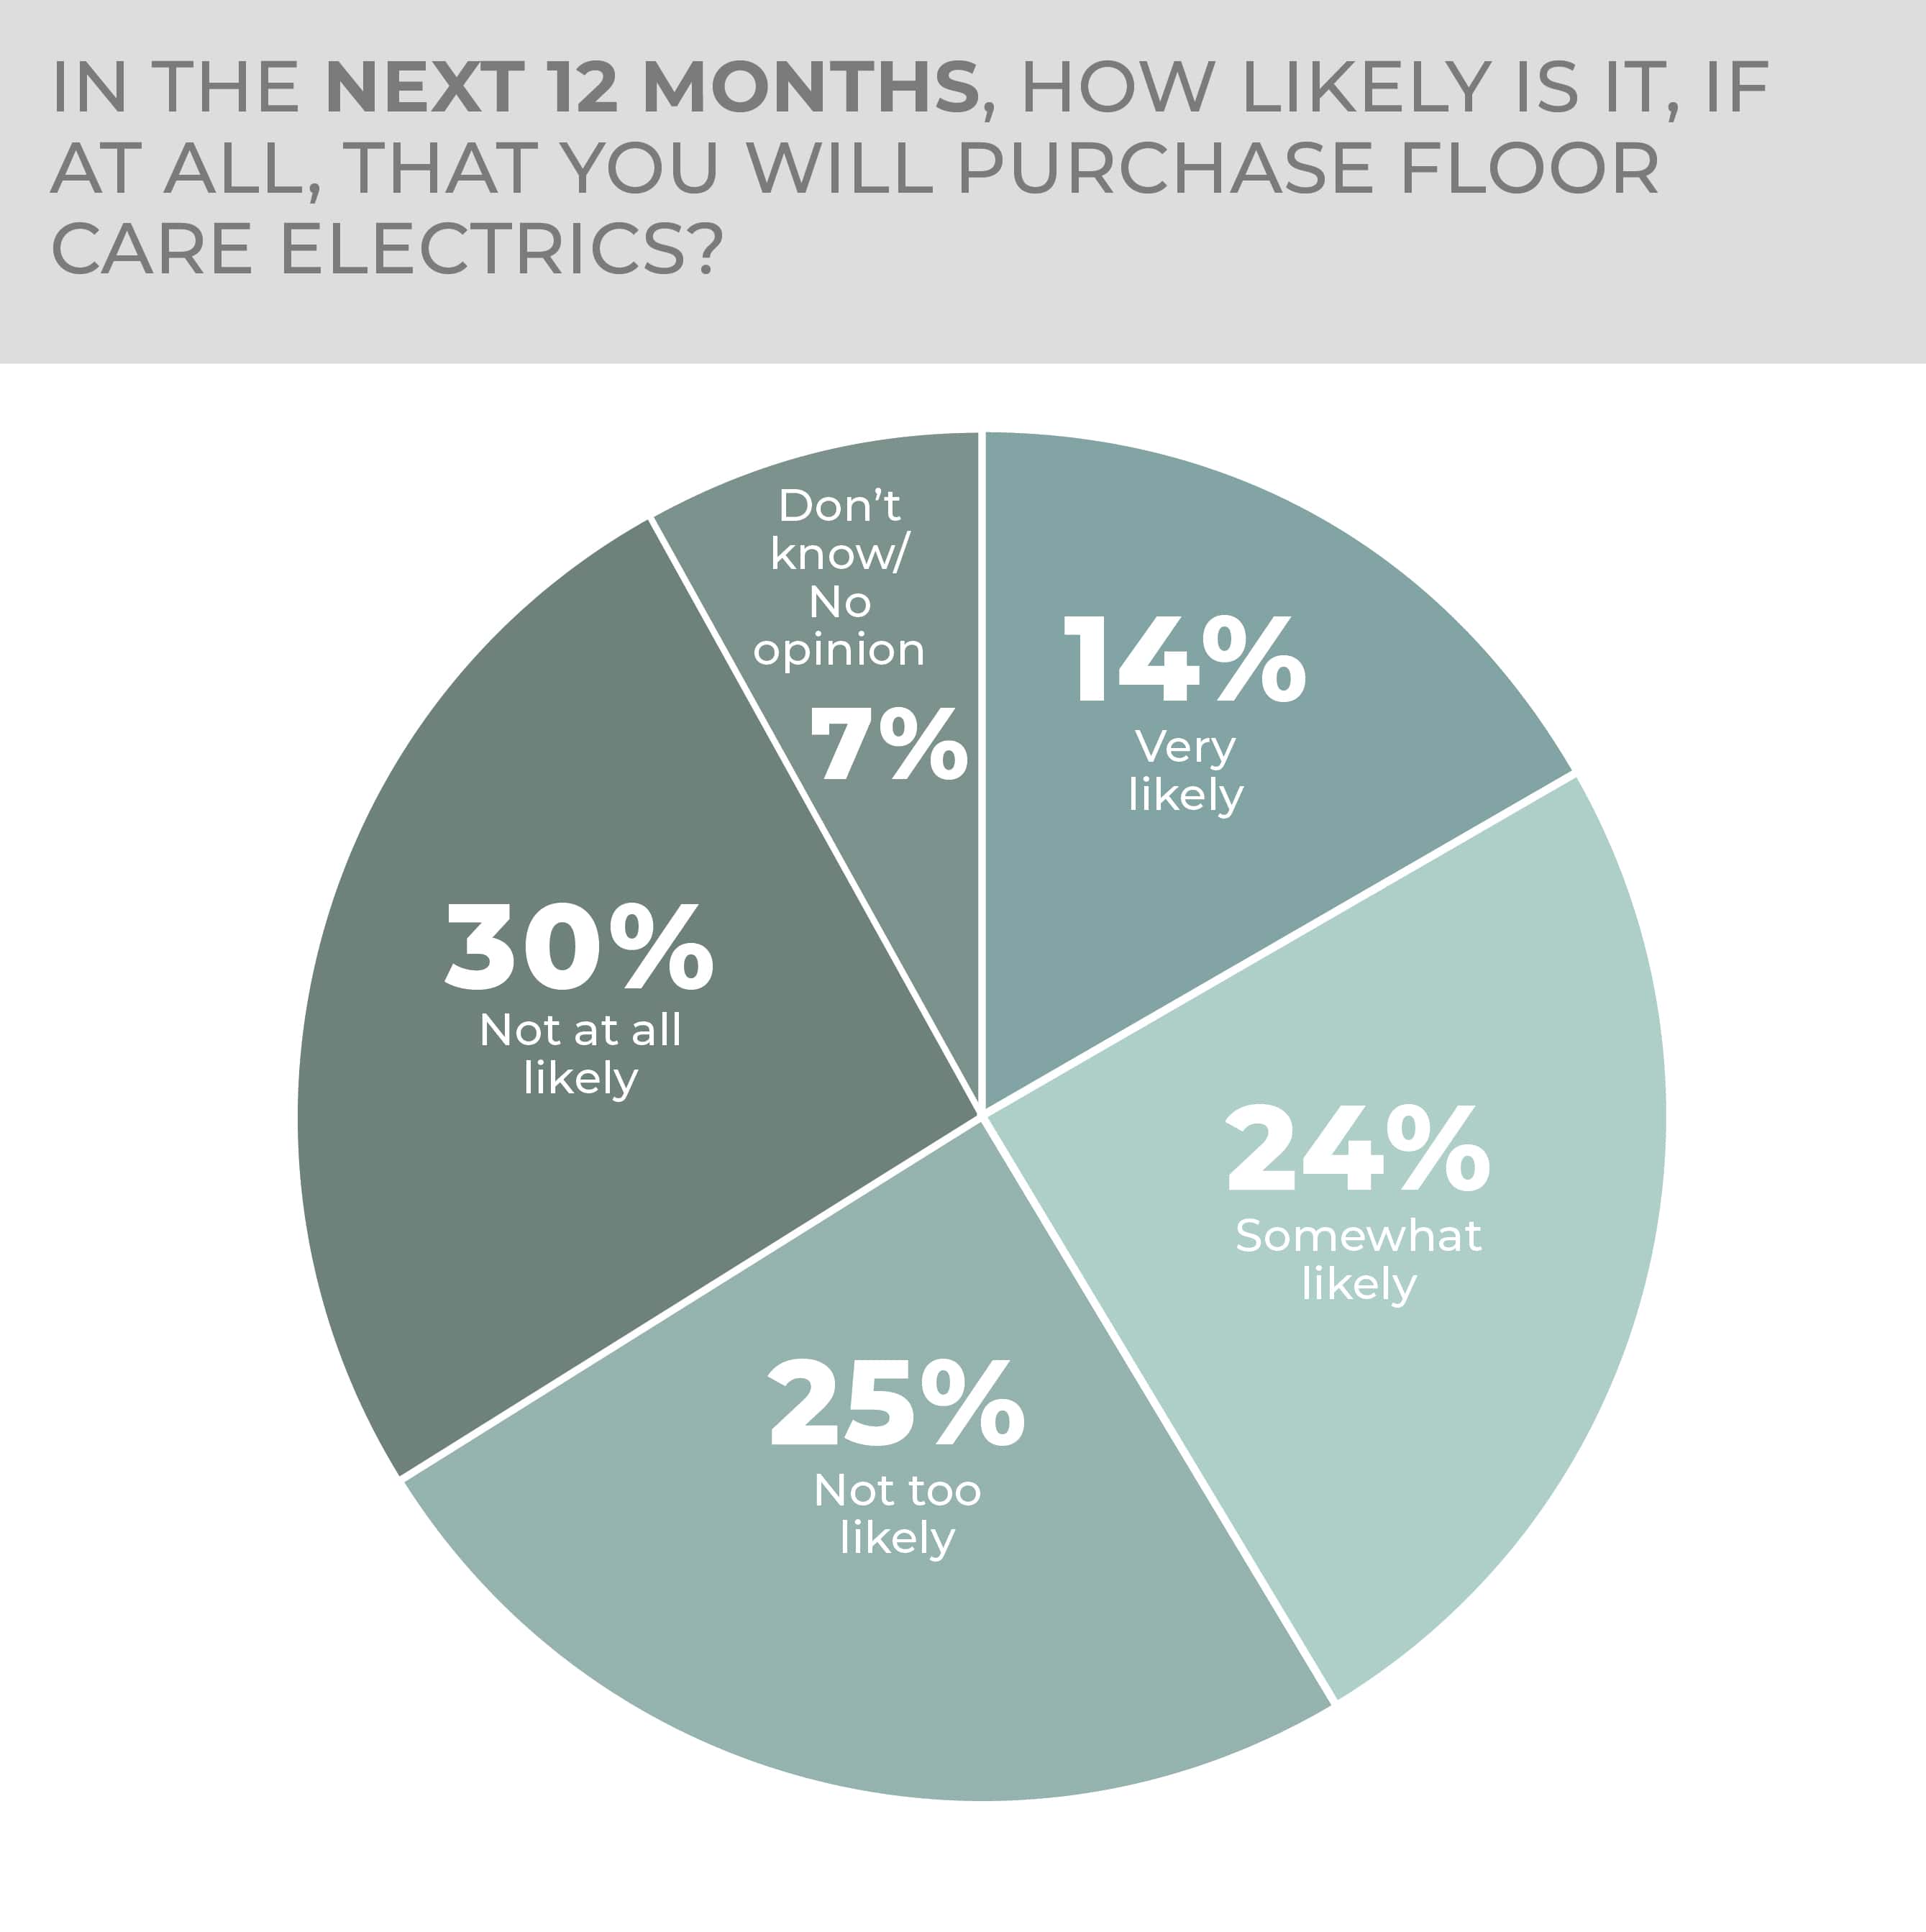
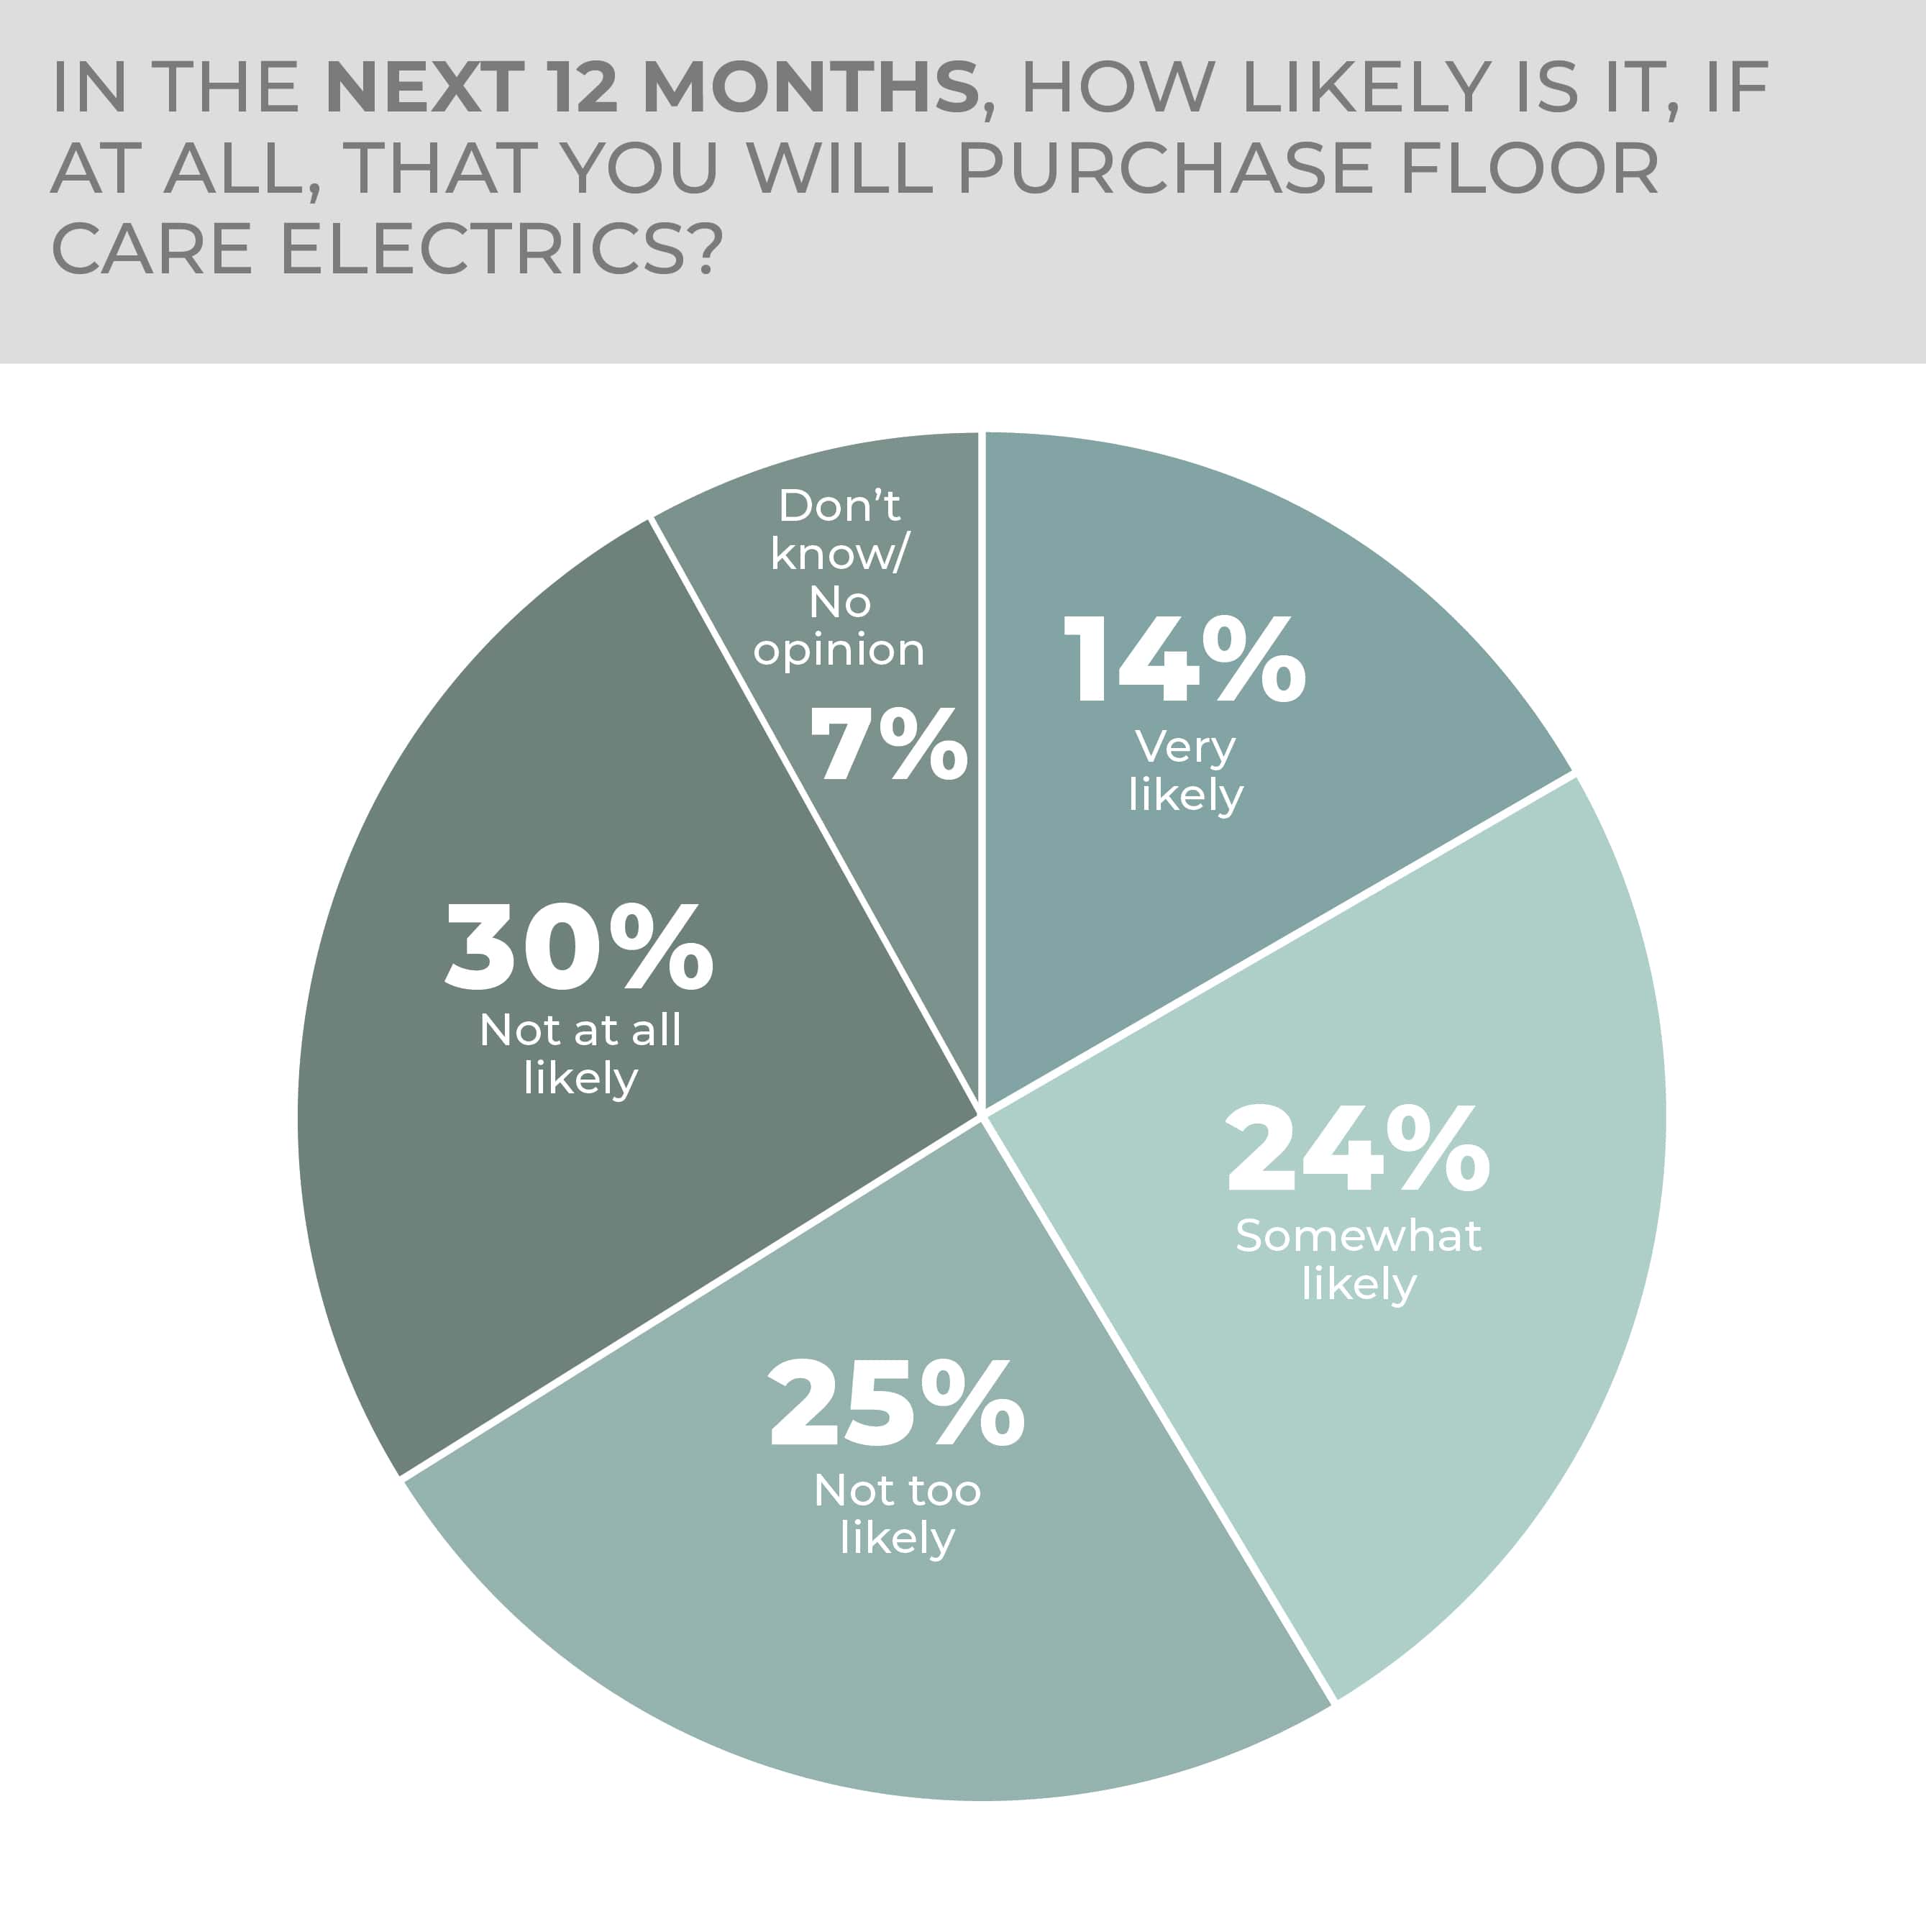
In the HomePage News 2023 Consumer Outlook Survey, 14% of consumers said they would be very likely and 24% said they would be somewhat likely purchase a floor care electrics product. As such, more than a third of the United States population may purchase in the category in the year ahead. Purchasing potential is down year over year; in the 2022 Consumer Outlook Survey, 17% of consumers said they were very likely and 25% said they were somewhat likely to buy a floor care electric product.
-
- Respondents to the survey were most interested in steam cleaners and hand-held vacuums among floor care electrics.
- The most important vacuum cleaner feature among survey respondents was suction power followed by lightweight design.
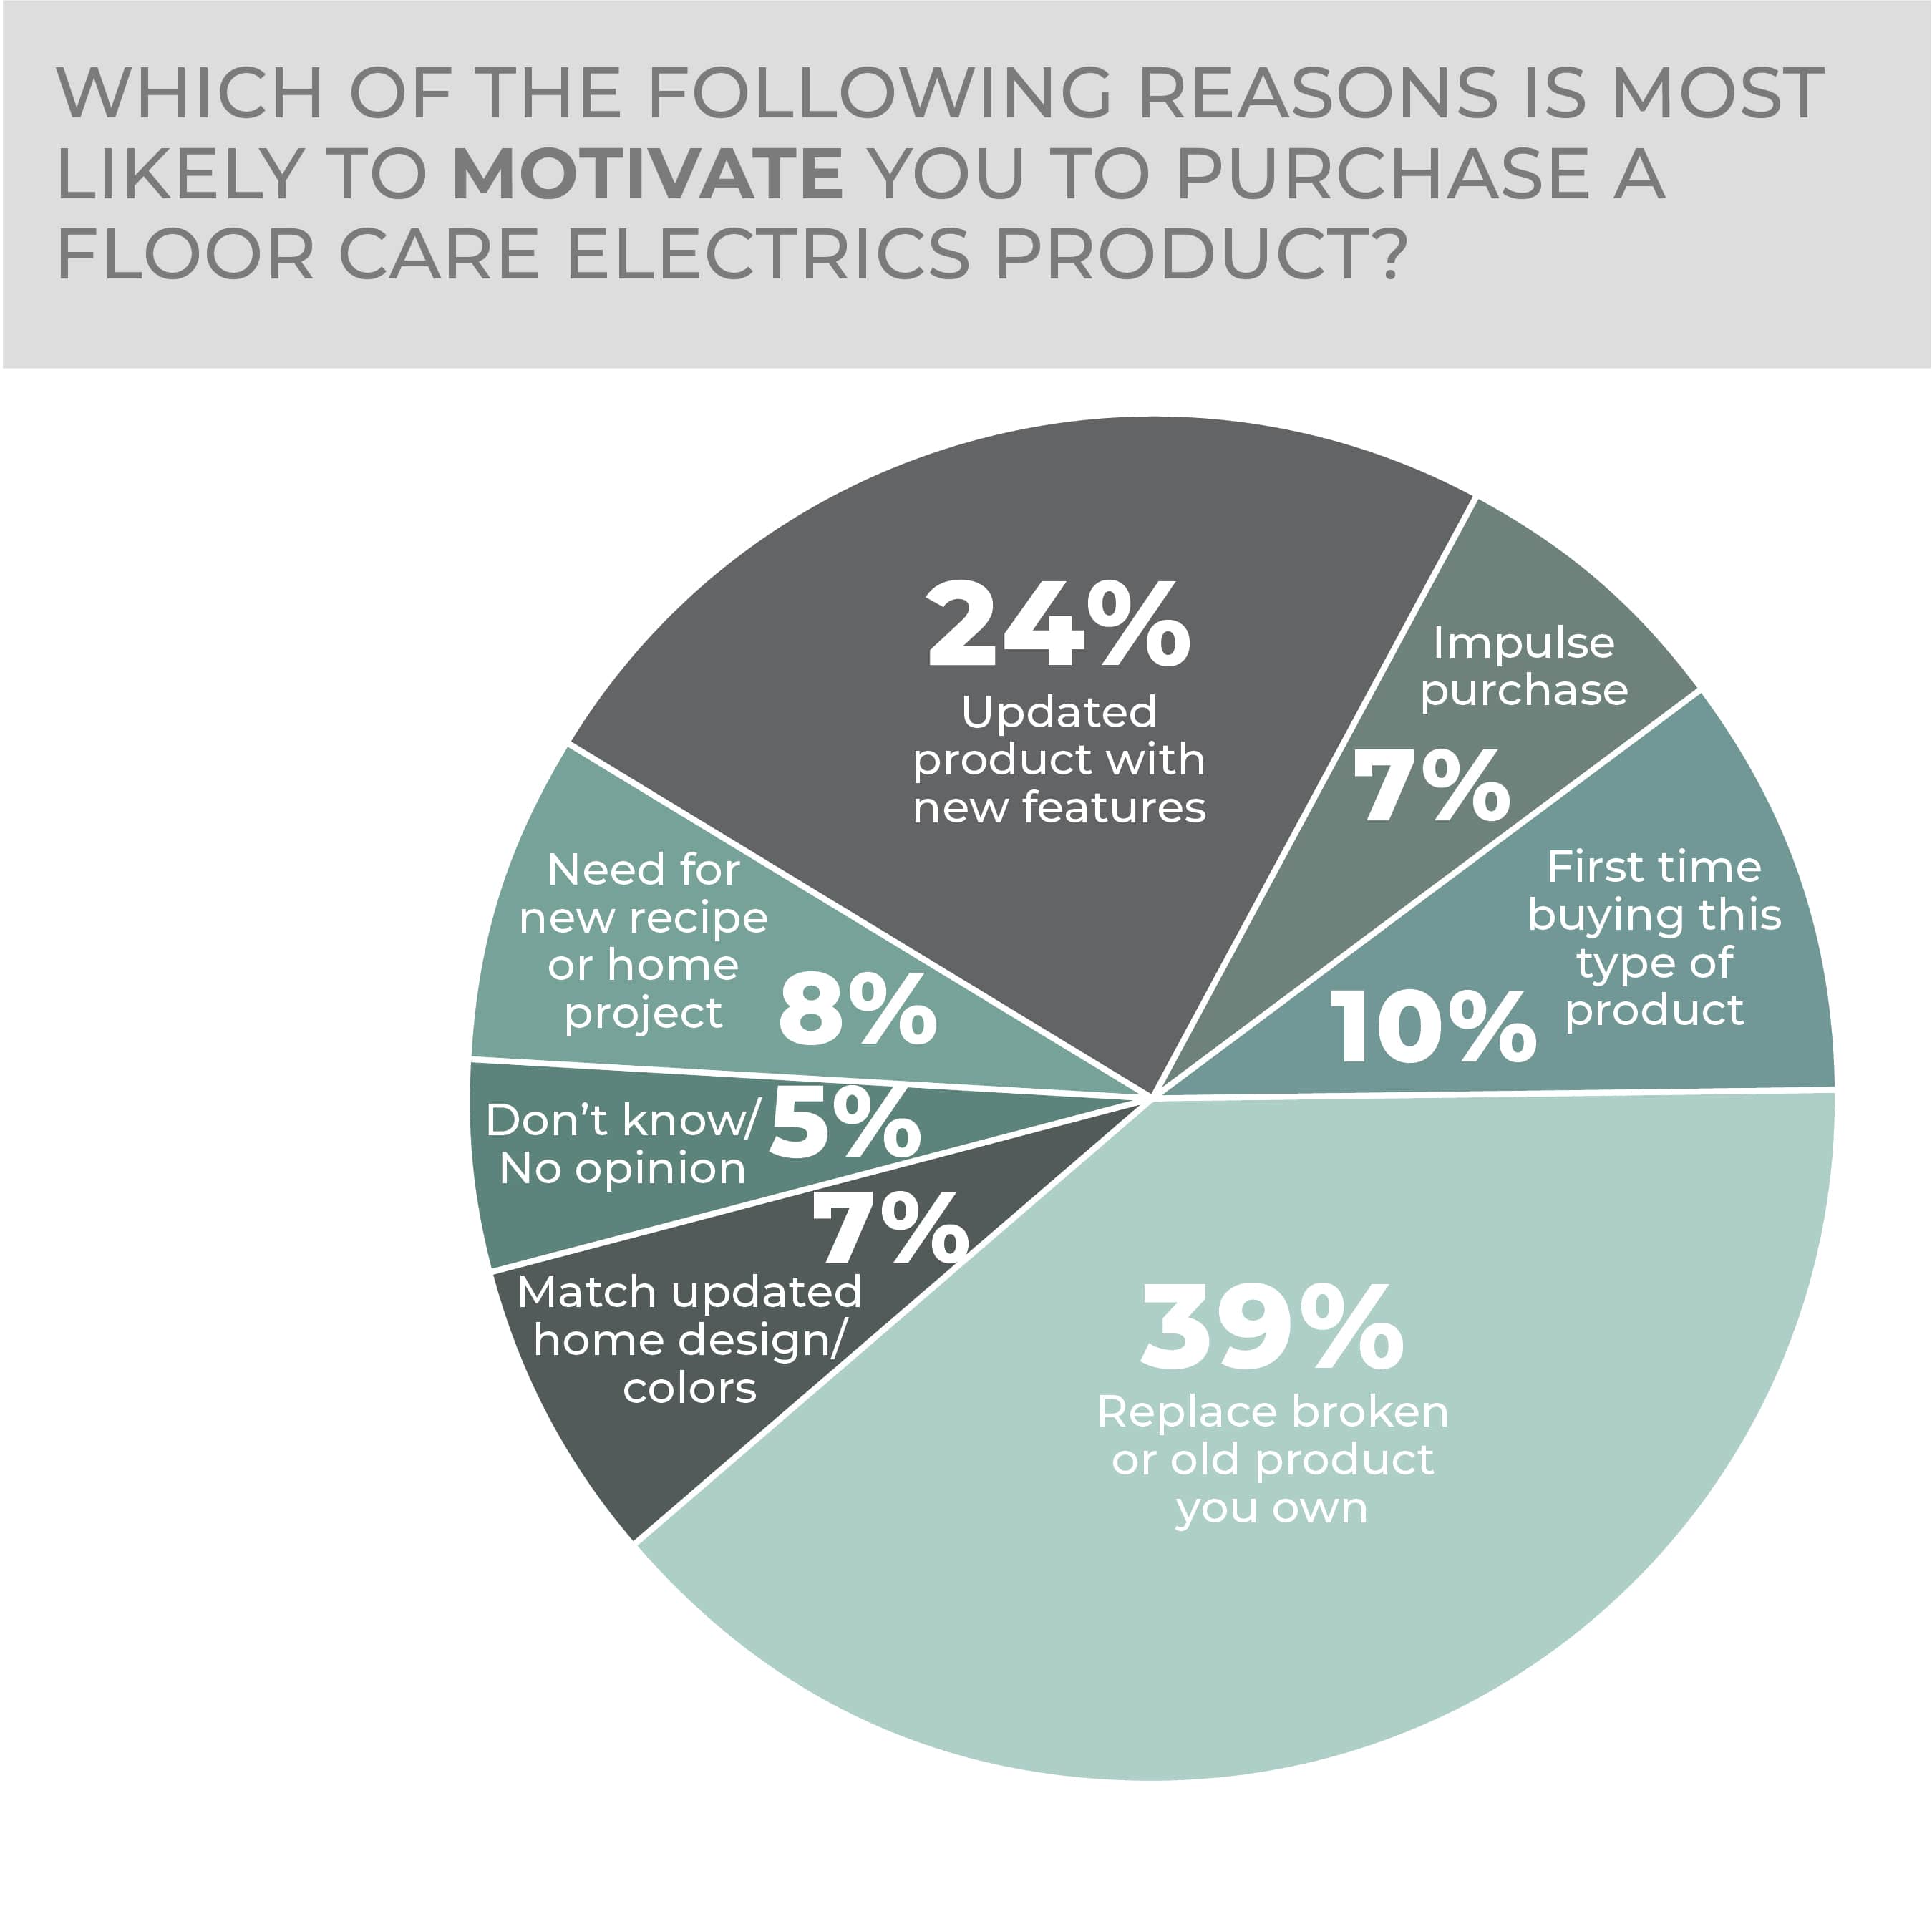
In the most recent survey, 10% of consumers said buying for the first time would be their reason to purchase, the third most likely reason to purchase and a significant proportion, but trailing replacing a broken or old item at 39%, up three points year over year, followed by trading up to a product with new features at 24%. The new features and first-time buying numbers were little changed from the previous survey.
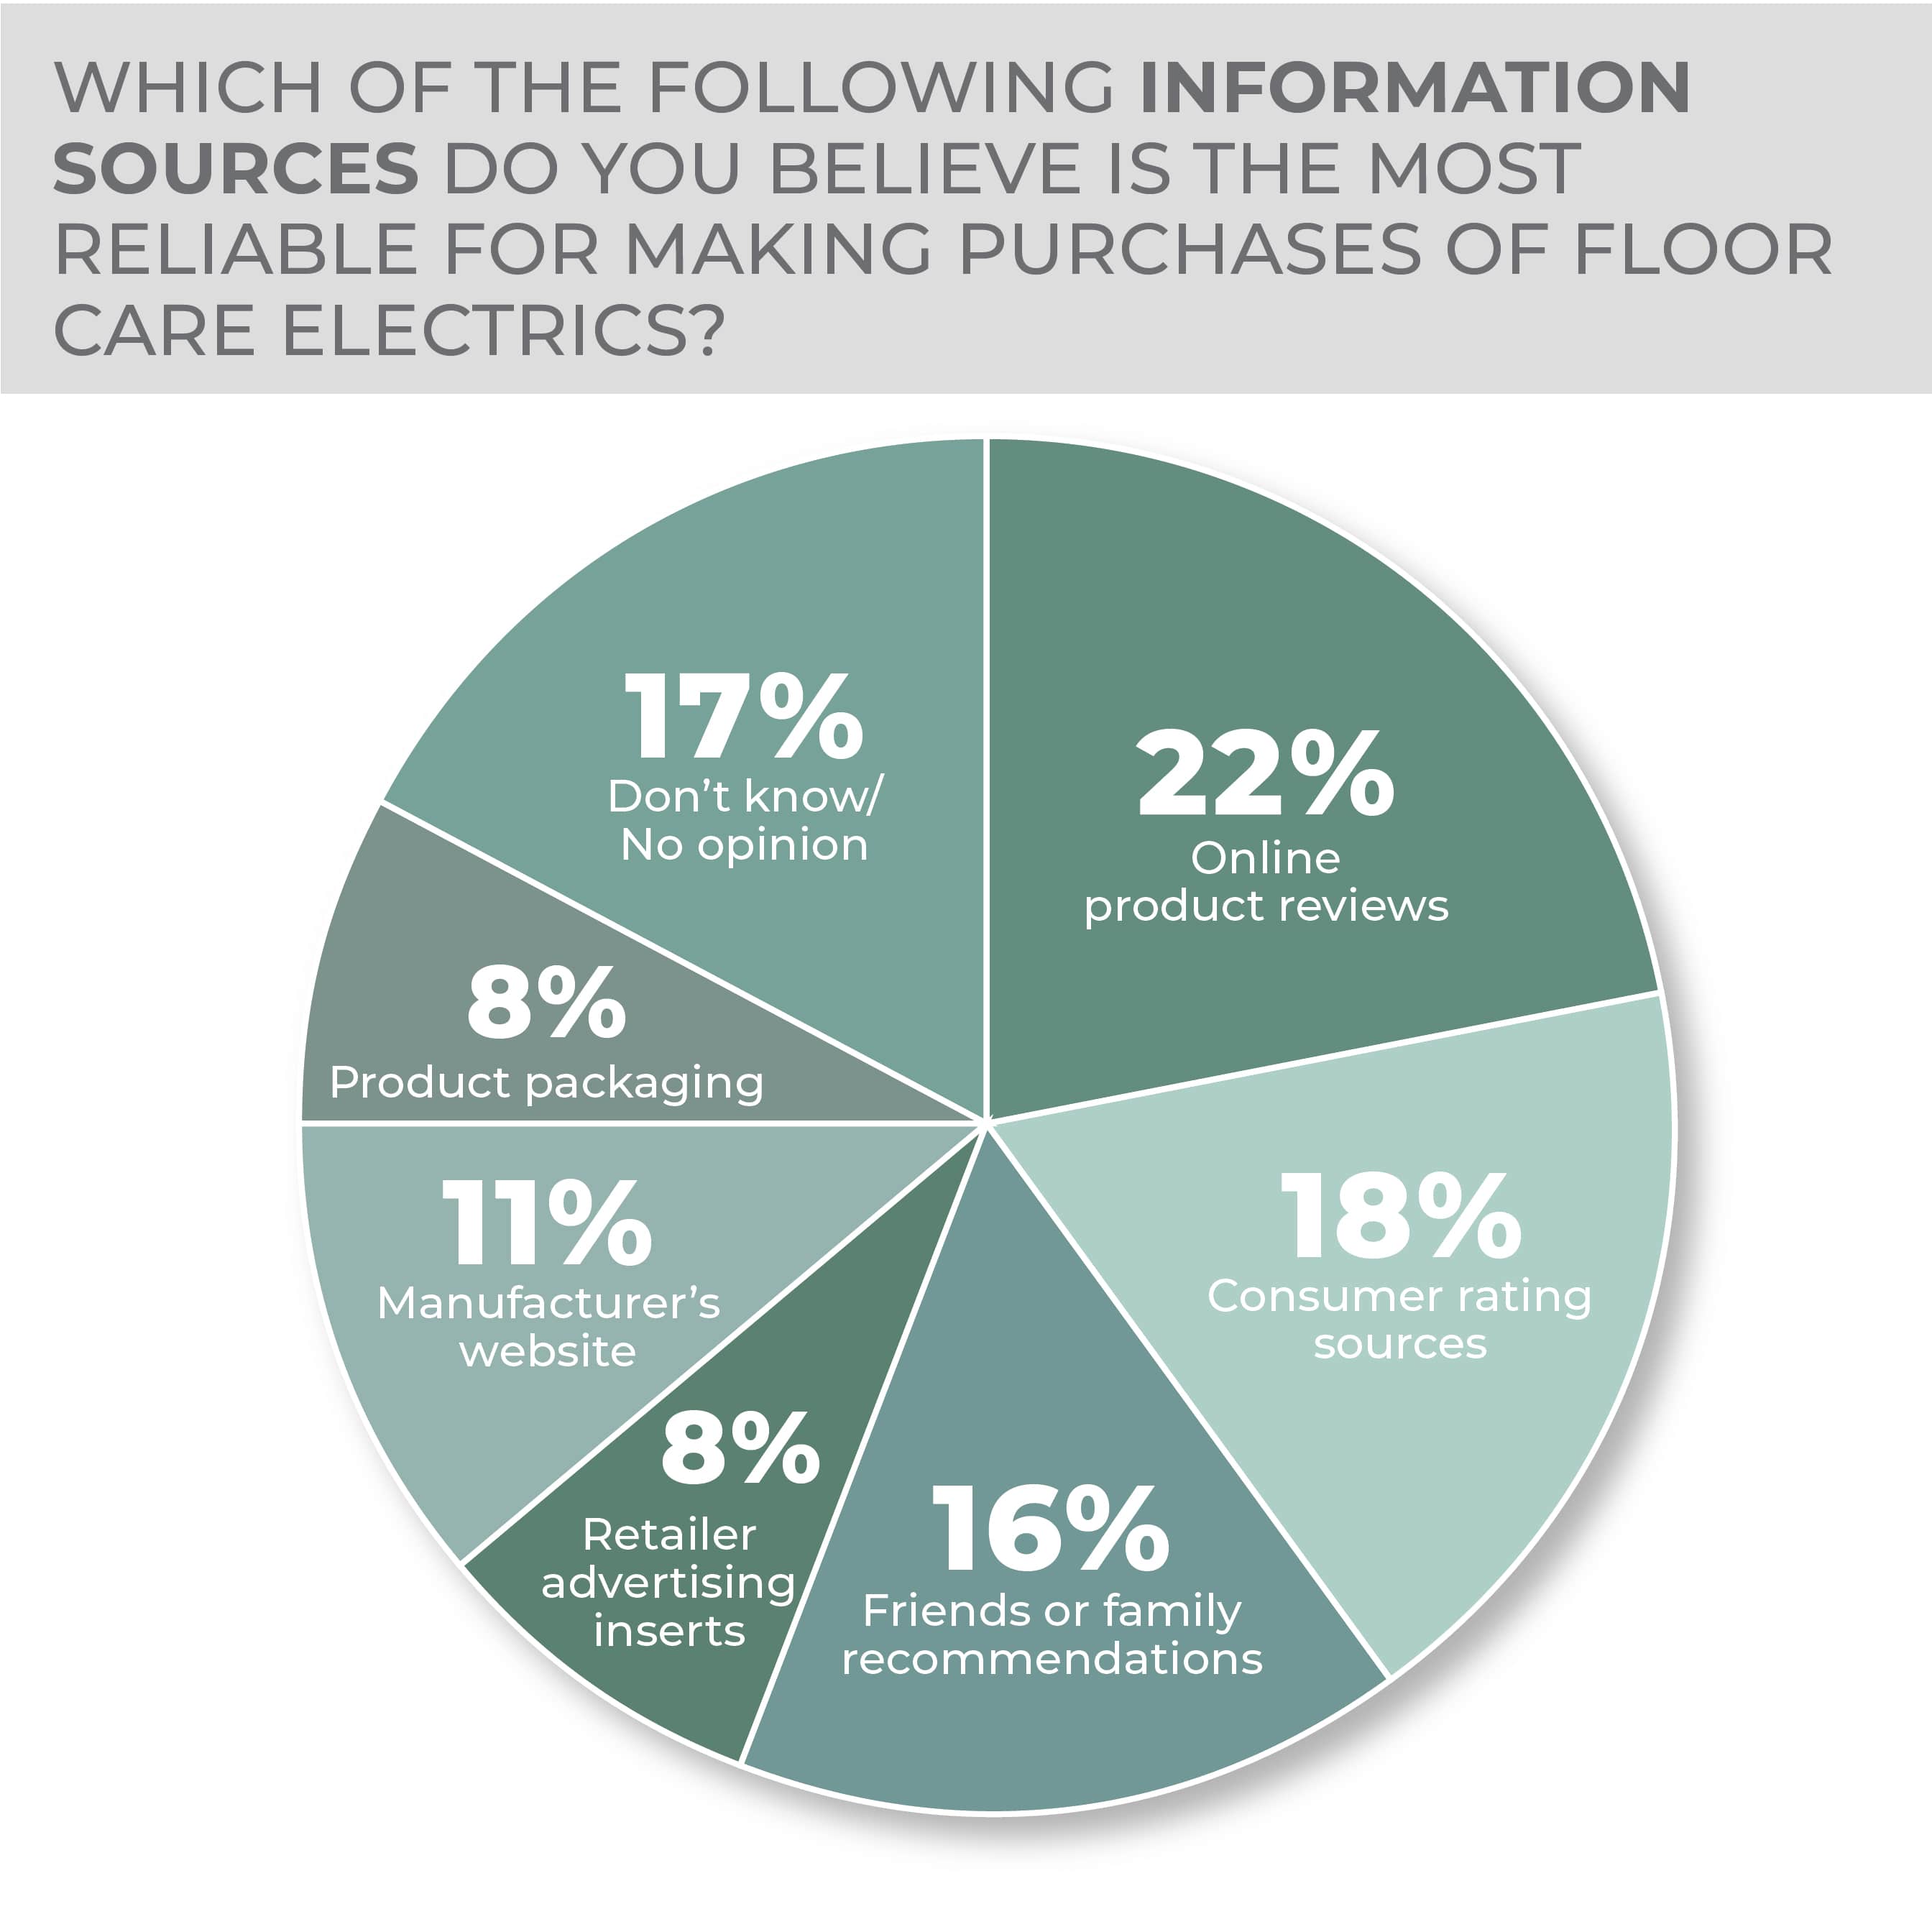
As for where they get their pre-purchase information, online product reviews at 22%, consumer rating sources, at 18%, and friends or family recommendations at 16%, all slid a bit year over year, with online reviews and family or friends’ recommendations stumbling most, down four points each. Meanwhile, retailer advertising inserts slipped slightly as a source of information, manufacturers’ websites gained slightly and product packaging improved by five points to 8% from the survey a year earlier.
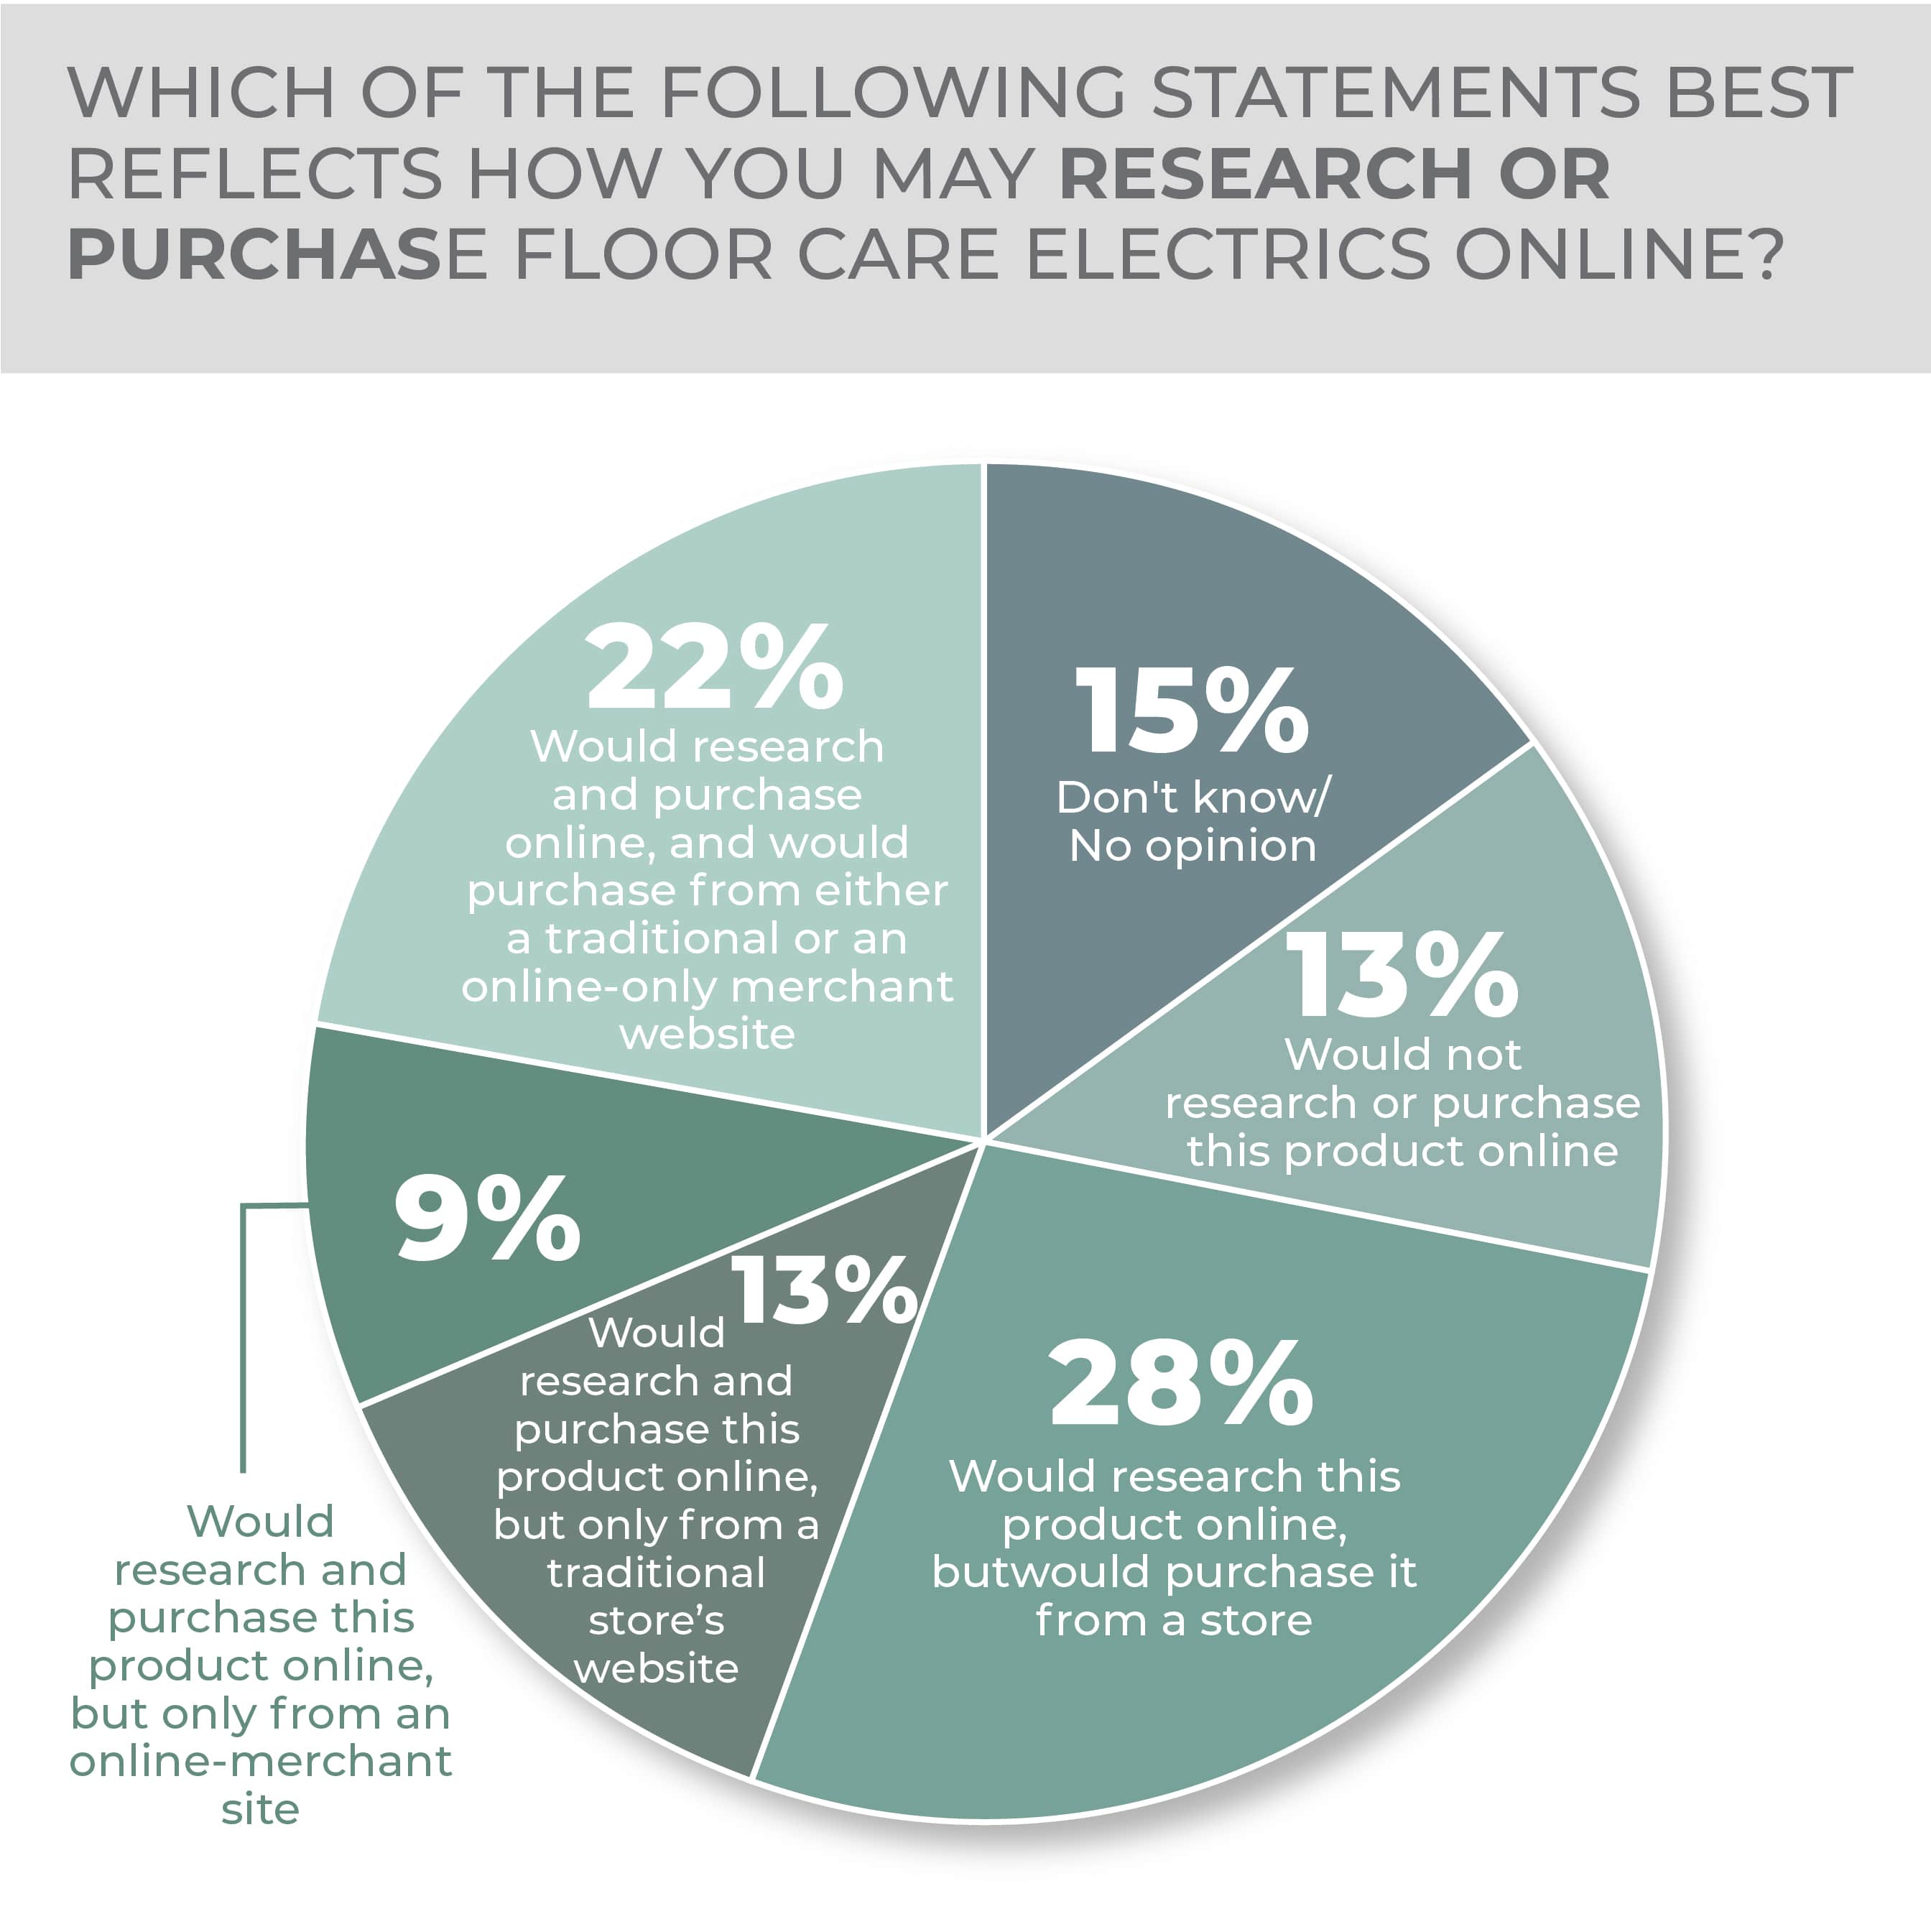
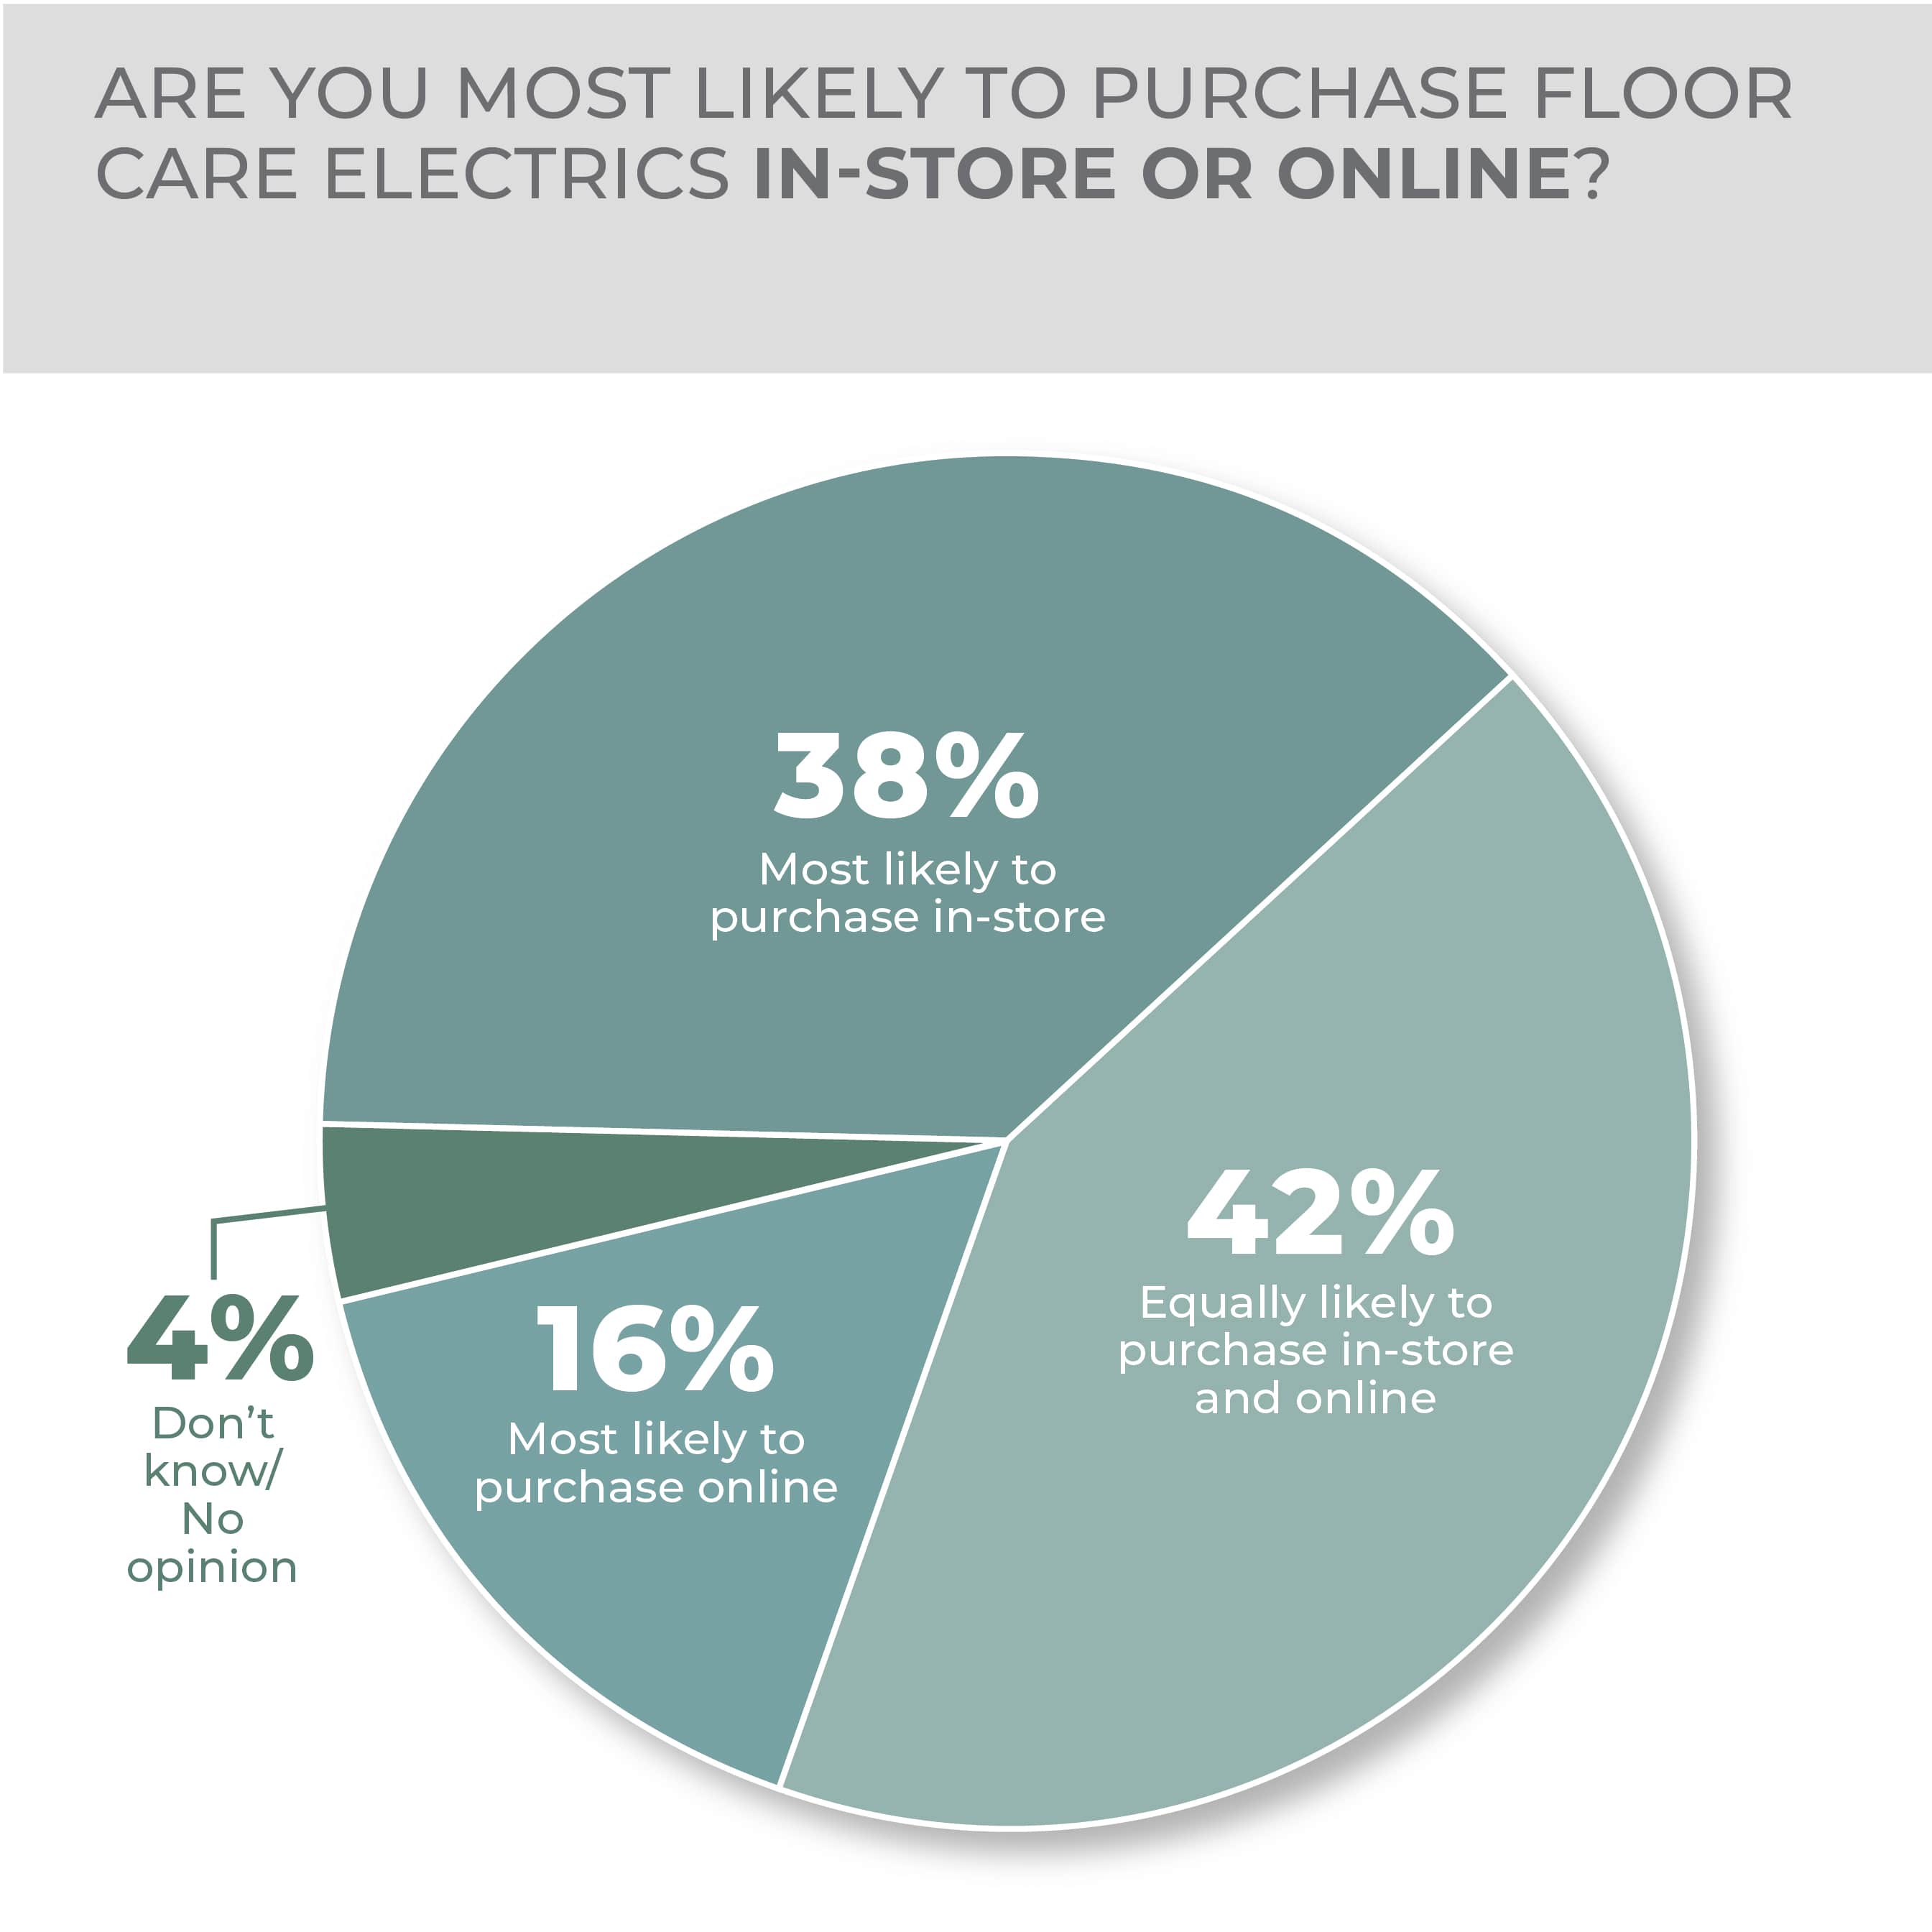
In general terms, consumers remained consistent year over year in how they would research and purchase a product, with 13% saying they would not research or purchase online and 28% saying they would research online and buy in a store— responses that favor brick-and-mortar retailers. 13% said they would research online and purchase from a traditional retailer, 9% said they would purchase online and buy from an online-only merchant and 22% said they would research online and buy at either a traditional or online-only digital merchant. When asked specifically where they would most likely buy, more consumers than might be thought wanted to keep their options open, as 38% said in-store, 42% said in-store or online and 16% said only on the internet.
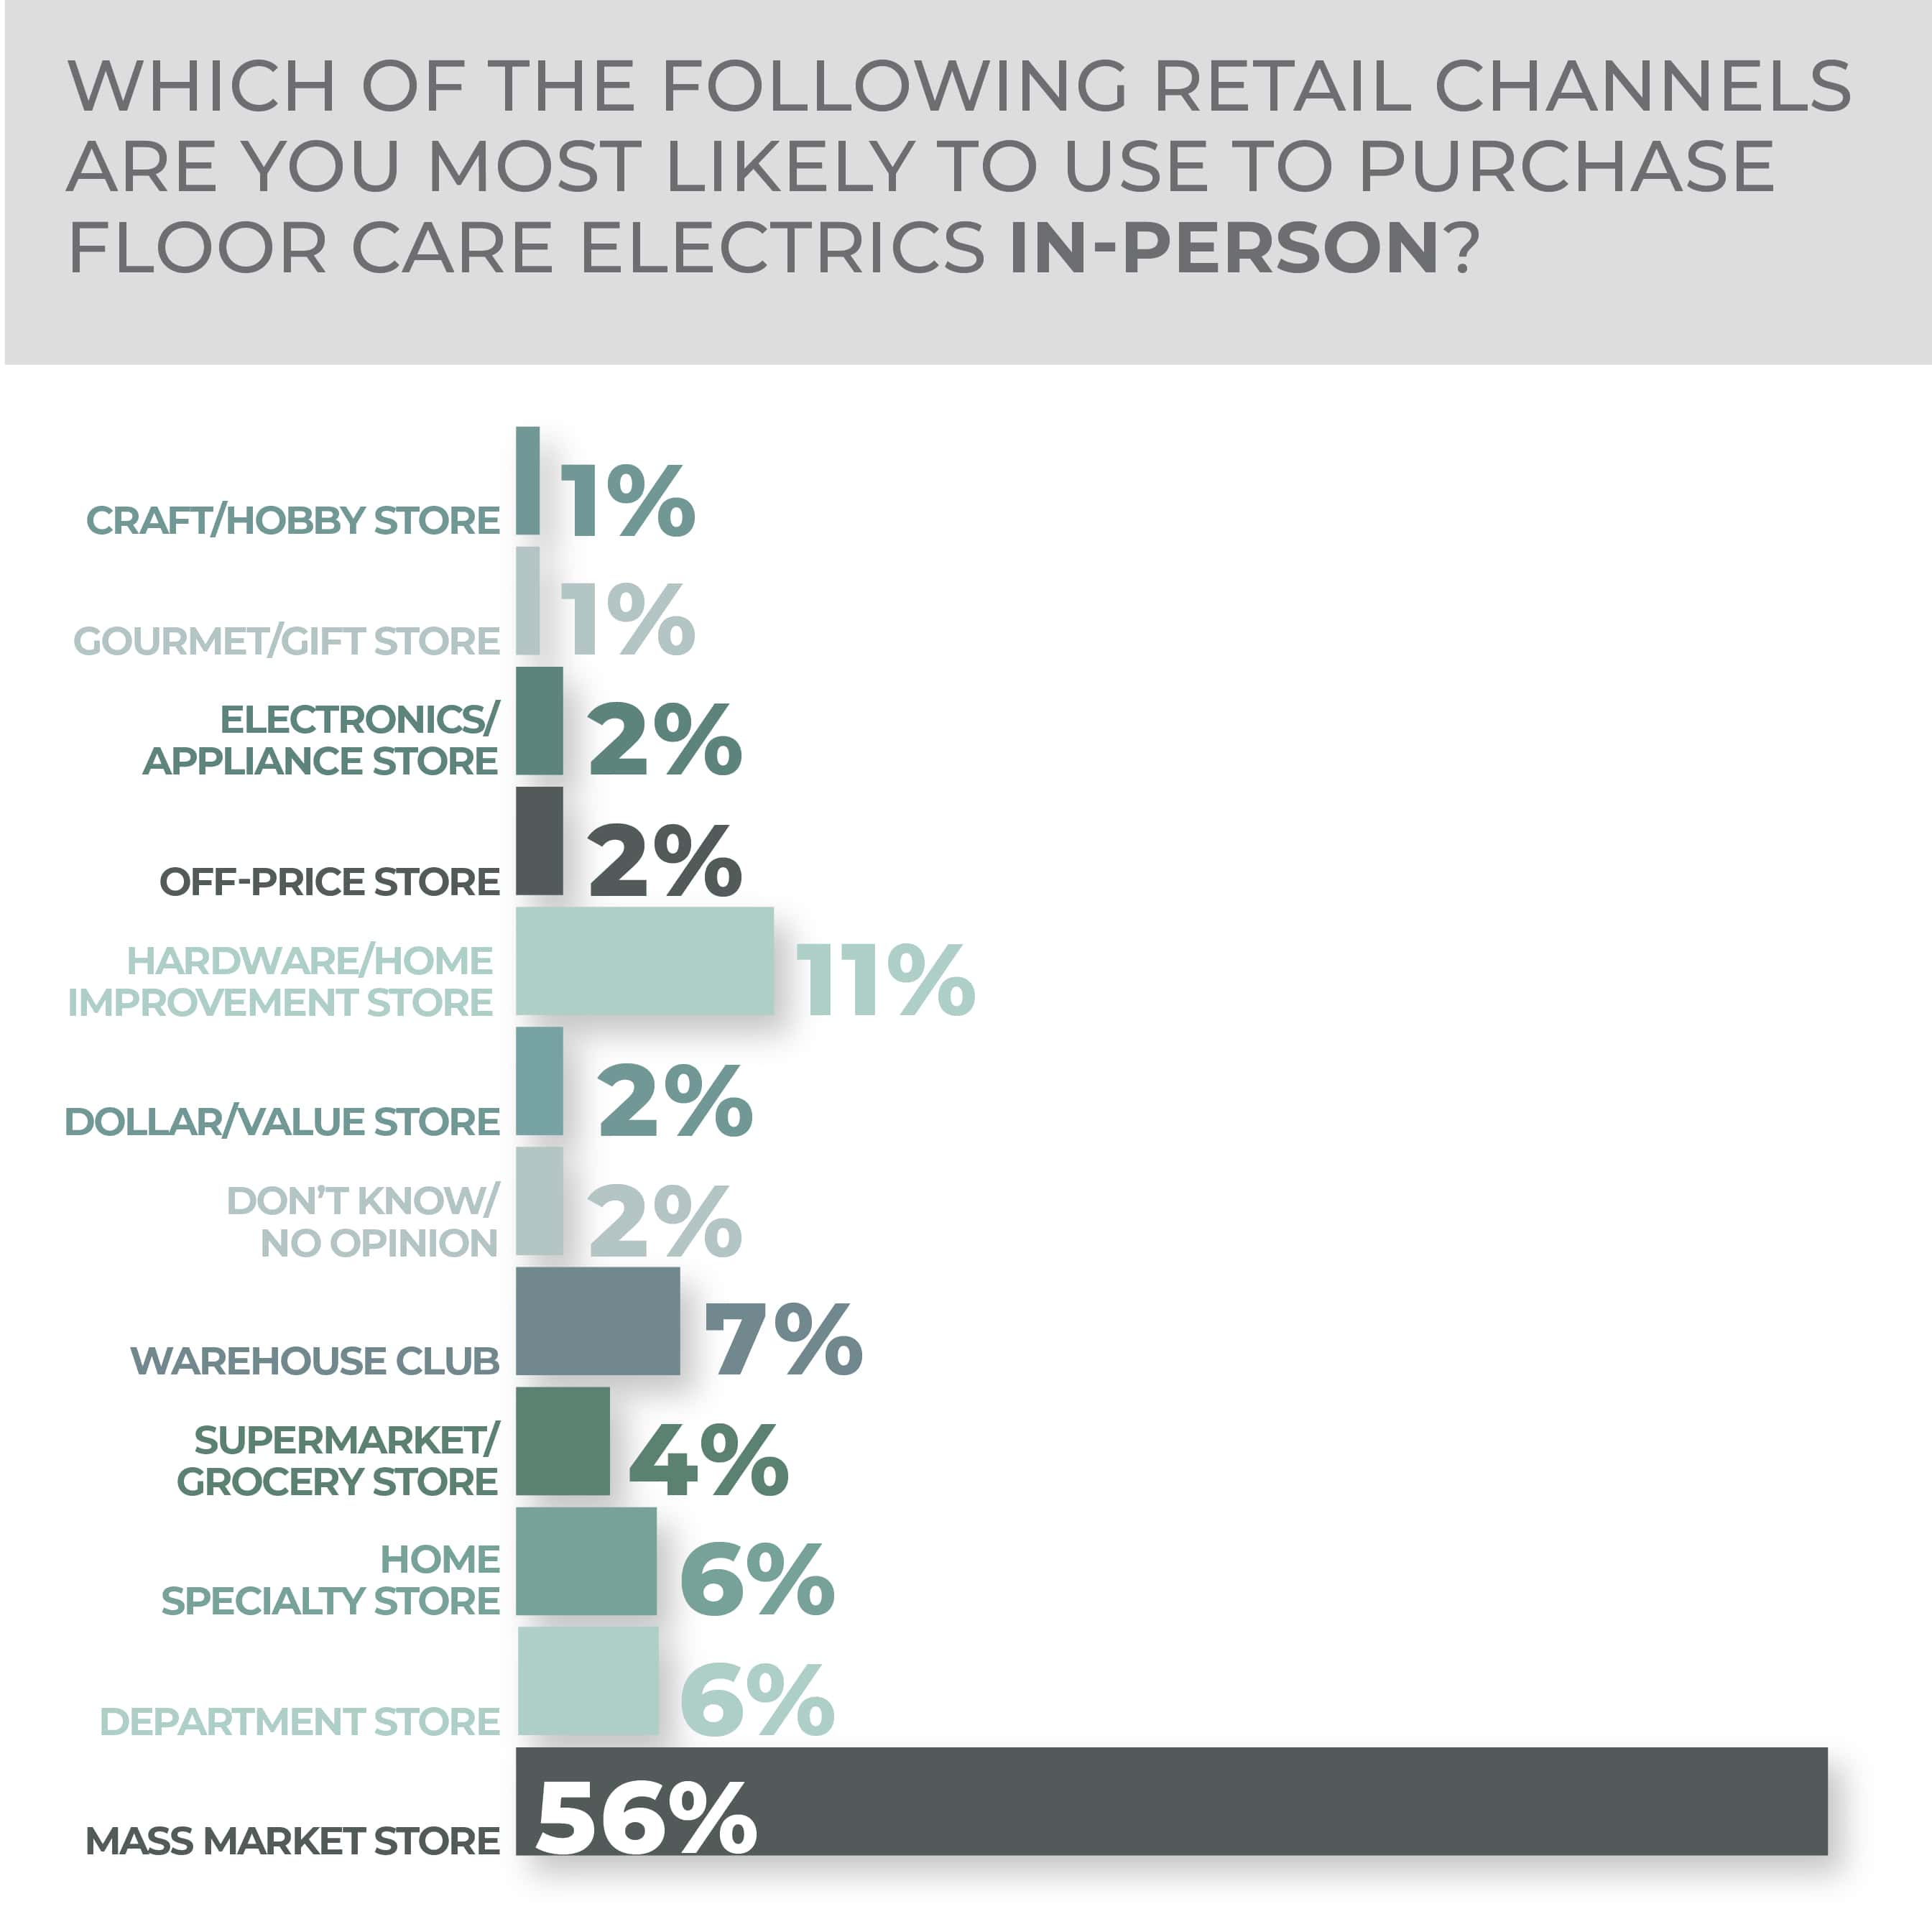
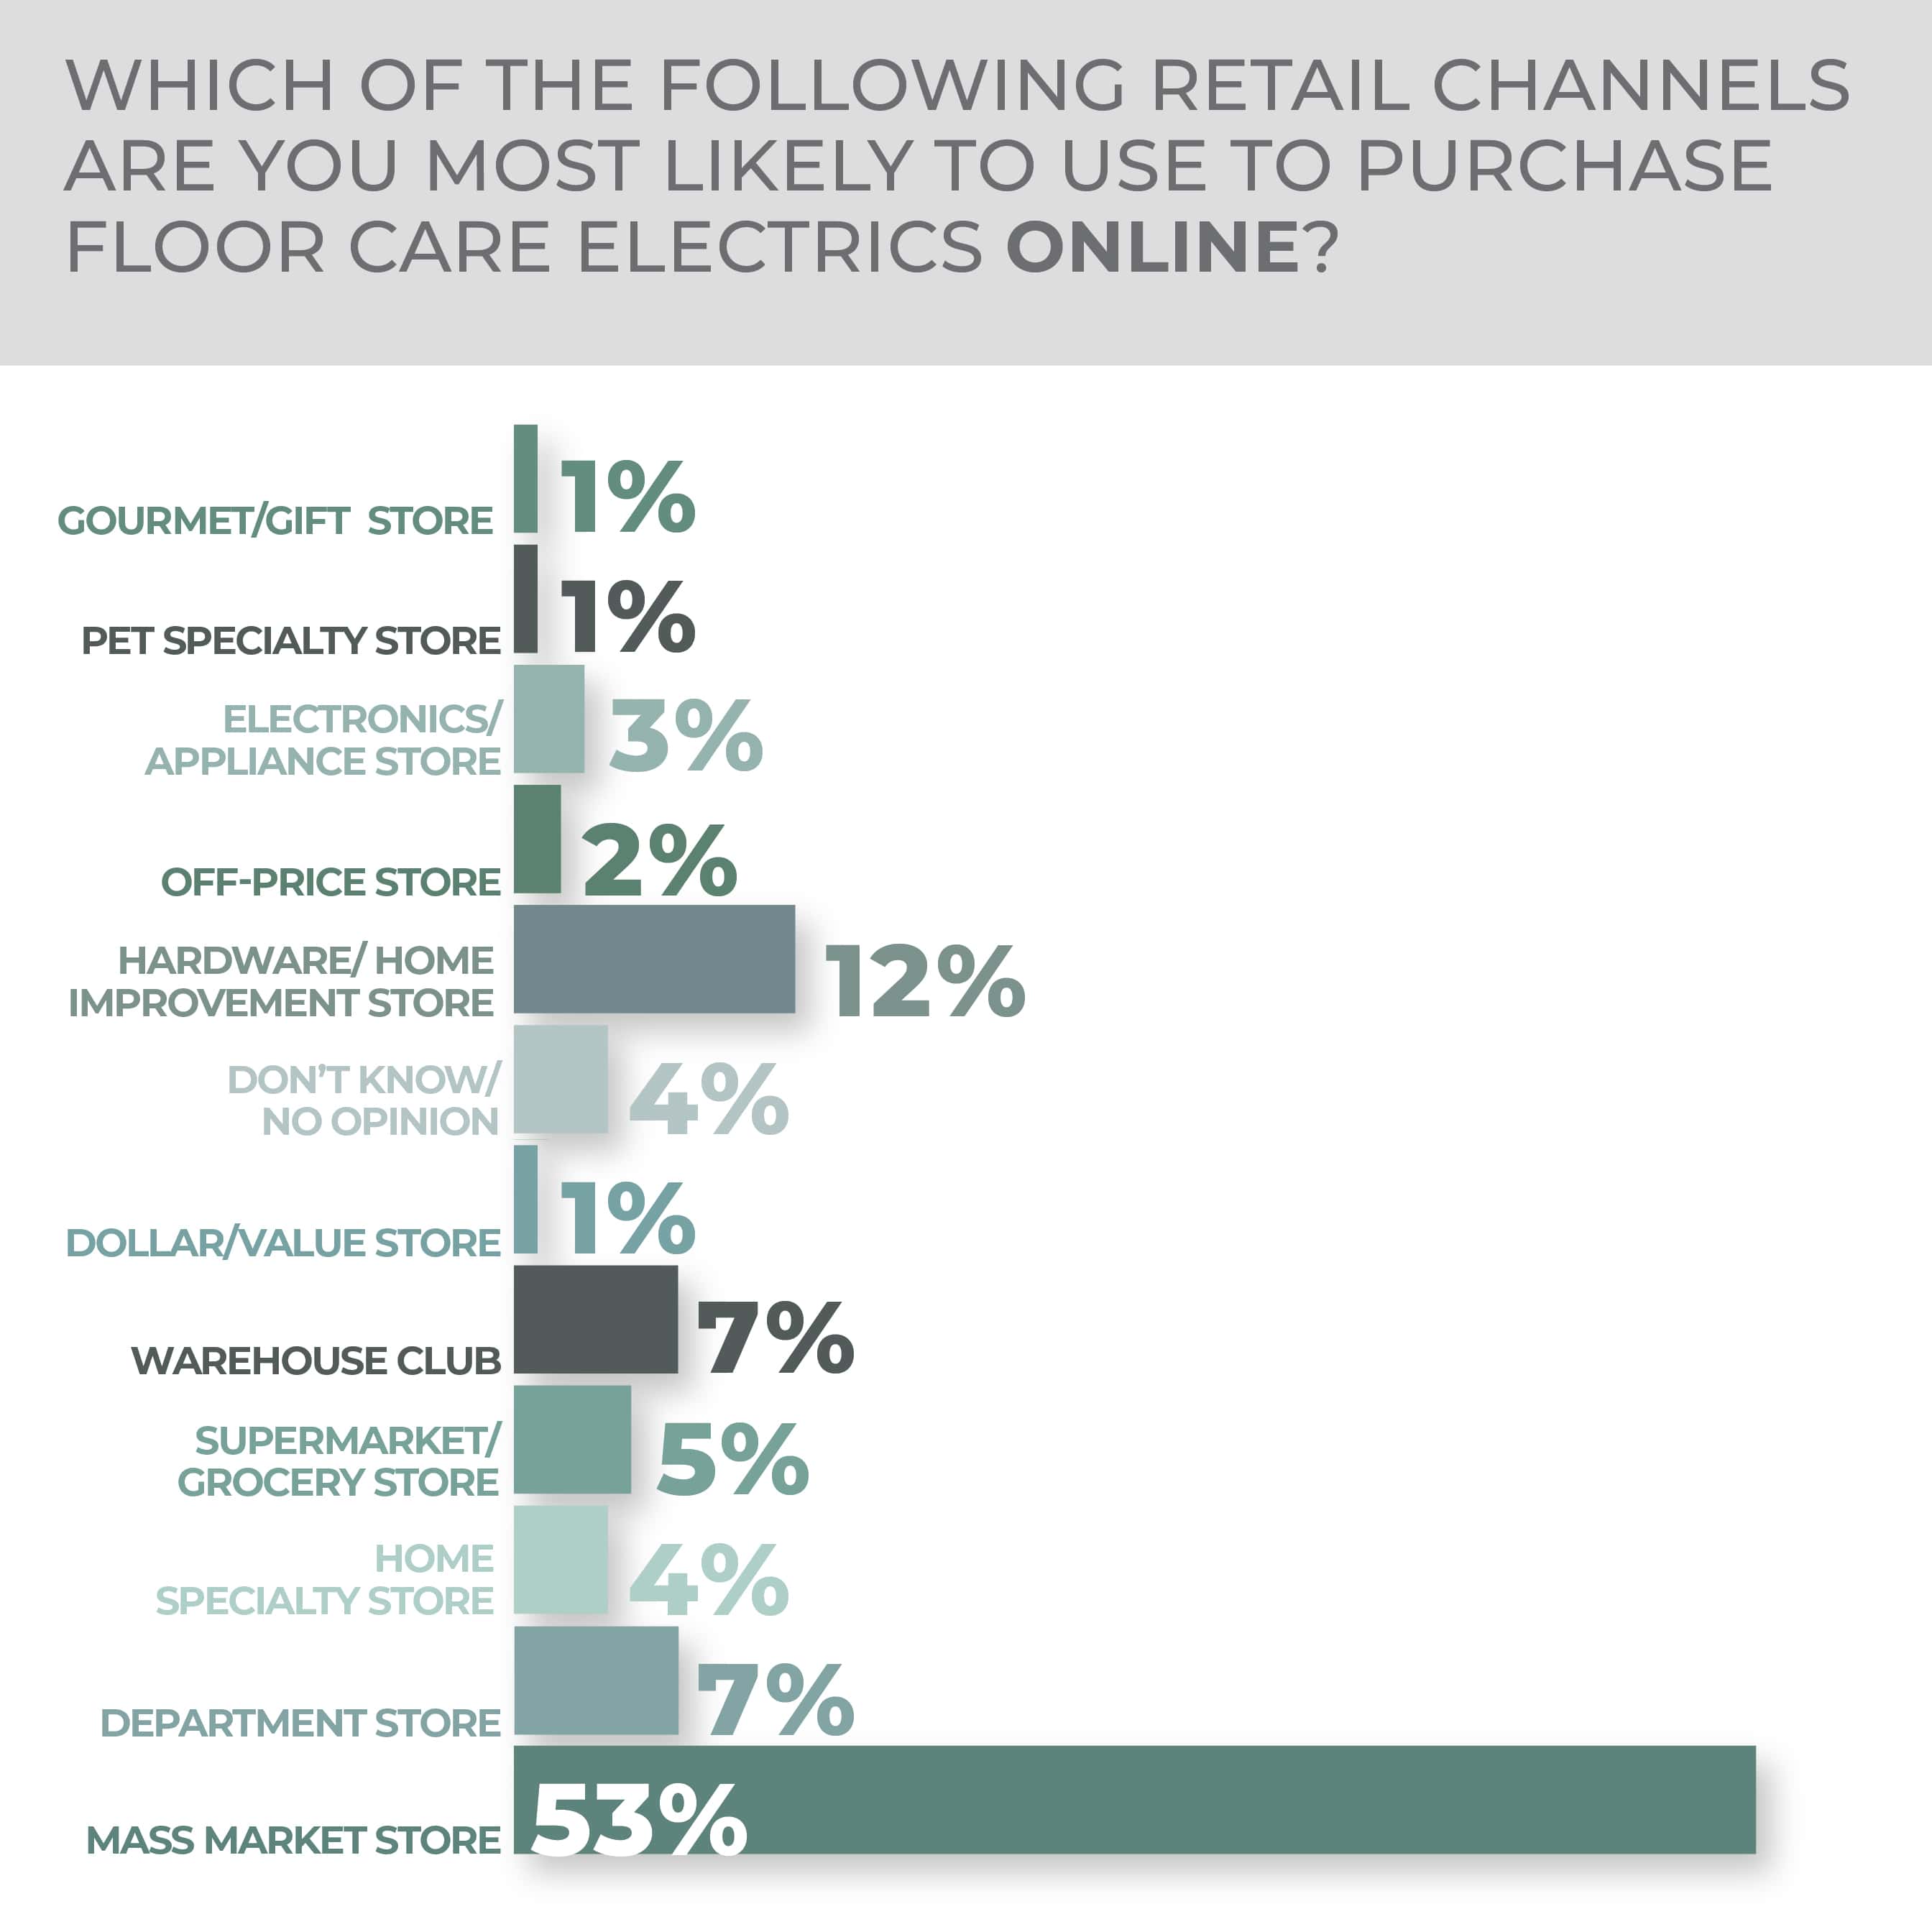
Mass marketers, at 56%, are the overwhelming in-person purchase choice among retailers, but second place, hardware and home improvement stores at 11%, is a little stronger in this case than it is in some Outlook product categories. In a similar vein, for online purchases, mass merchants lead at 53% and hardware and home improvement stores follow at 12%.
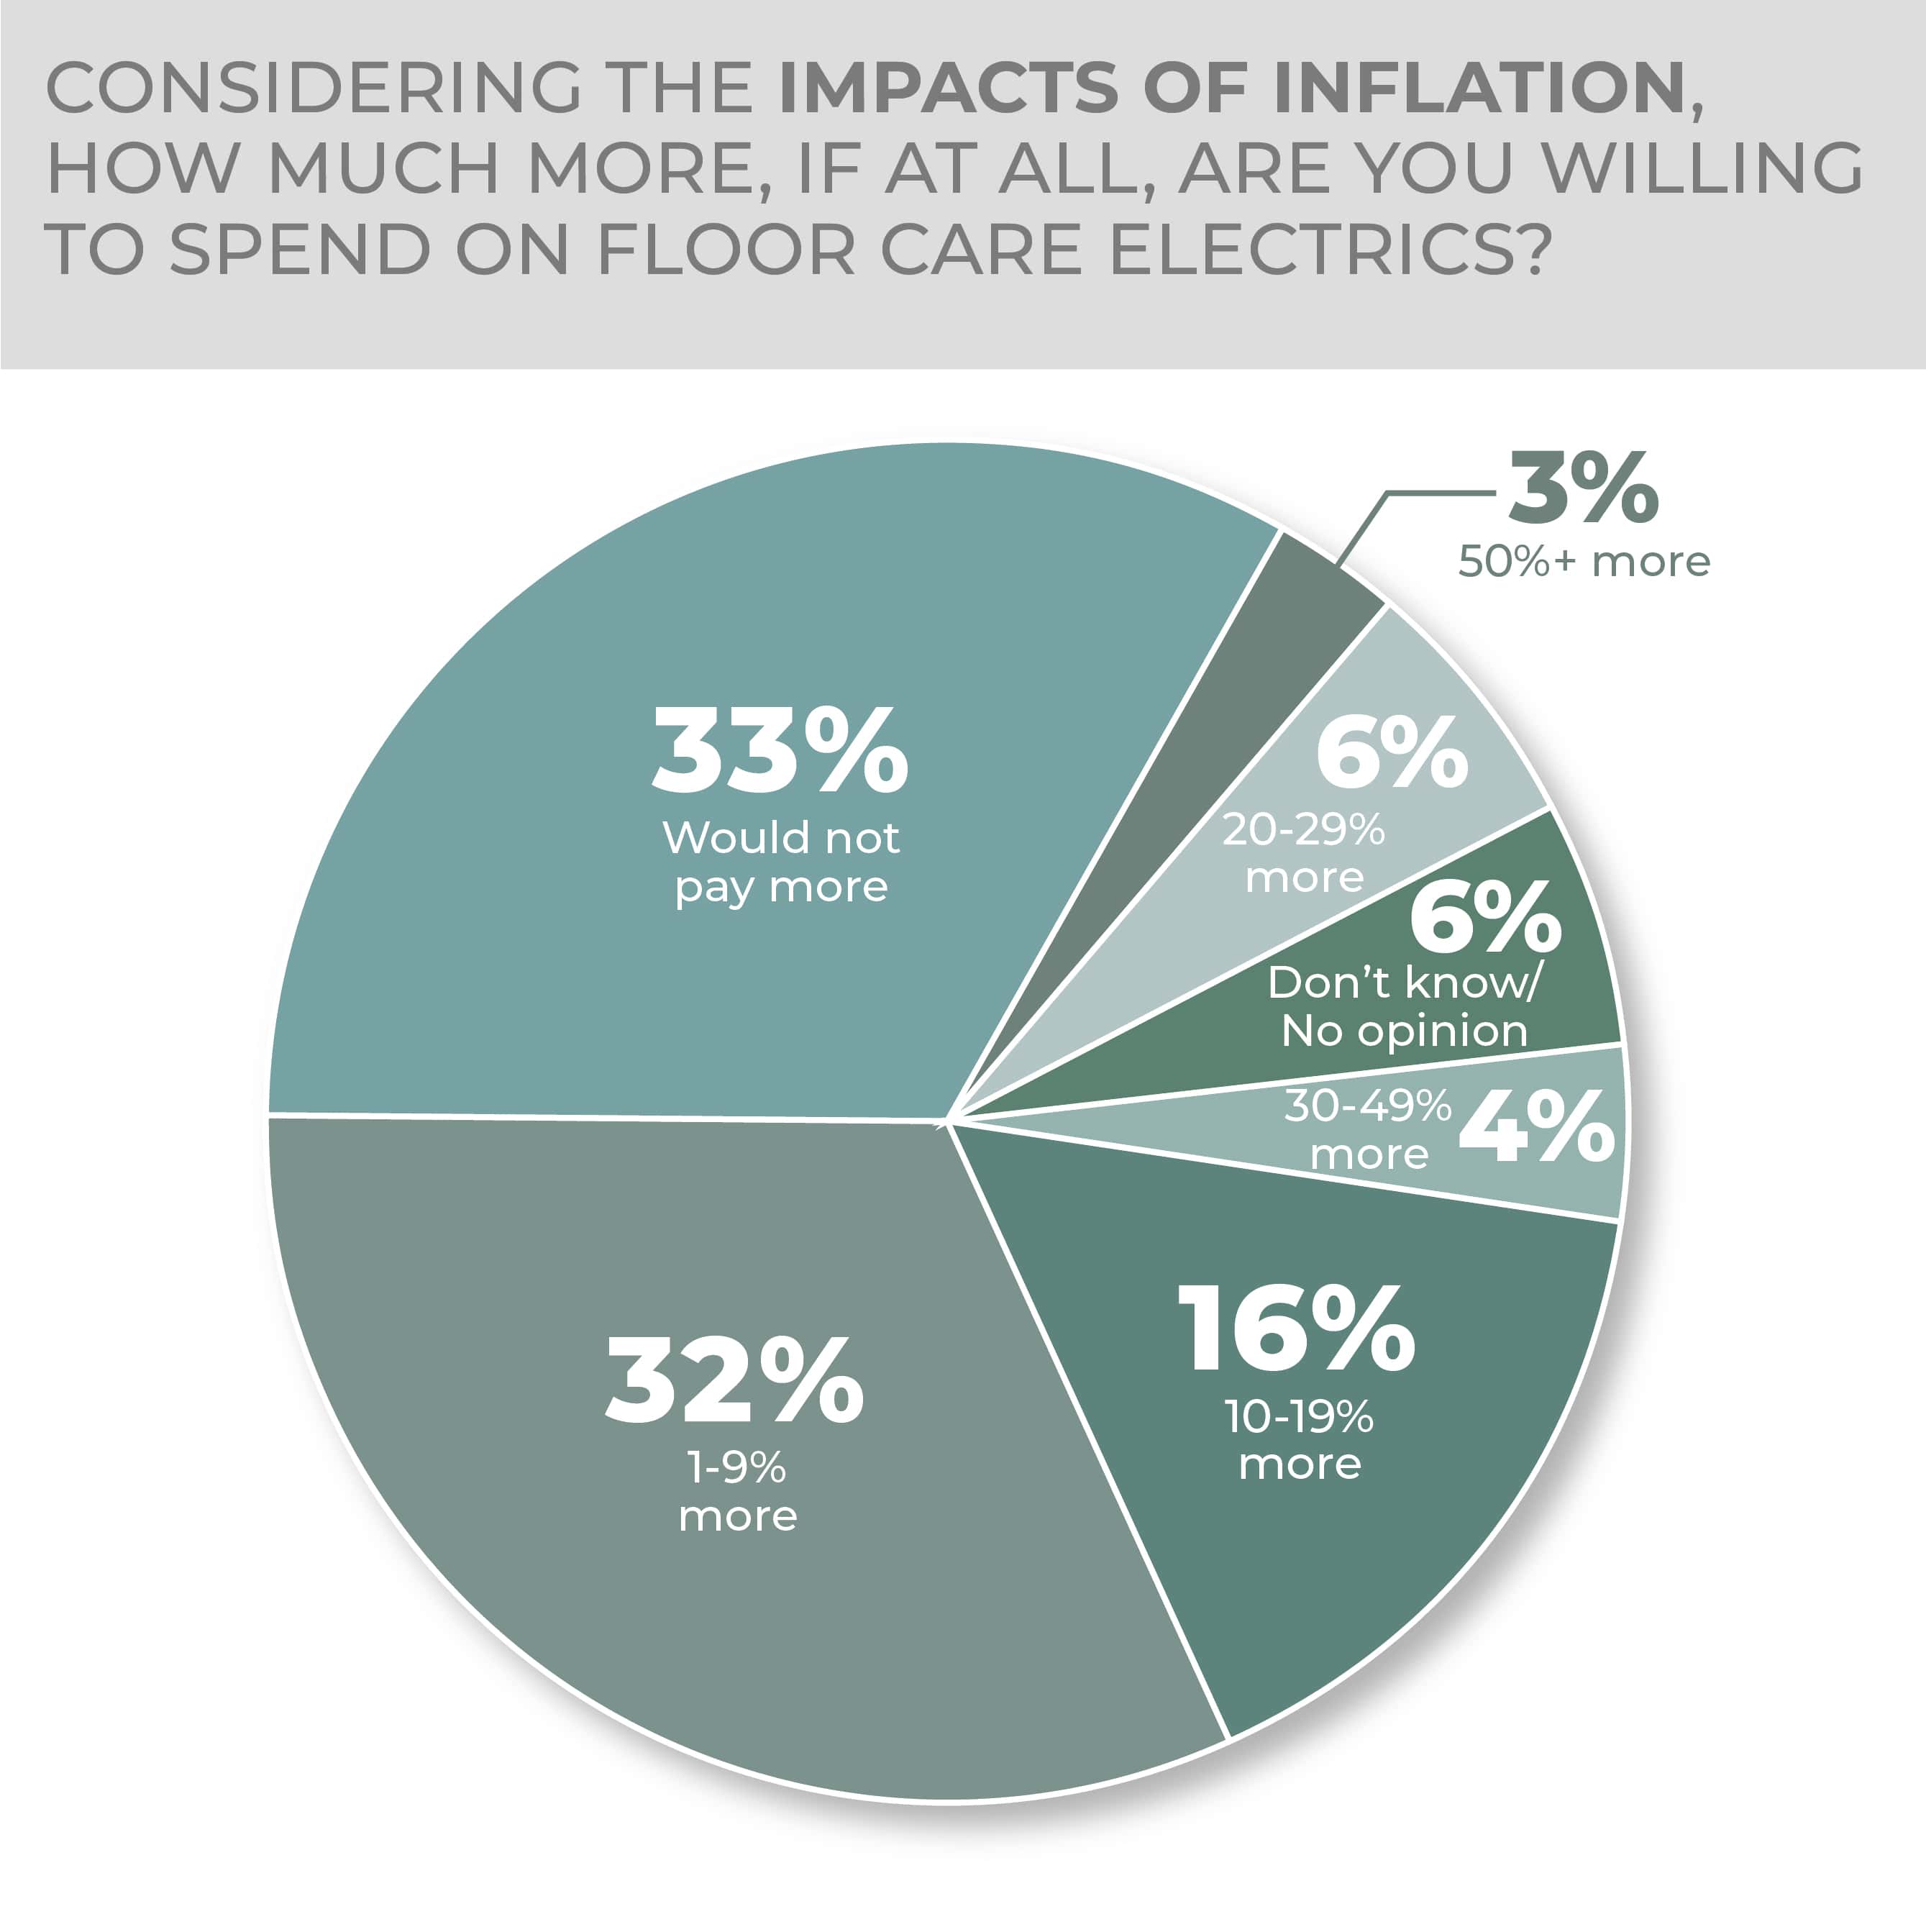
Survey respondents were more forgiving in pricing terms when it comes to floor care versus some other Outlook categories, and, although a third would pay no more for a product than they might have in the past, 32% said they would pay 1% to 9% more, and 16% said they would pay 10% to 19% more, with other choices at 6% or less.
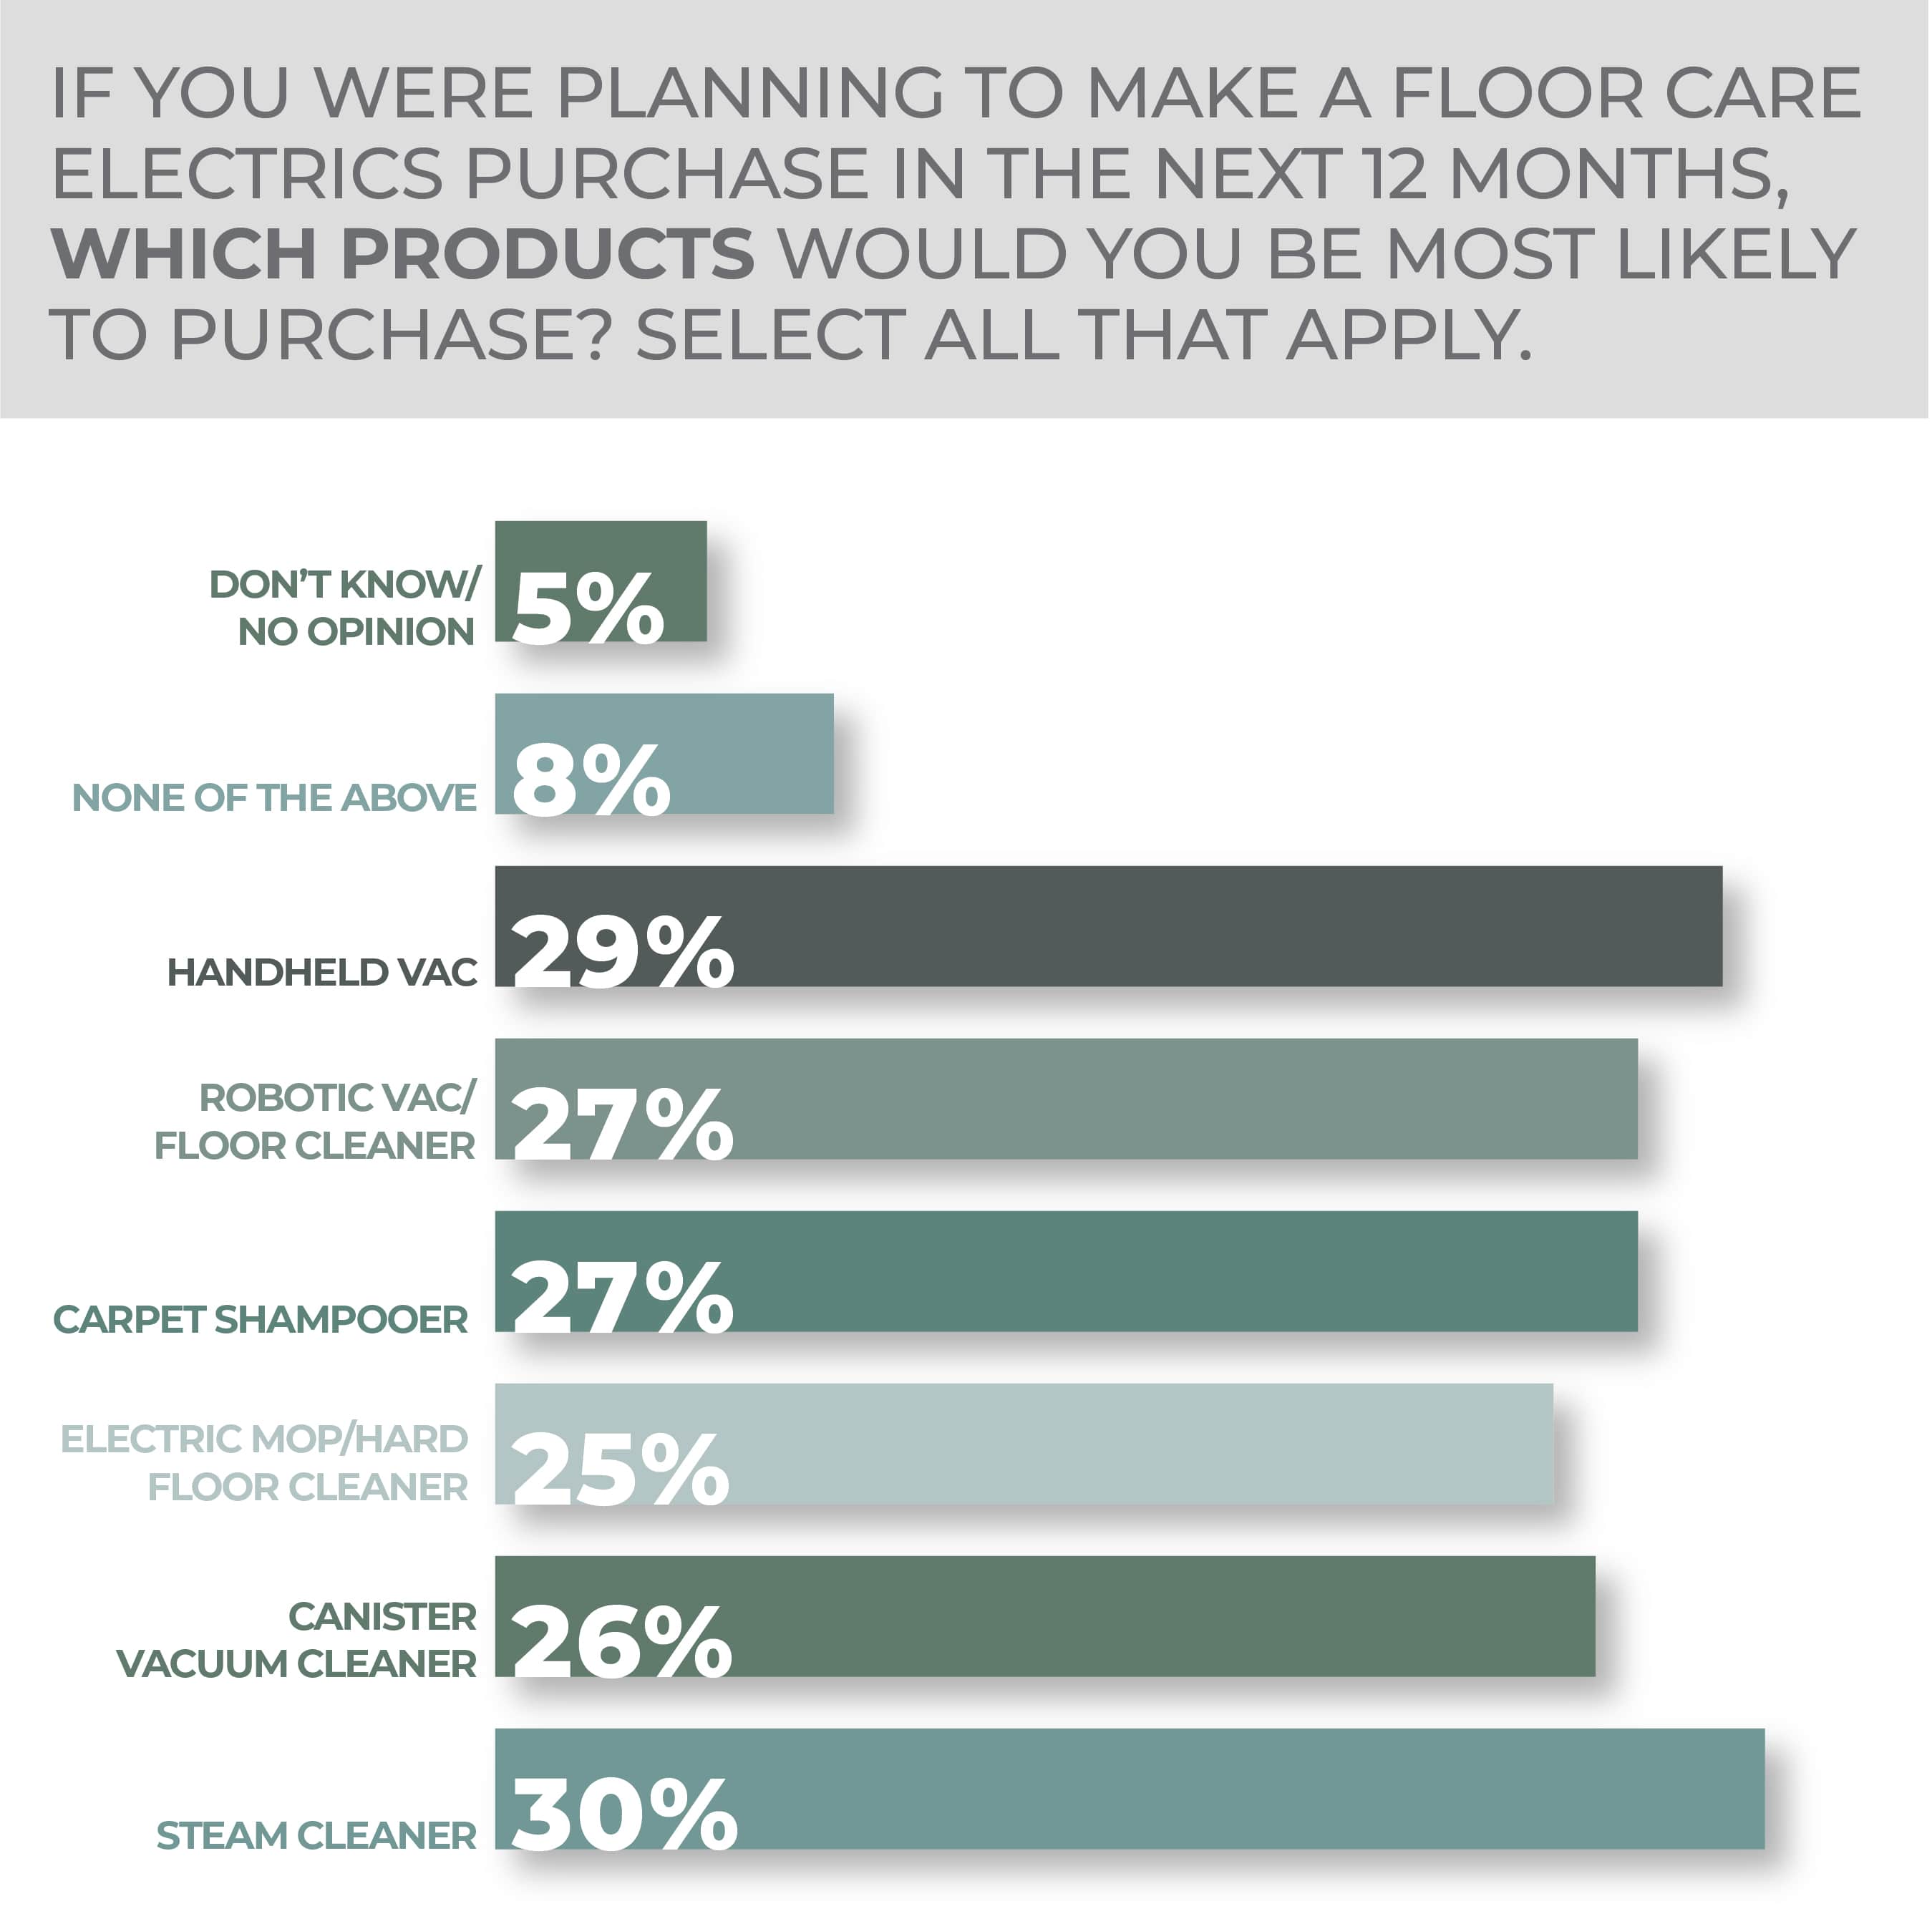
Respondents asked to choose what they might purchase over the next 12 months were most likely to say steam cleaner at 30%, followed by hand vacuum at 29%. After those comes a carpet shampooer at 27% in a tie with a robotic vac/floor cleaner, a canister vacuum cleaner at 26% and an electric mop/hard floor cleaner at 25%.
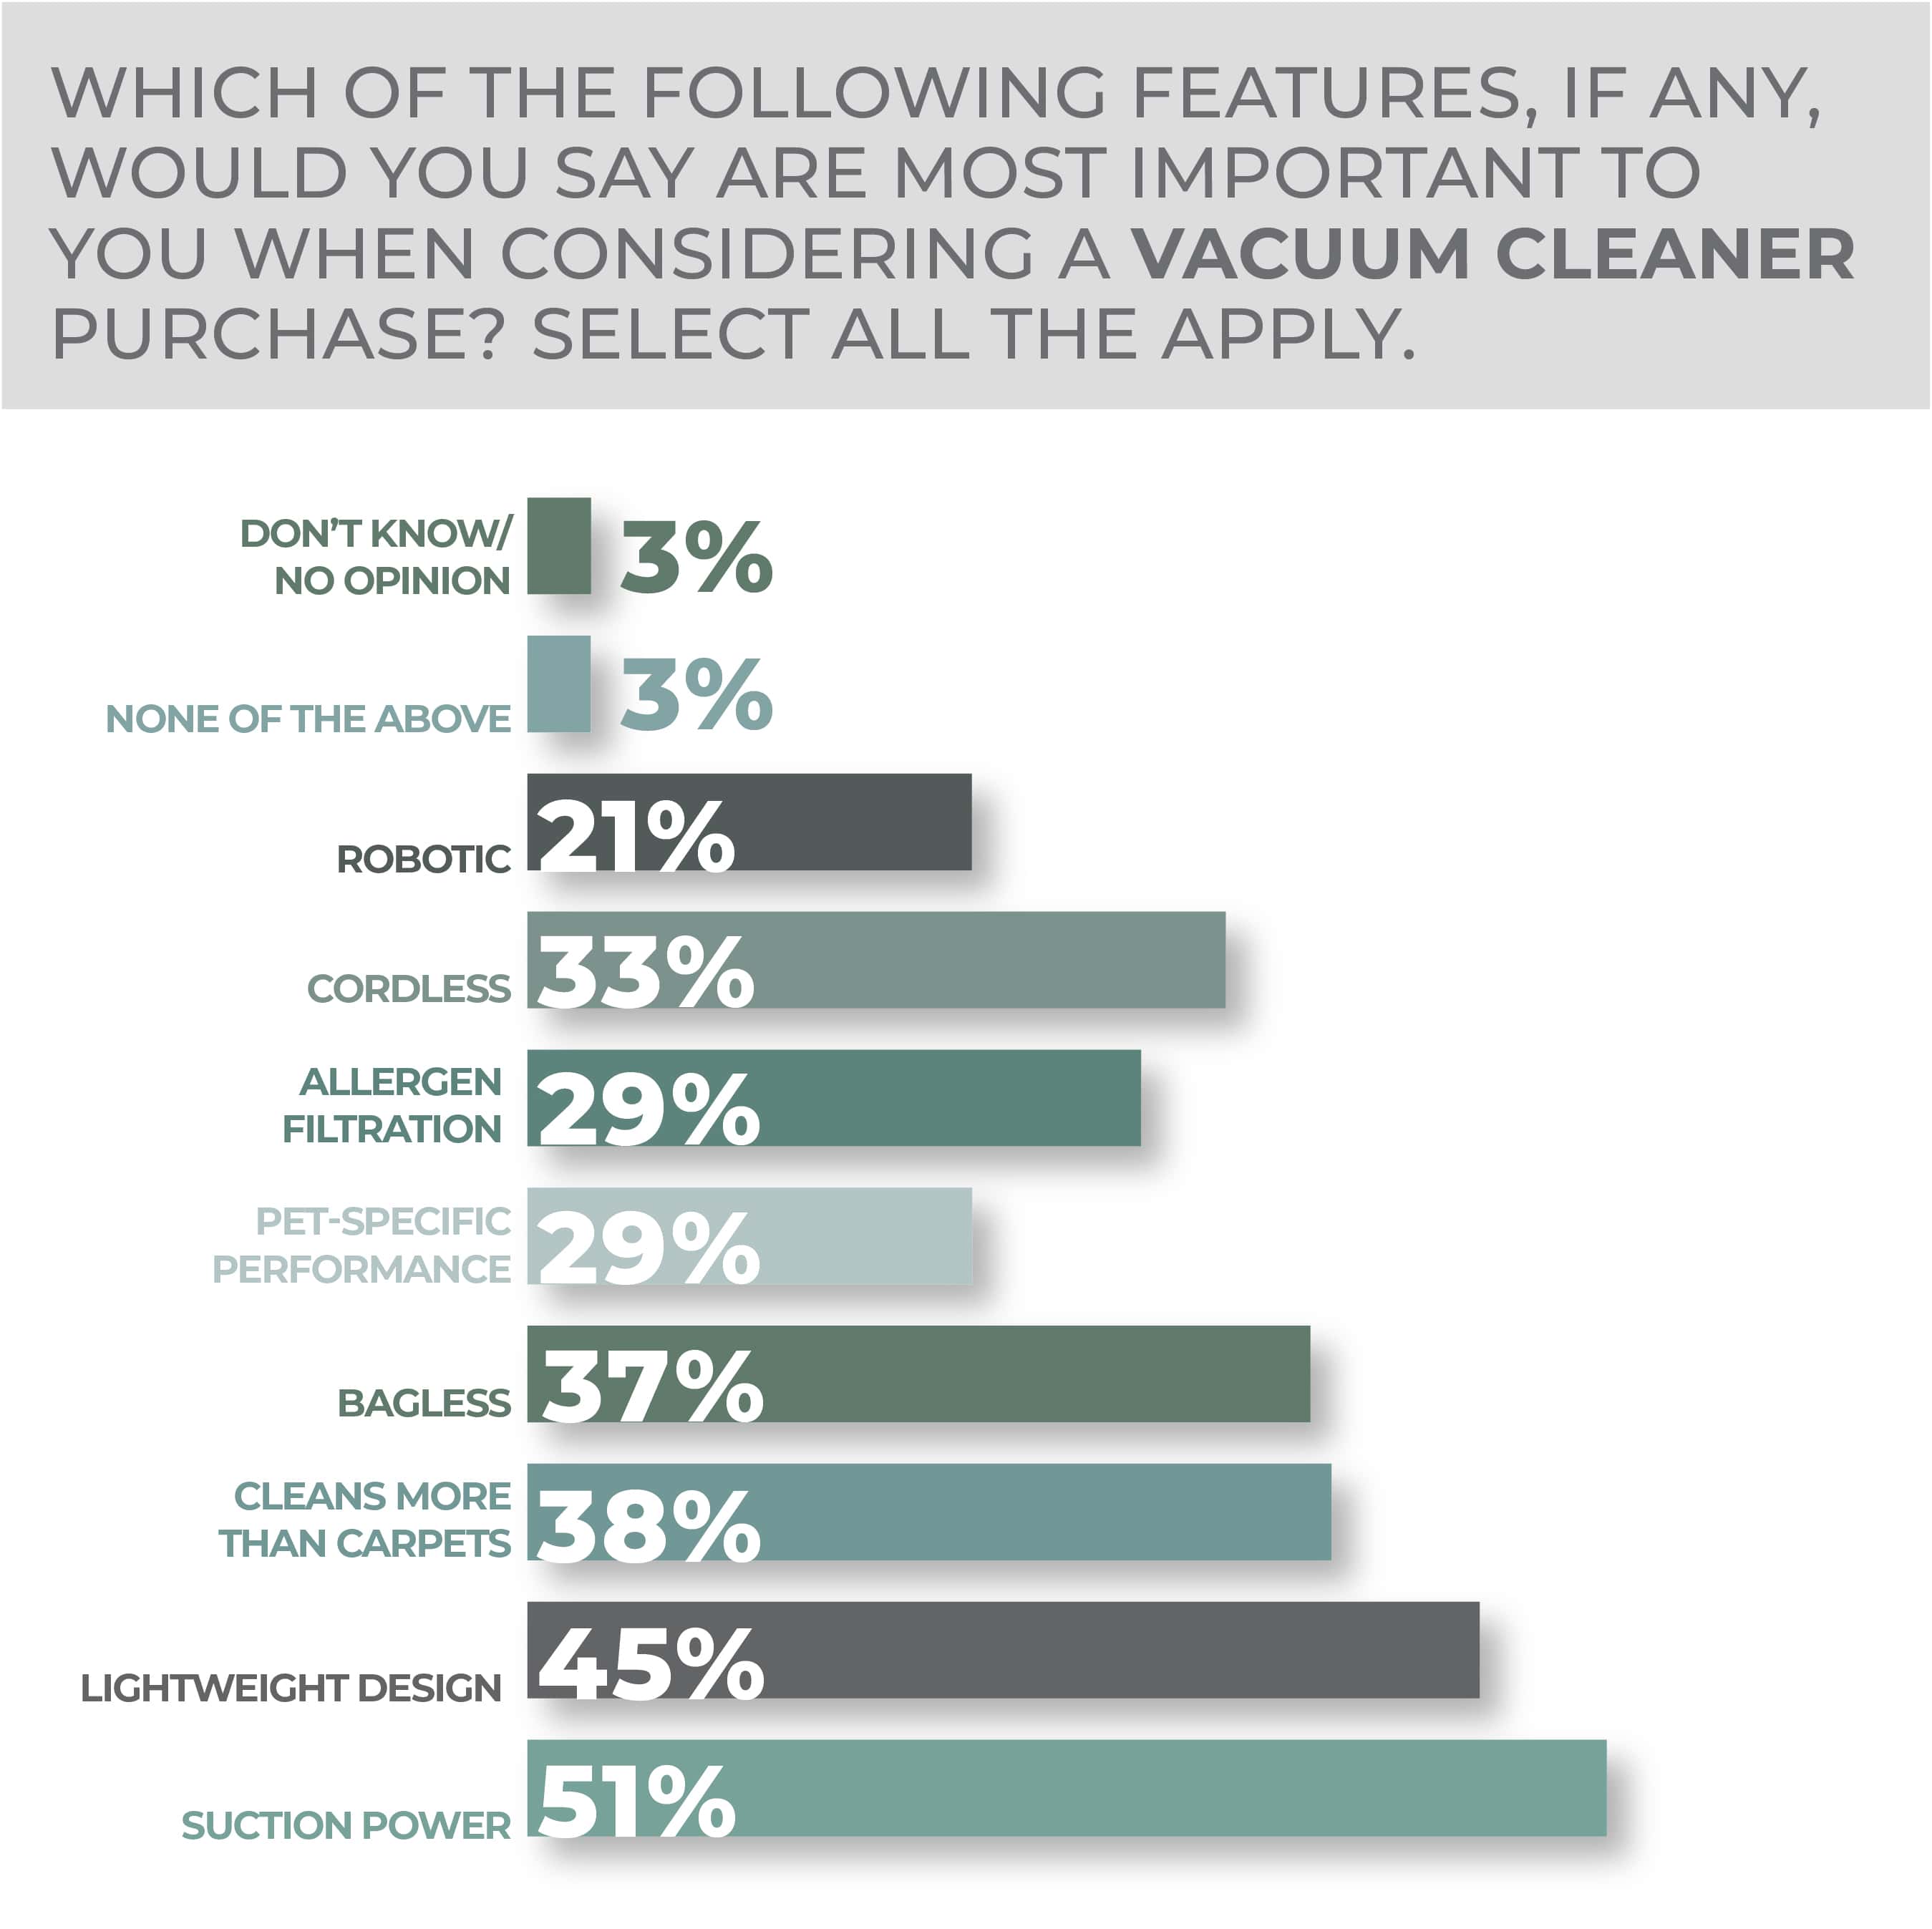
As for features that are important when making a vacuum cleaner purchase, 51% of survey respondents said suction power followed by lightweight design at 45%, must clean more than carpets at 38%, bagless at 37%, cordless at 33%, pet-specific performance and allergen filtration tied at 29%, and robotic at 21%.
Consumers 18-34 have a bit of a lead over those 35-44 in purchase intention, 22% very and 31% somewhat versus 20% very and 32% somewhat likely to buy, with the older ages falling off at 12% very and 20% somewhat likely for 45-64-year-olds and 5% very and 16% somewhat likely for 65-year-olds and older.
Consumers in the South are most intent on purchasing floor care electrics in the months ahead, at 16% very and 26% somewhat likely to do so, followed by those in the West at 14% very and 23% somewhat likely. Midwesterners said they were 14% very and 21% somewhat likely to purchase in the category while Northeasterners indicated they were 13% very and 25% somewhat likely to do so.
Respondents to the survey were most interested in steam cleaners and hand-held vacuums among floor care electrics.
The most important vacuum cleaner feature among survey respondents was suction power followed by lightweight design.
More Floor Care Electrics Findings:
Glassware
Glass breaks, and that traditionally has been among the leading drivers of glass beverageware sales. In recent years, though, the trend of elevated, craft-style home beverage preparation and serving—and the opportunity to share personal creations in-person and on social media—have helped lift drink-specific glassware for coffee, tea, wine, beer and cocktails.
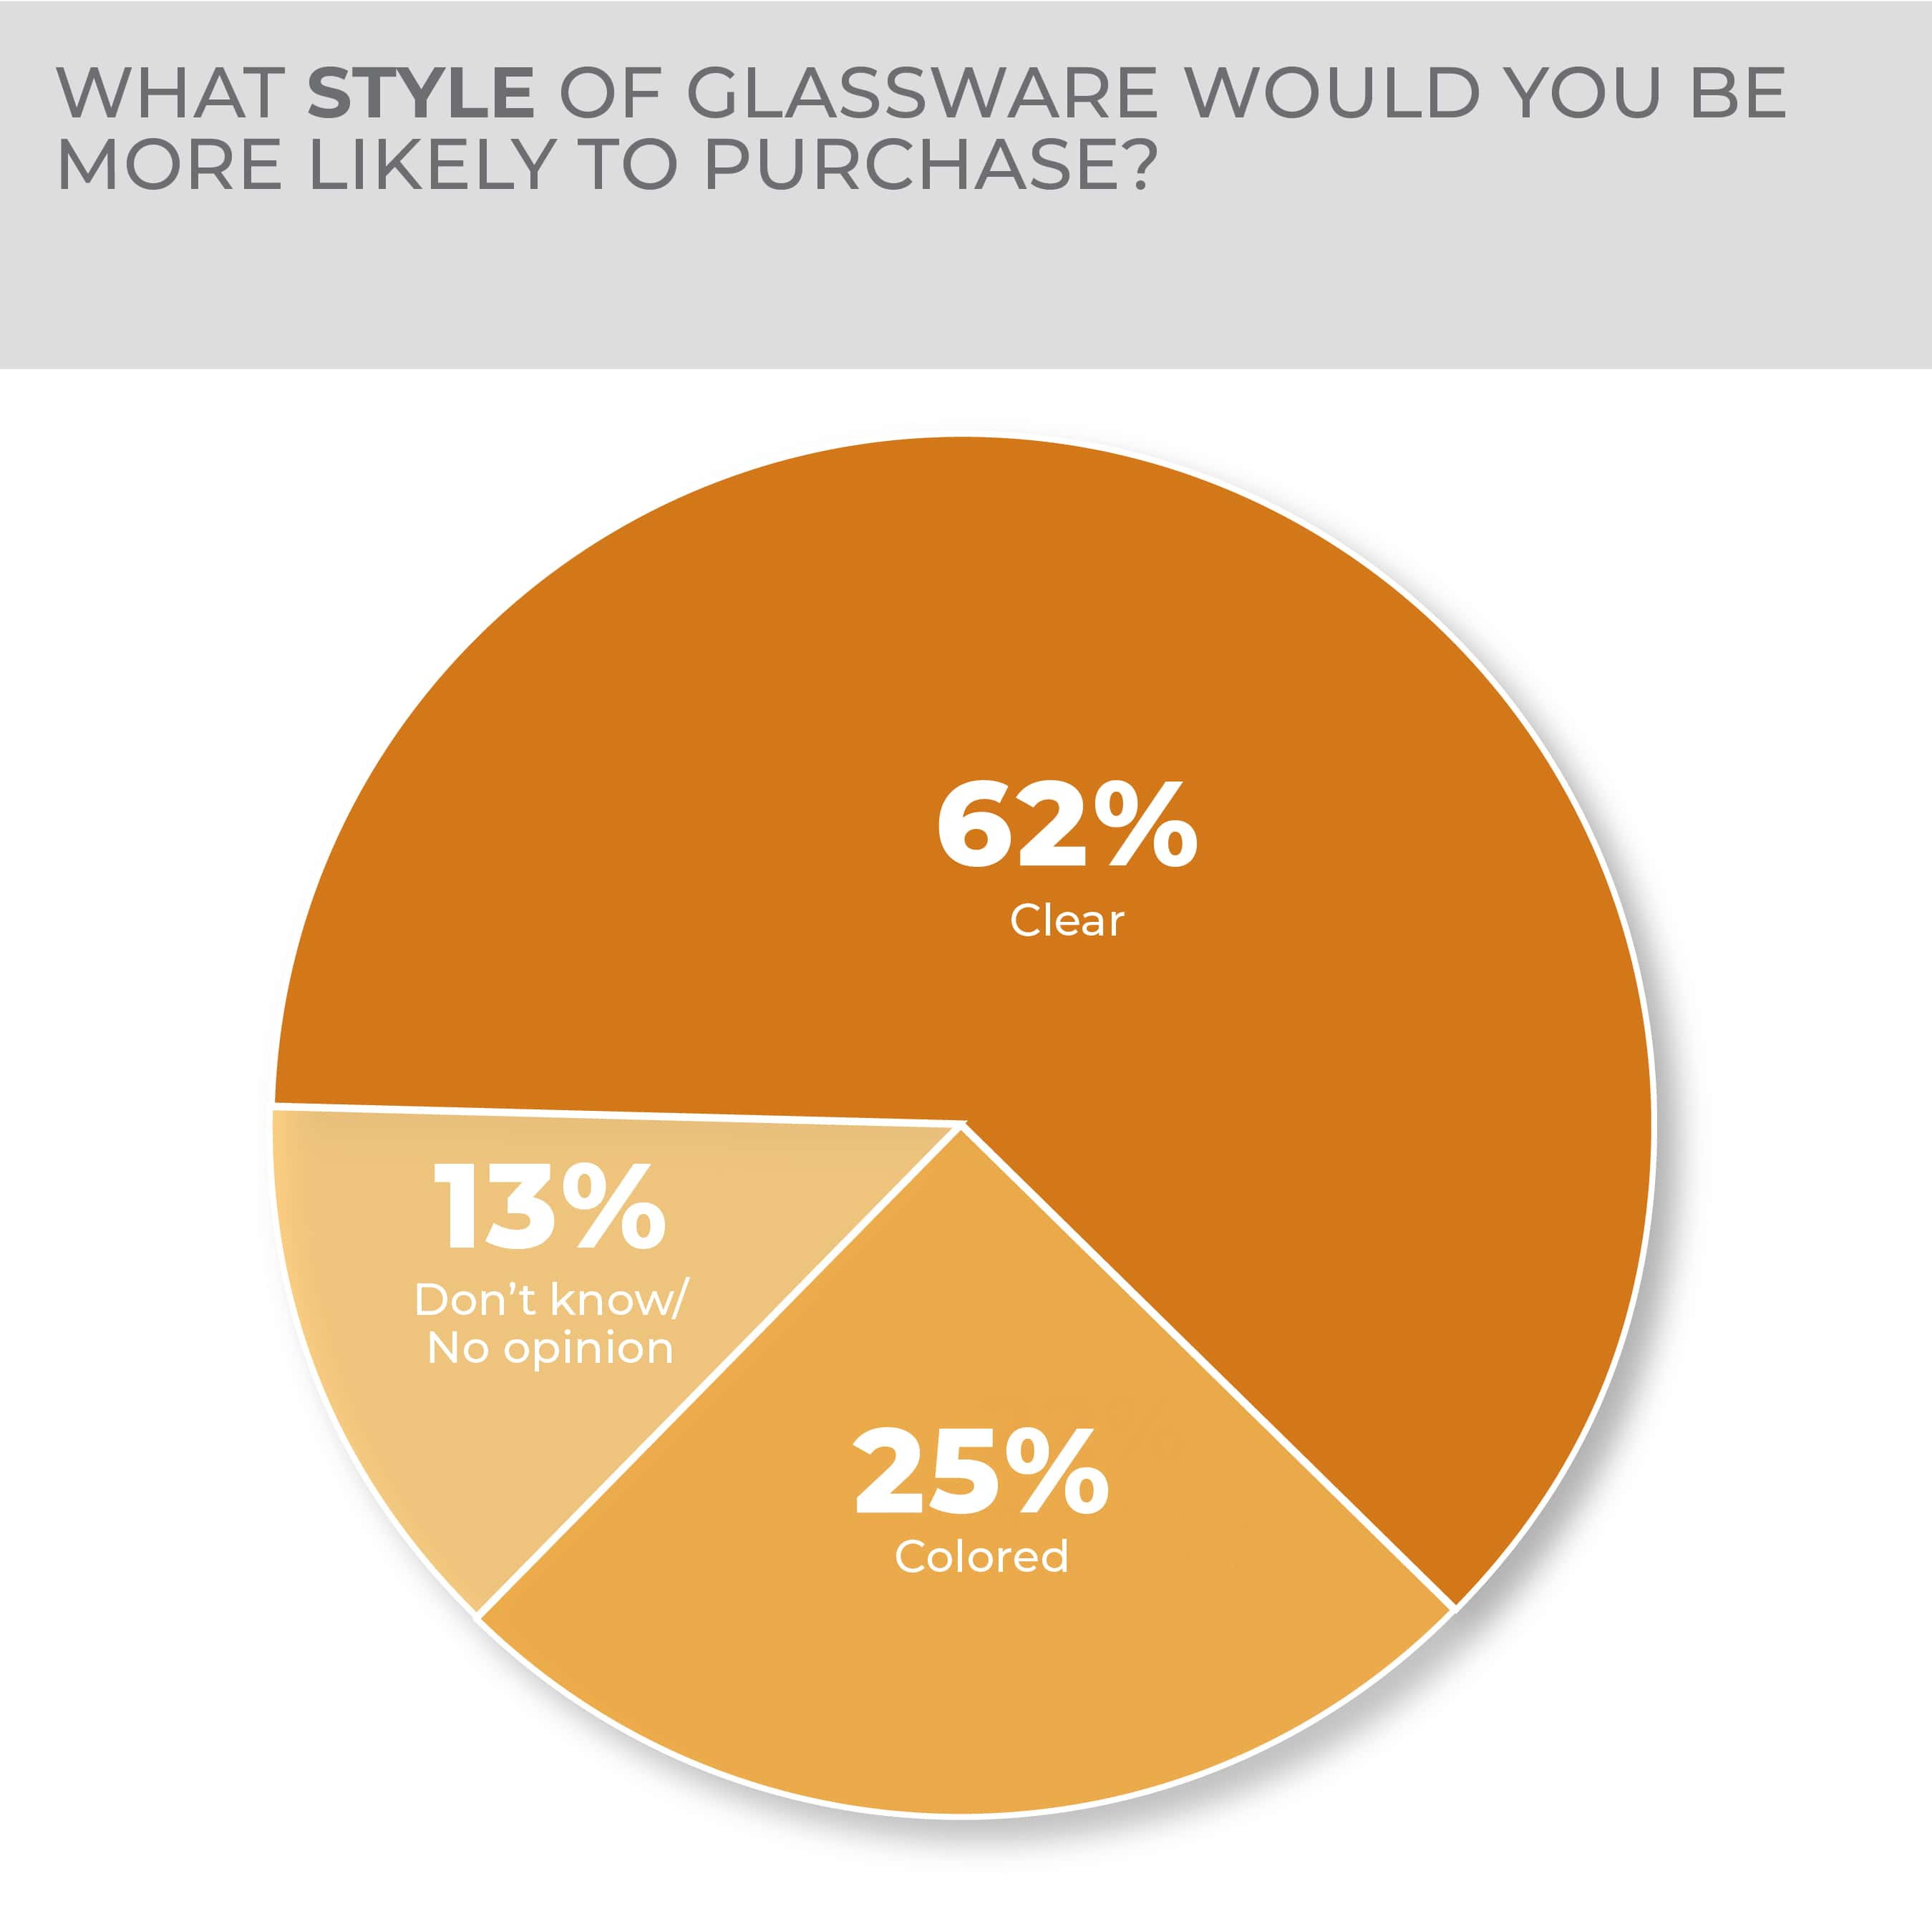
The marketplace is resplendent with colored glass again in lively, expressive options to accent dinner tables and gatherings. However, the versatility and endurance of clear glassware (which many users feel allows a beverage and its color to contribute more effectively to the drinking experience) explain why 62% of consumers selected clear drinking glasses as a preference, compared to 25% who selected colored glassware.
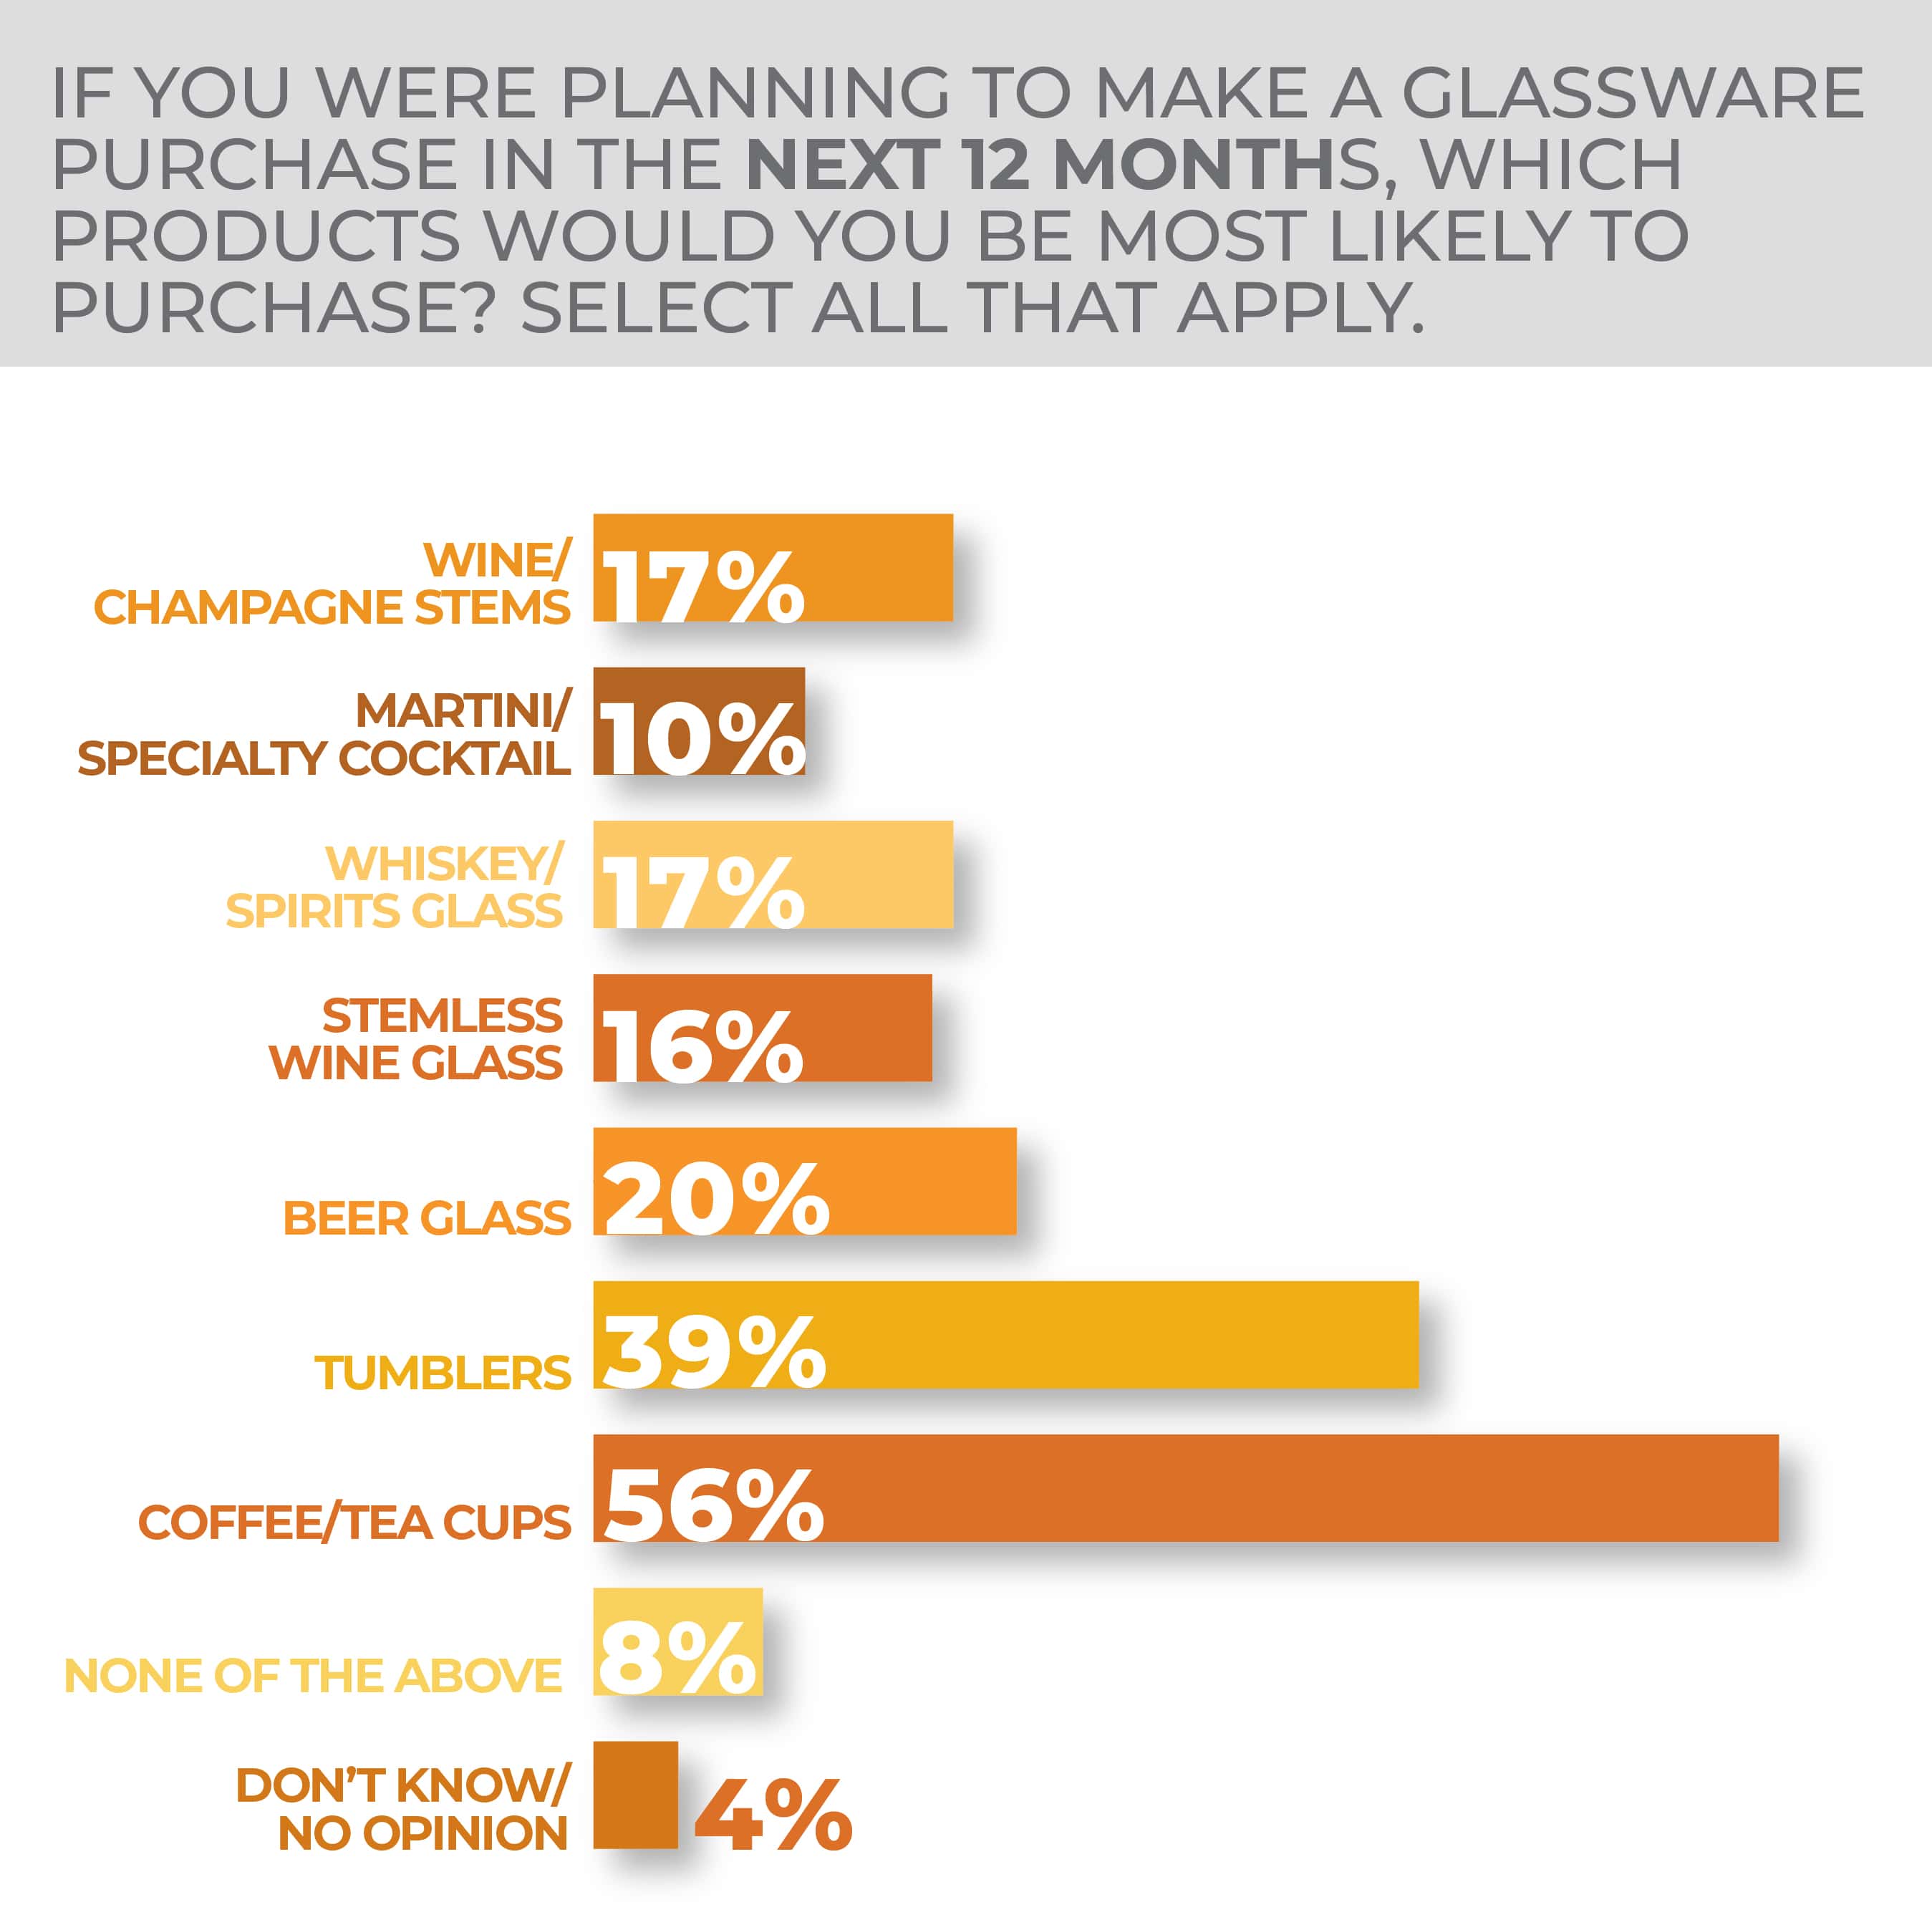
While everyday tumblers remain the lead glass beverageware purchase preference at 39% of respondents to the HomePage News 2023 Consumer Outlook Survey, solid demand for other types underscores the ongoing potential of specialty items: coffee/tea cups (56%), beer glasses (20%), wine/champagne varietal glasses (17%) and whiskey/spirit glasses (20%).
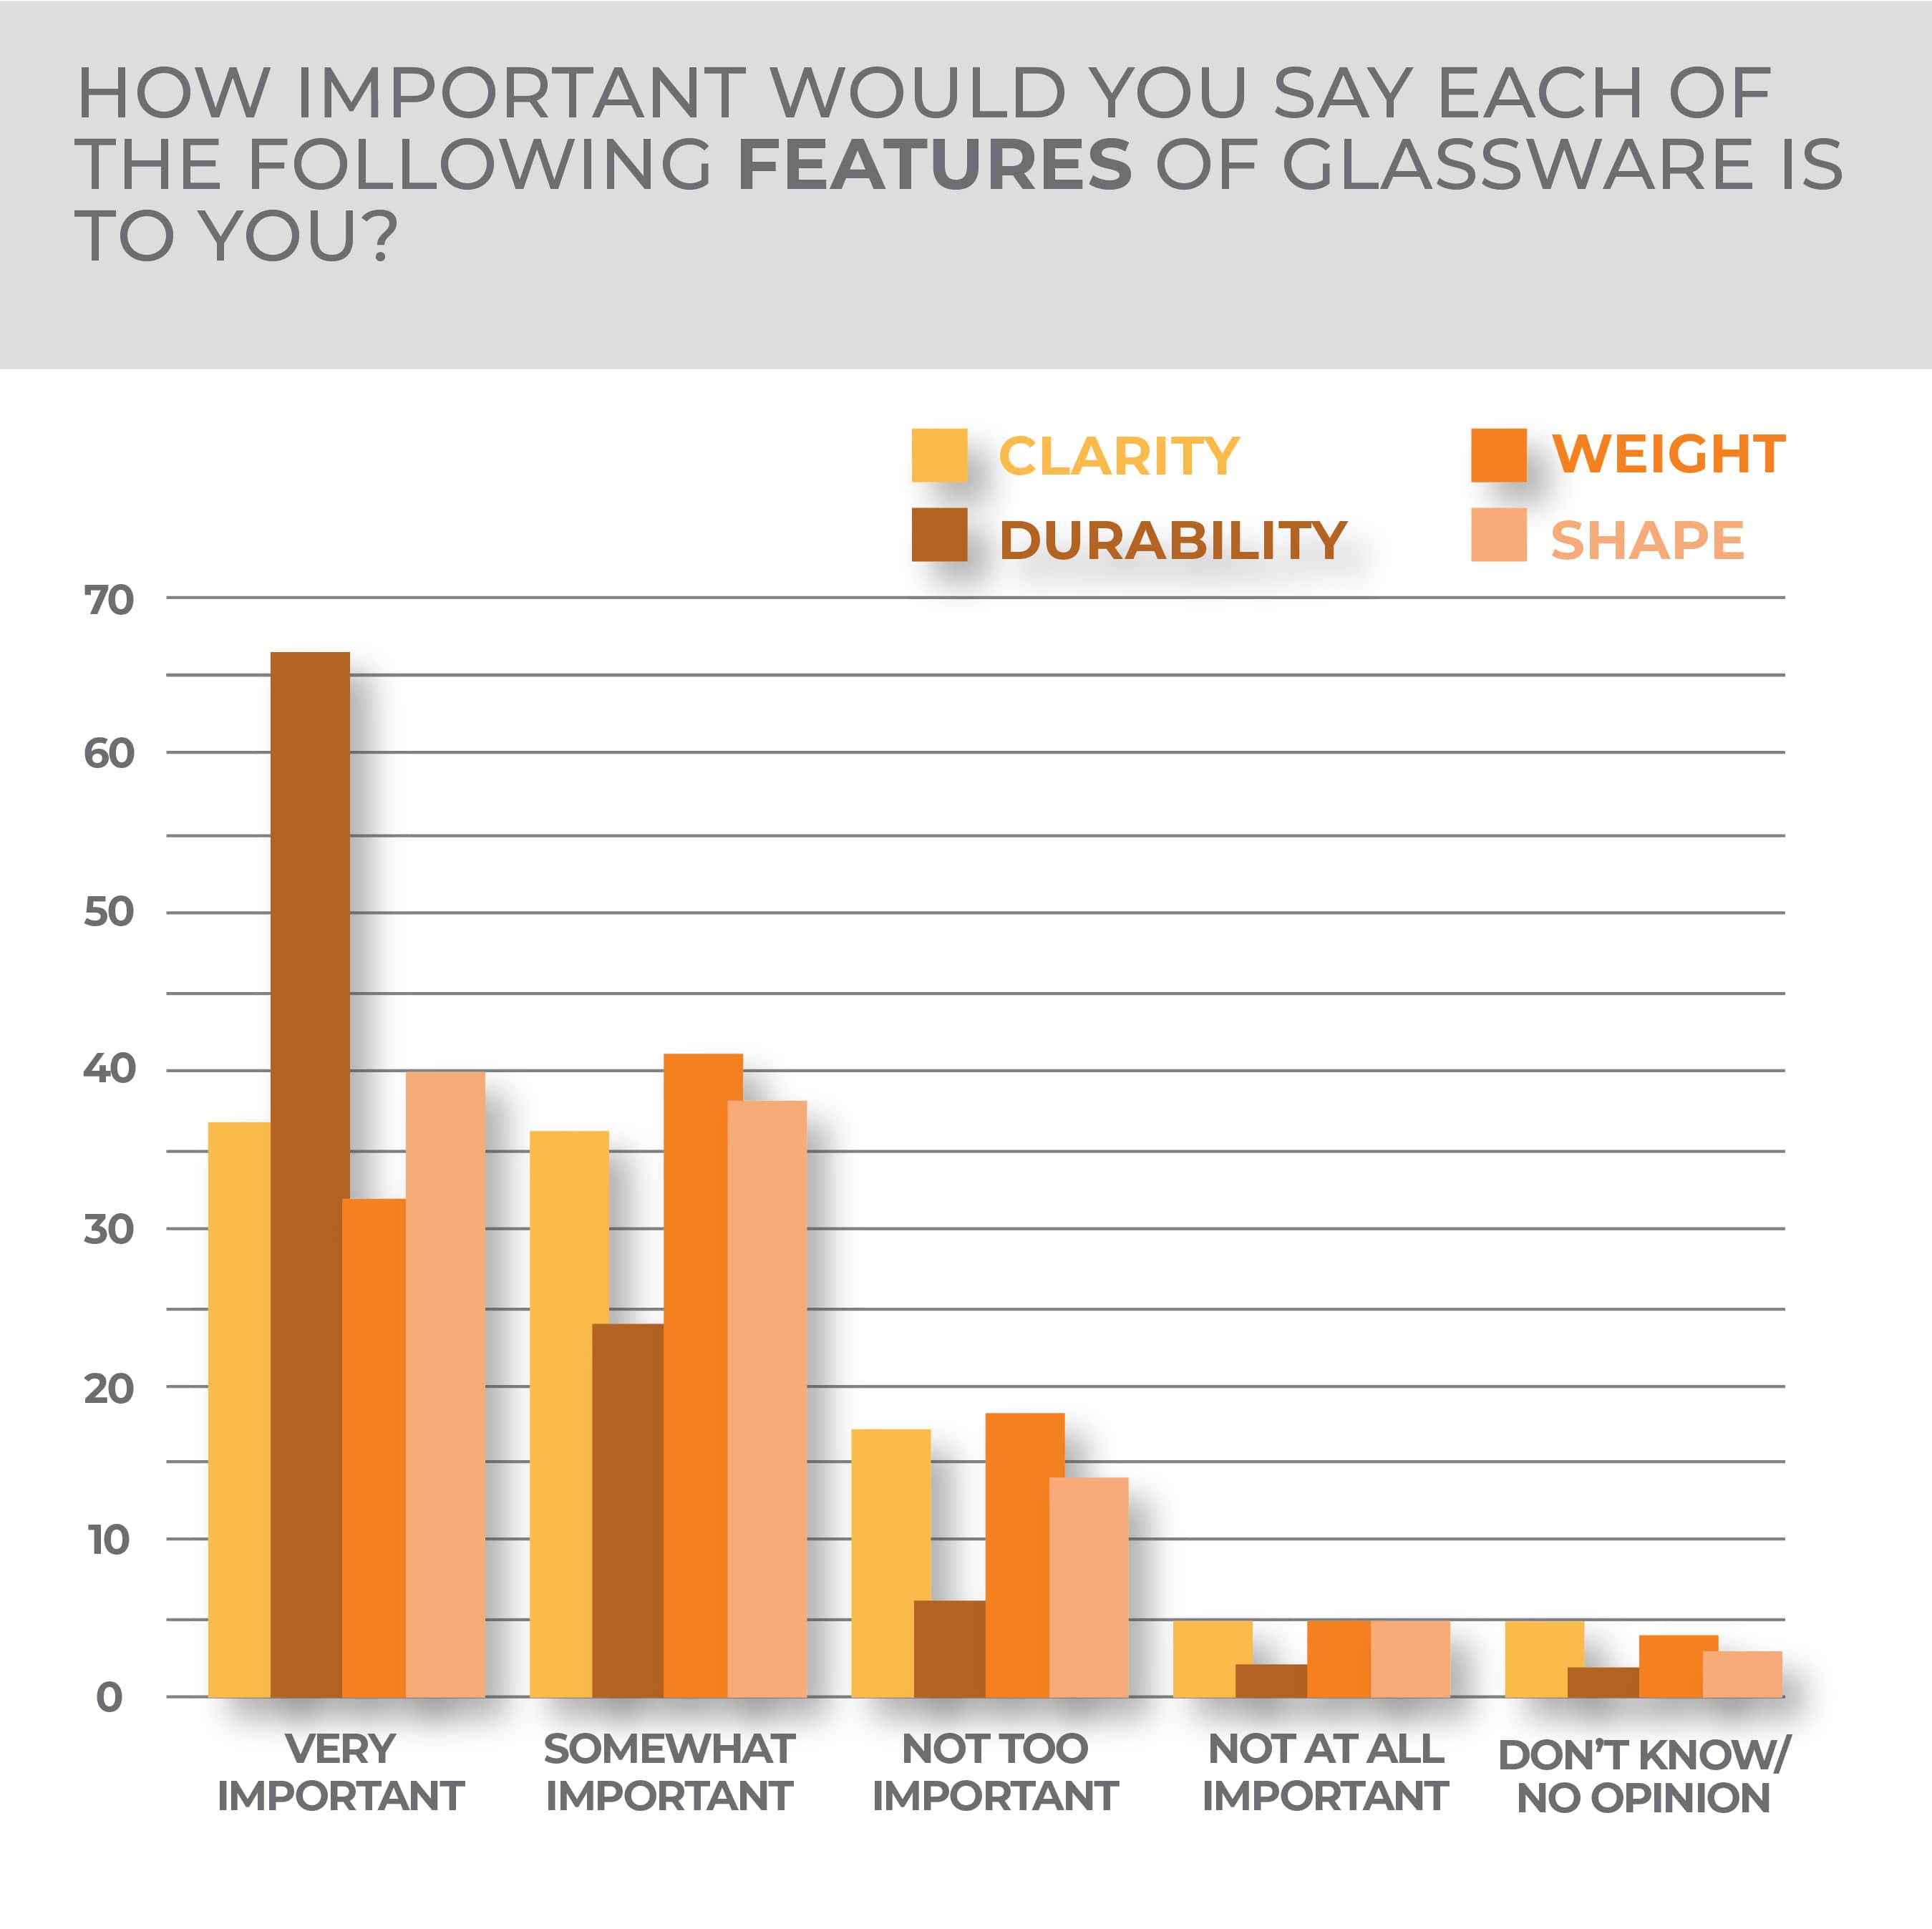
Several other quality-oriented attributes factor heavily into glassware value and purchase intent. Durability is very important to 66% of consumers and somewhat important to 24%. The shape is very important to 40% of respondents and somewhat important to 38%. Clarity is very important to 36% of respondents and somewhat important to another 35%.
-
- While everyday tumblers remain the lead glass beverageware purchase preference, solid demand for other types underscores the ongoing potential of specialty items including coffee/tea cups, beer glasses, wine/champagne varietal glasses and whisky/spirit glasses.
- The survey indicates demand in glass beverageware is fairly balanced between sets and open stock, the latter of which has seen notable gains amid consumer preferences for mix-and-match, eclectic and personalized table settings.
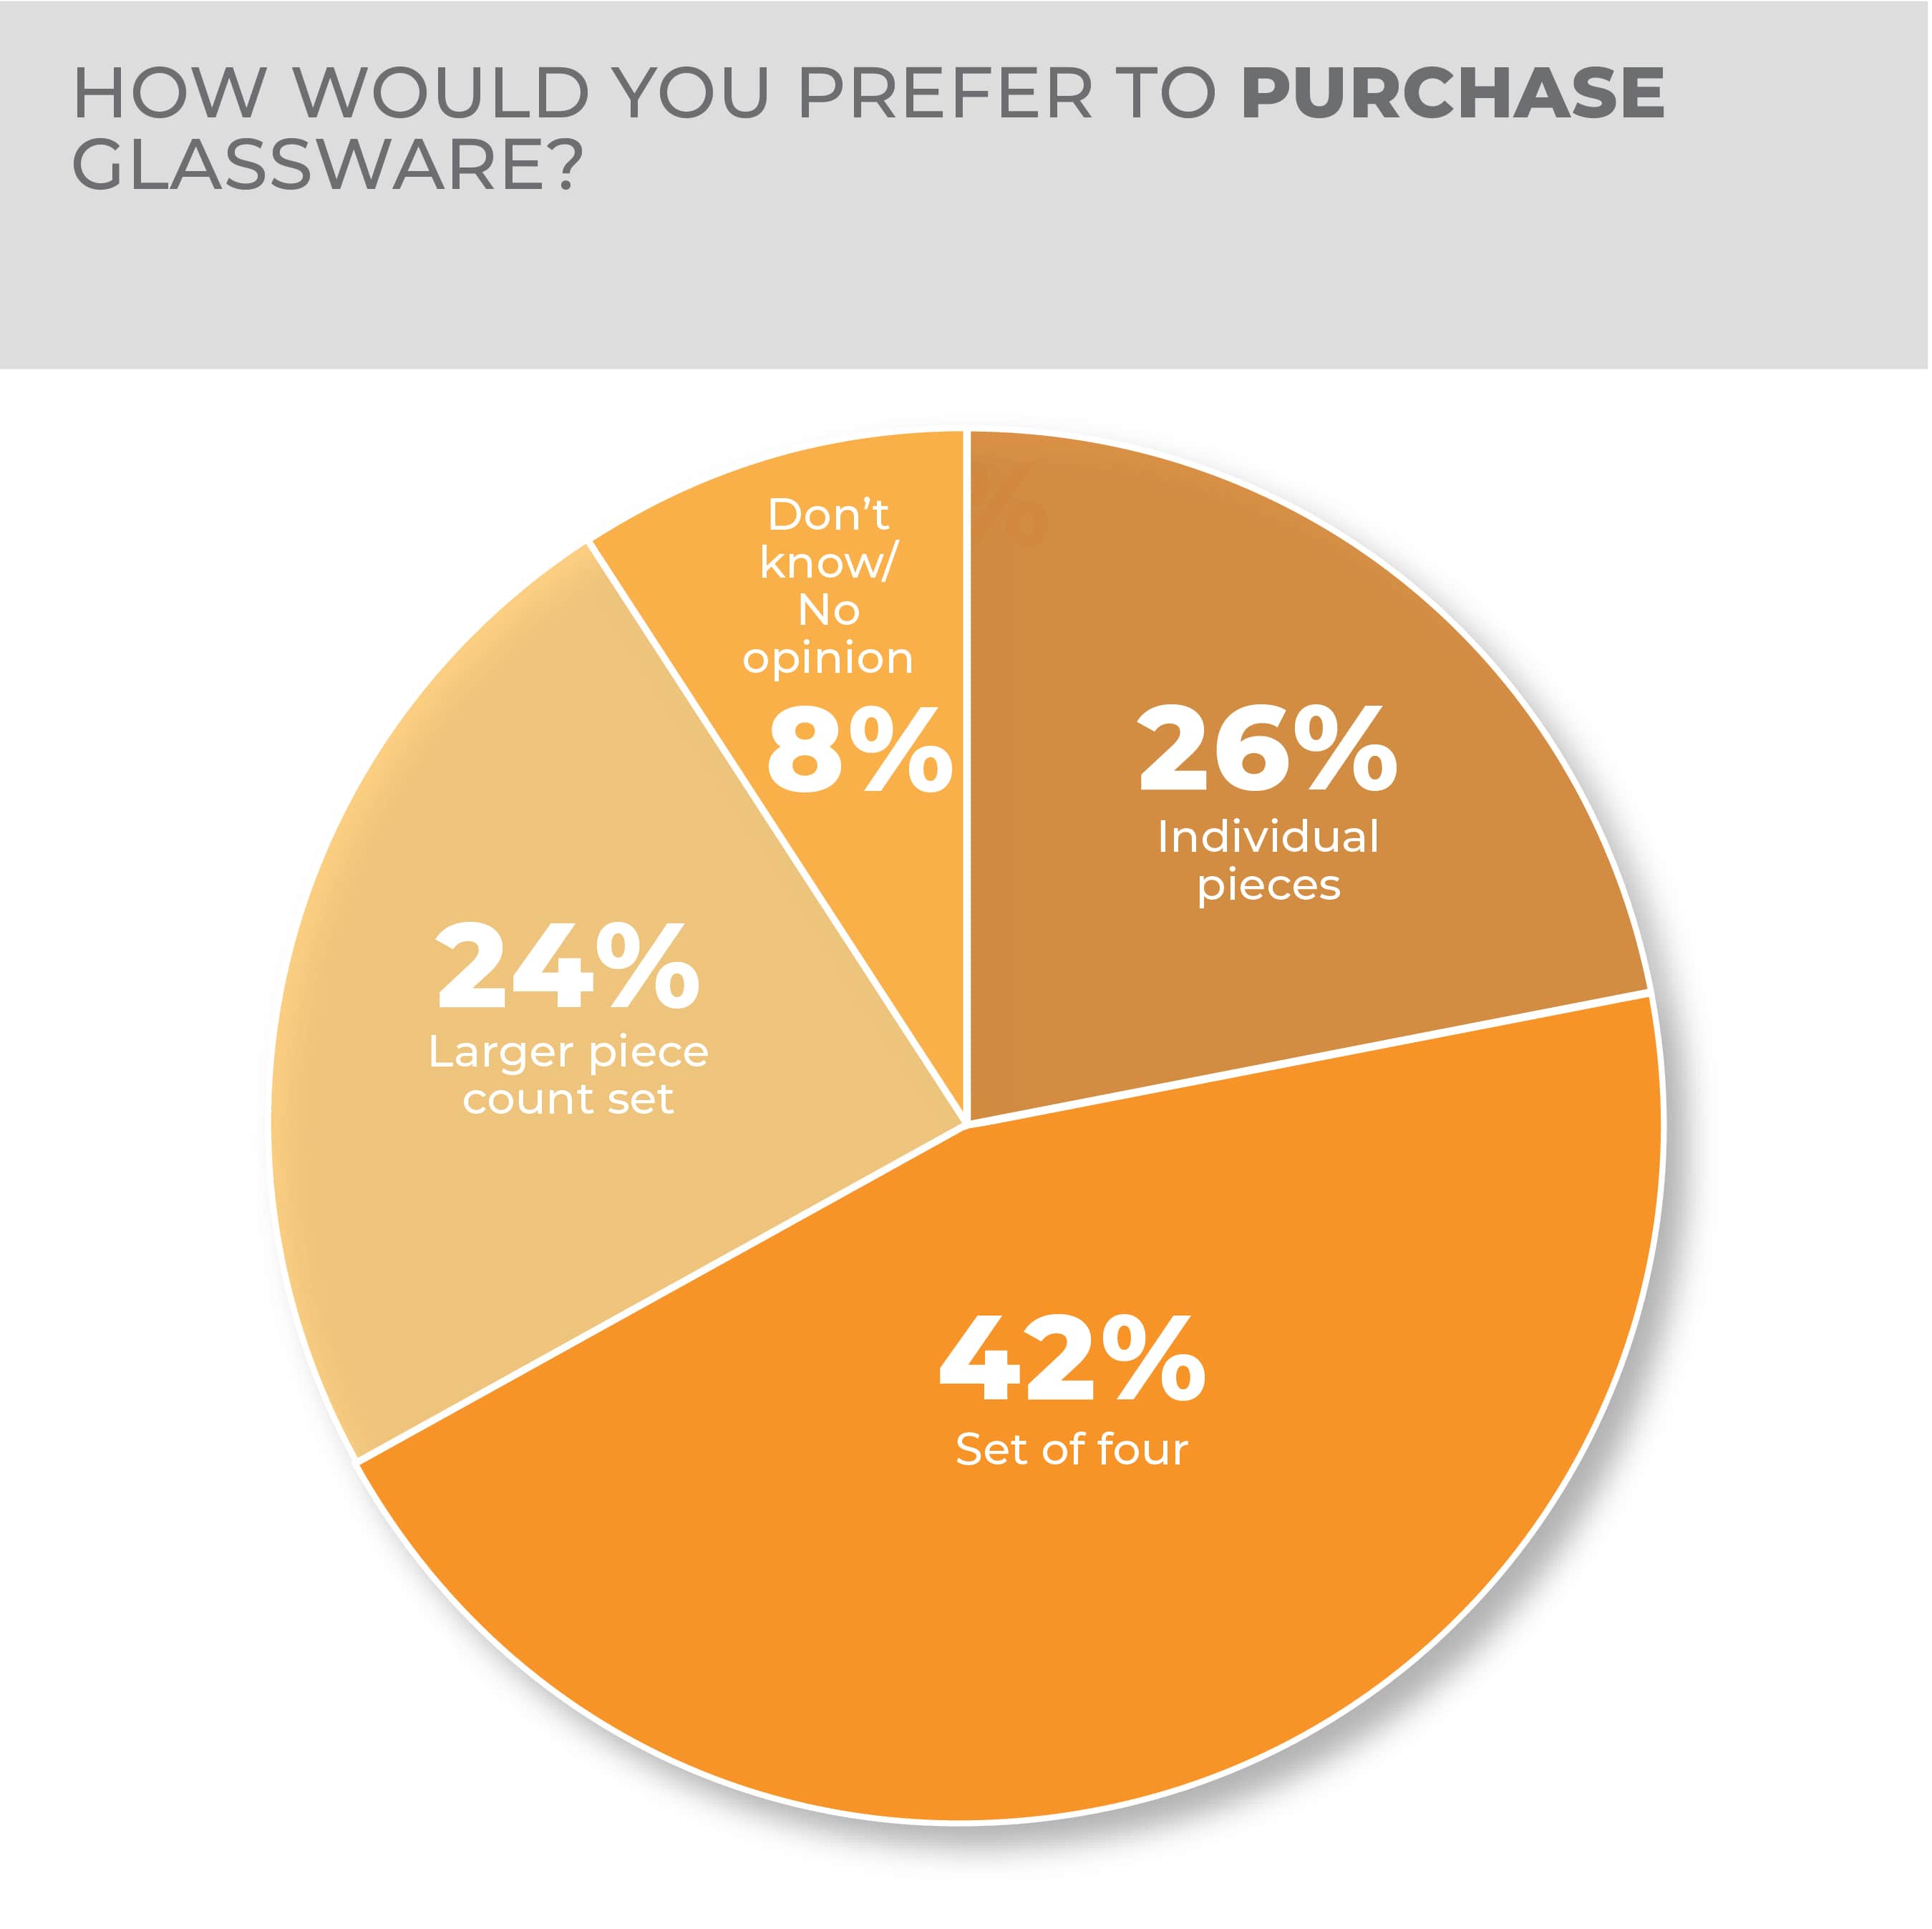
The survey indicates demand in glass beverageware is fairly balanced between sets and open stock, the latter of which has seen notable gains amid consumer preferences for mix-and-match, eclectic and personalized table settings. Older consumers (55%) prefer sets of four far more than younger consumers (33%).
More Glassware Findings:
Home Environment
At a time when wellness has become more important among consumers, home environment products continue to spur interest with more than a third of respondents to the HomePage News 2023 Consumer Outlook Survey expressing at least some interest in purchasing something in the category during the coming months.
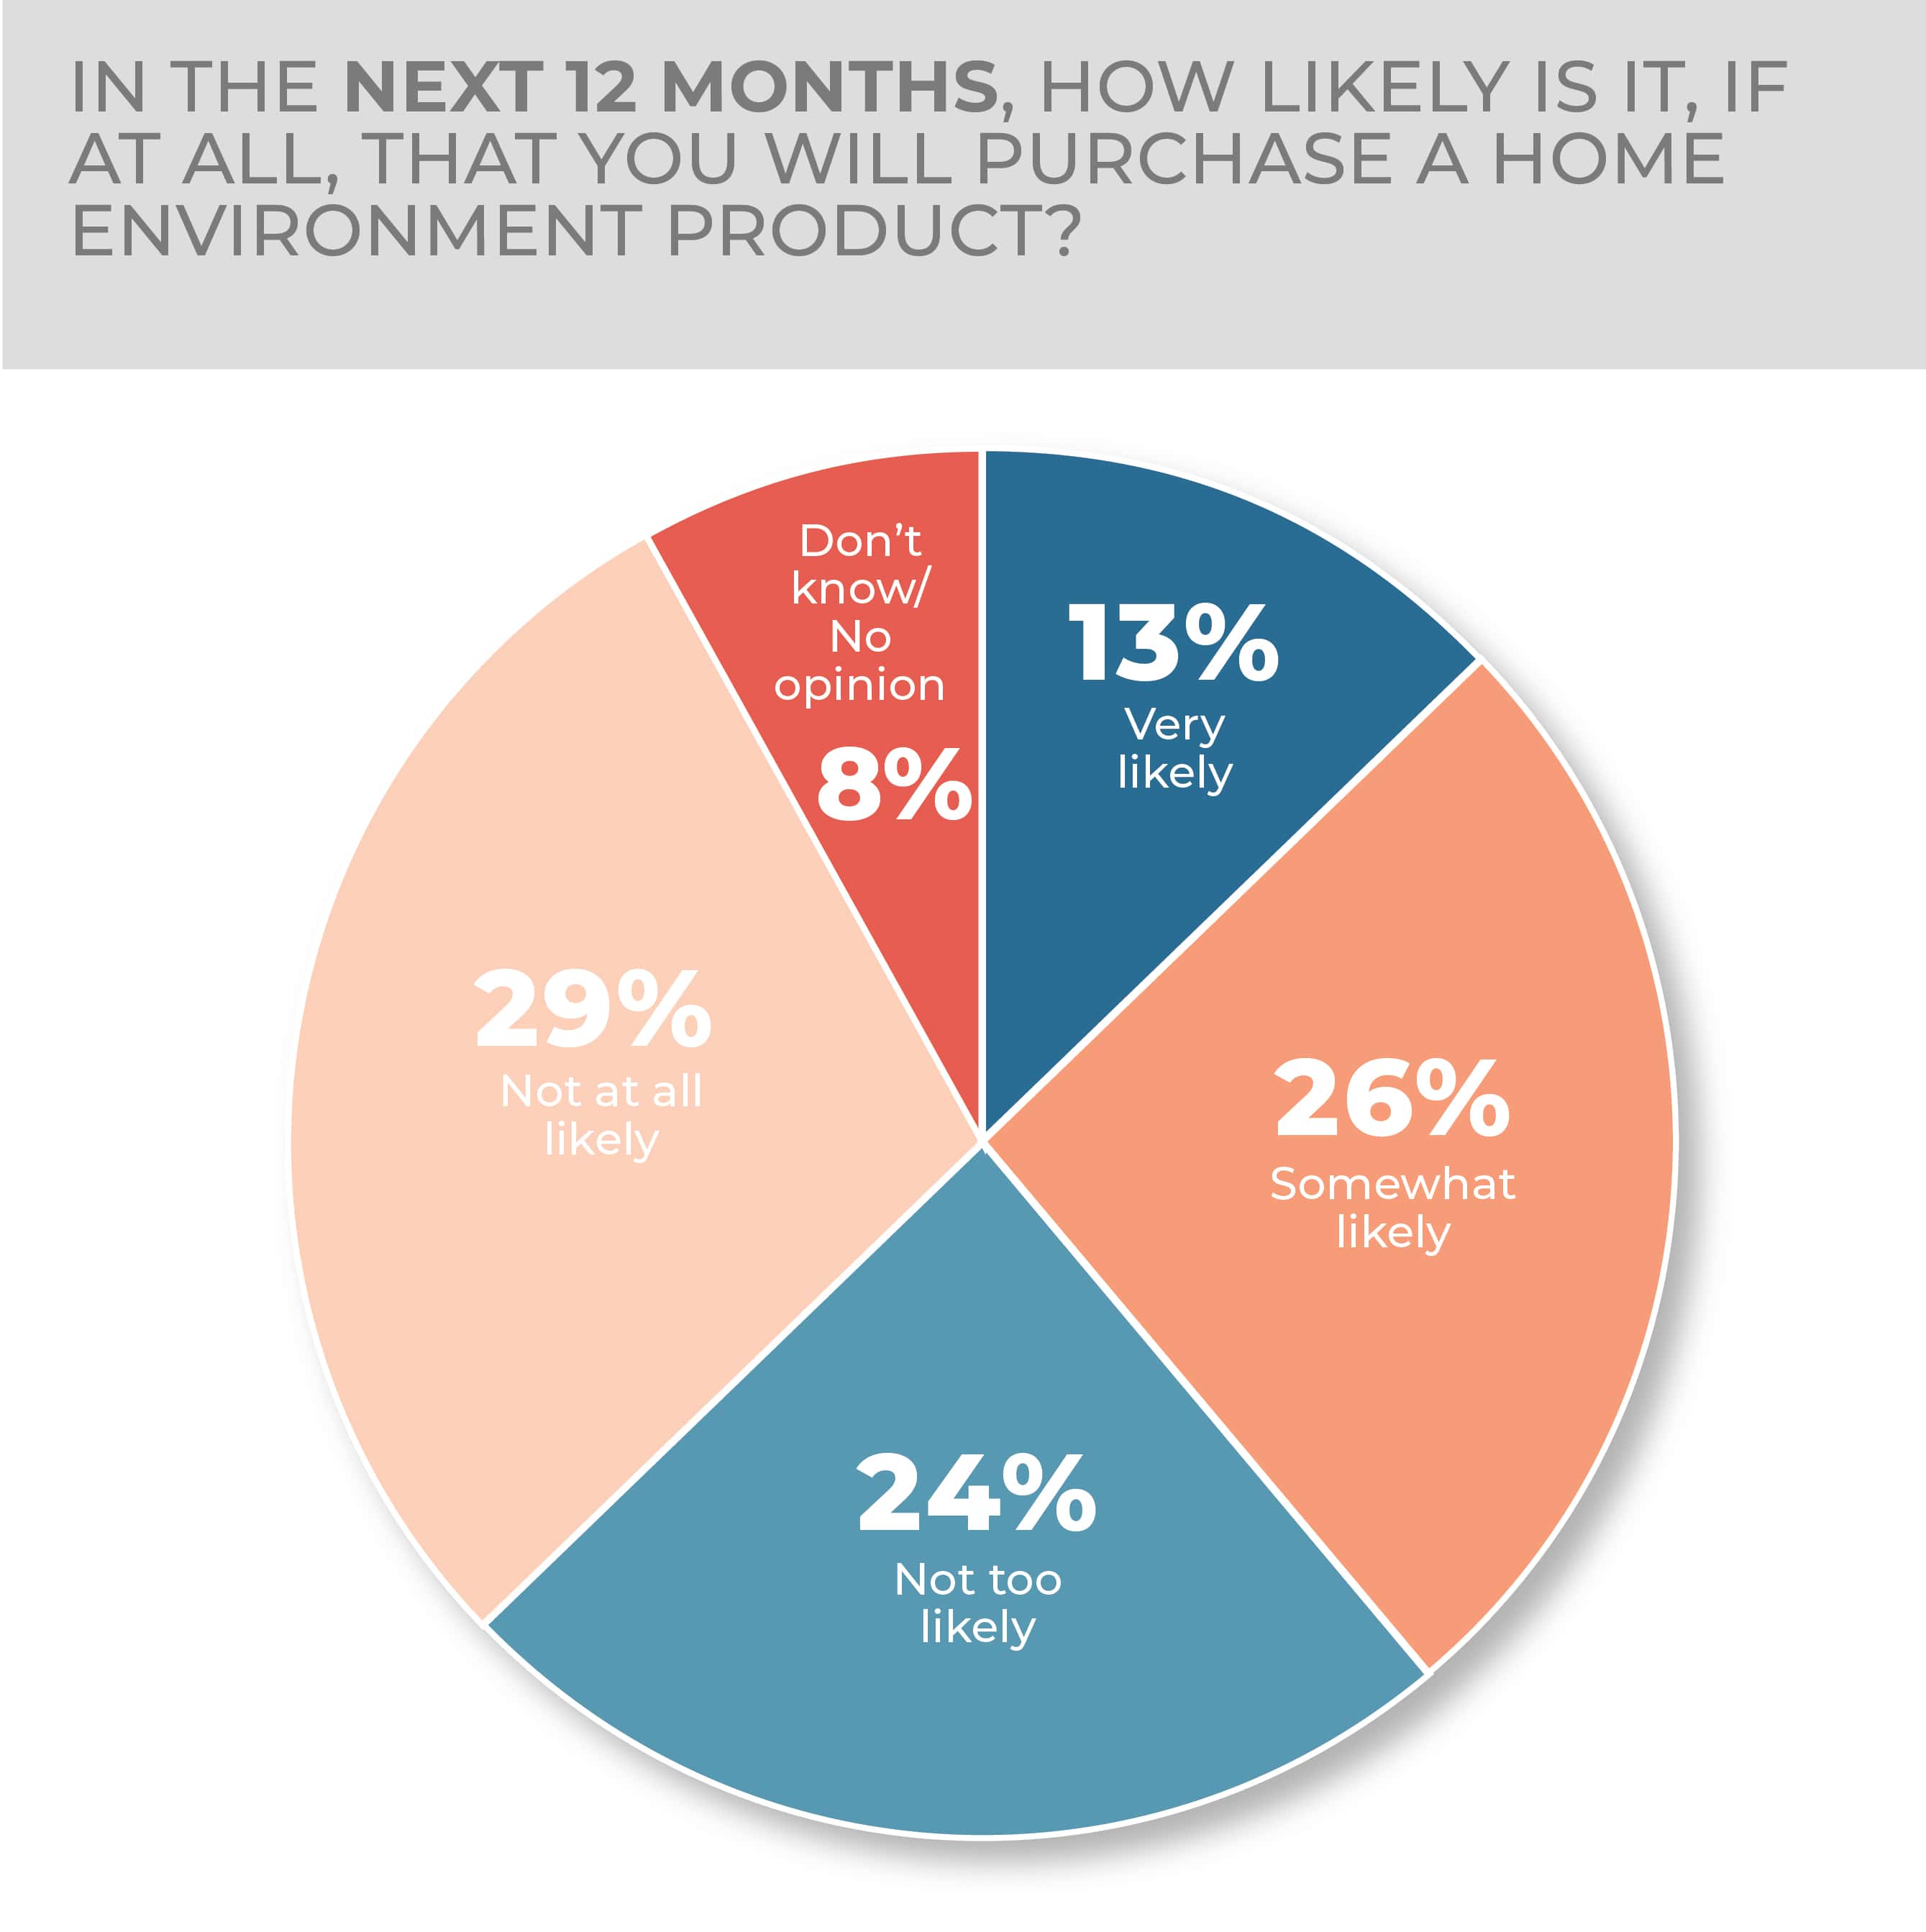
In all, 13% of consumers were very likely and 26% were somewhat likely to purchase. Although down a little from last year, when results came in at 17% very likely and 26% somewhat likely, the latest figures follow two COVID-19-dominated years of focused domestic spending, circumstances that encouraged consumers to purchase home environment products. Interest in the product category seems to be ongoing.
-
- The most likely purchases in the home environment category this year are air purifiers, humidifiers and water filters.
- Safety is the top concern of potential home environment product purchasers, but the ease of maintenance is important too.
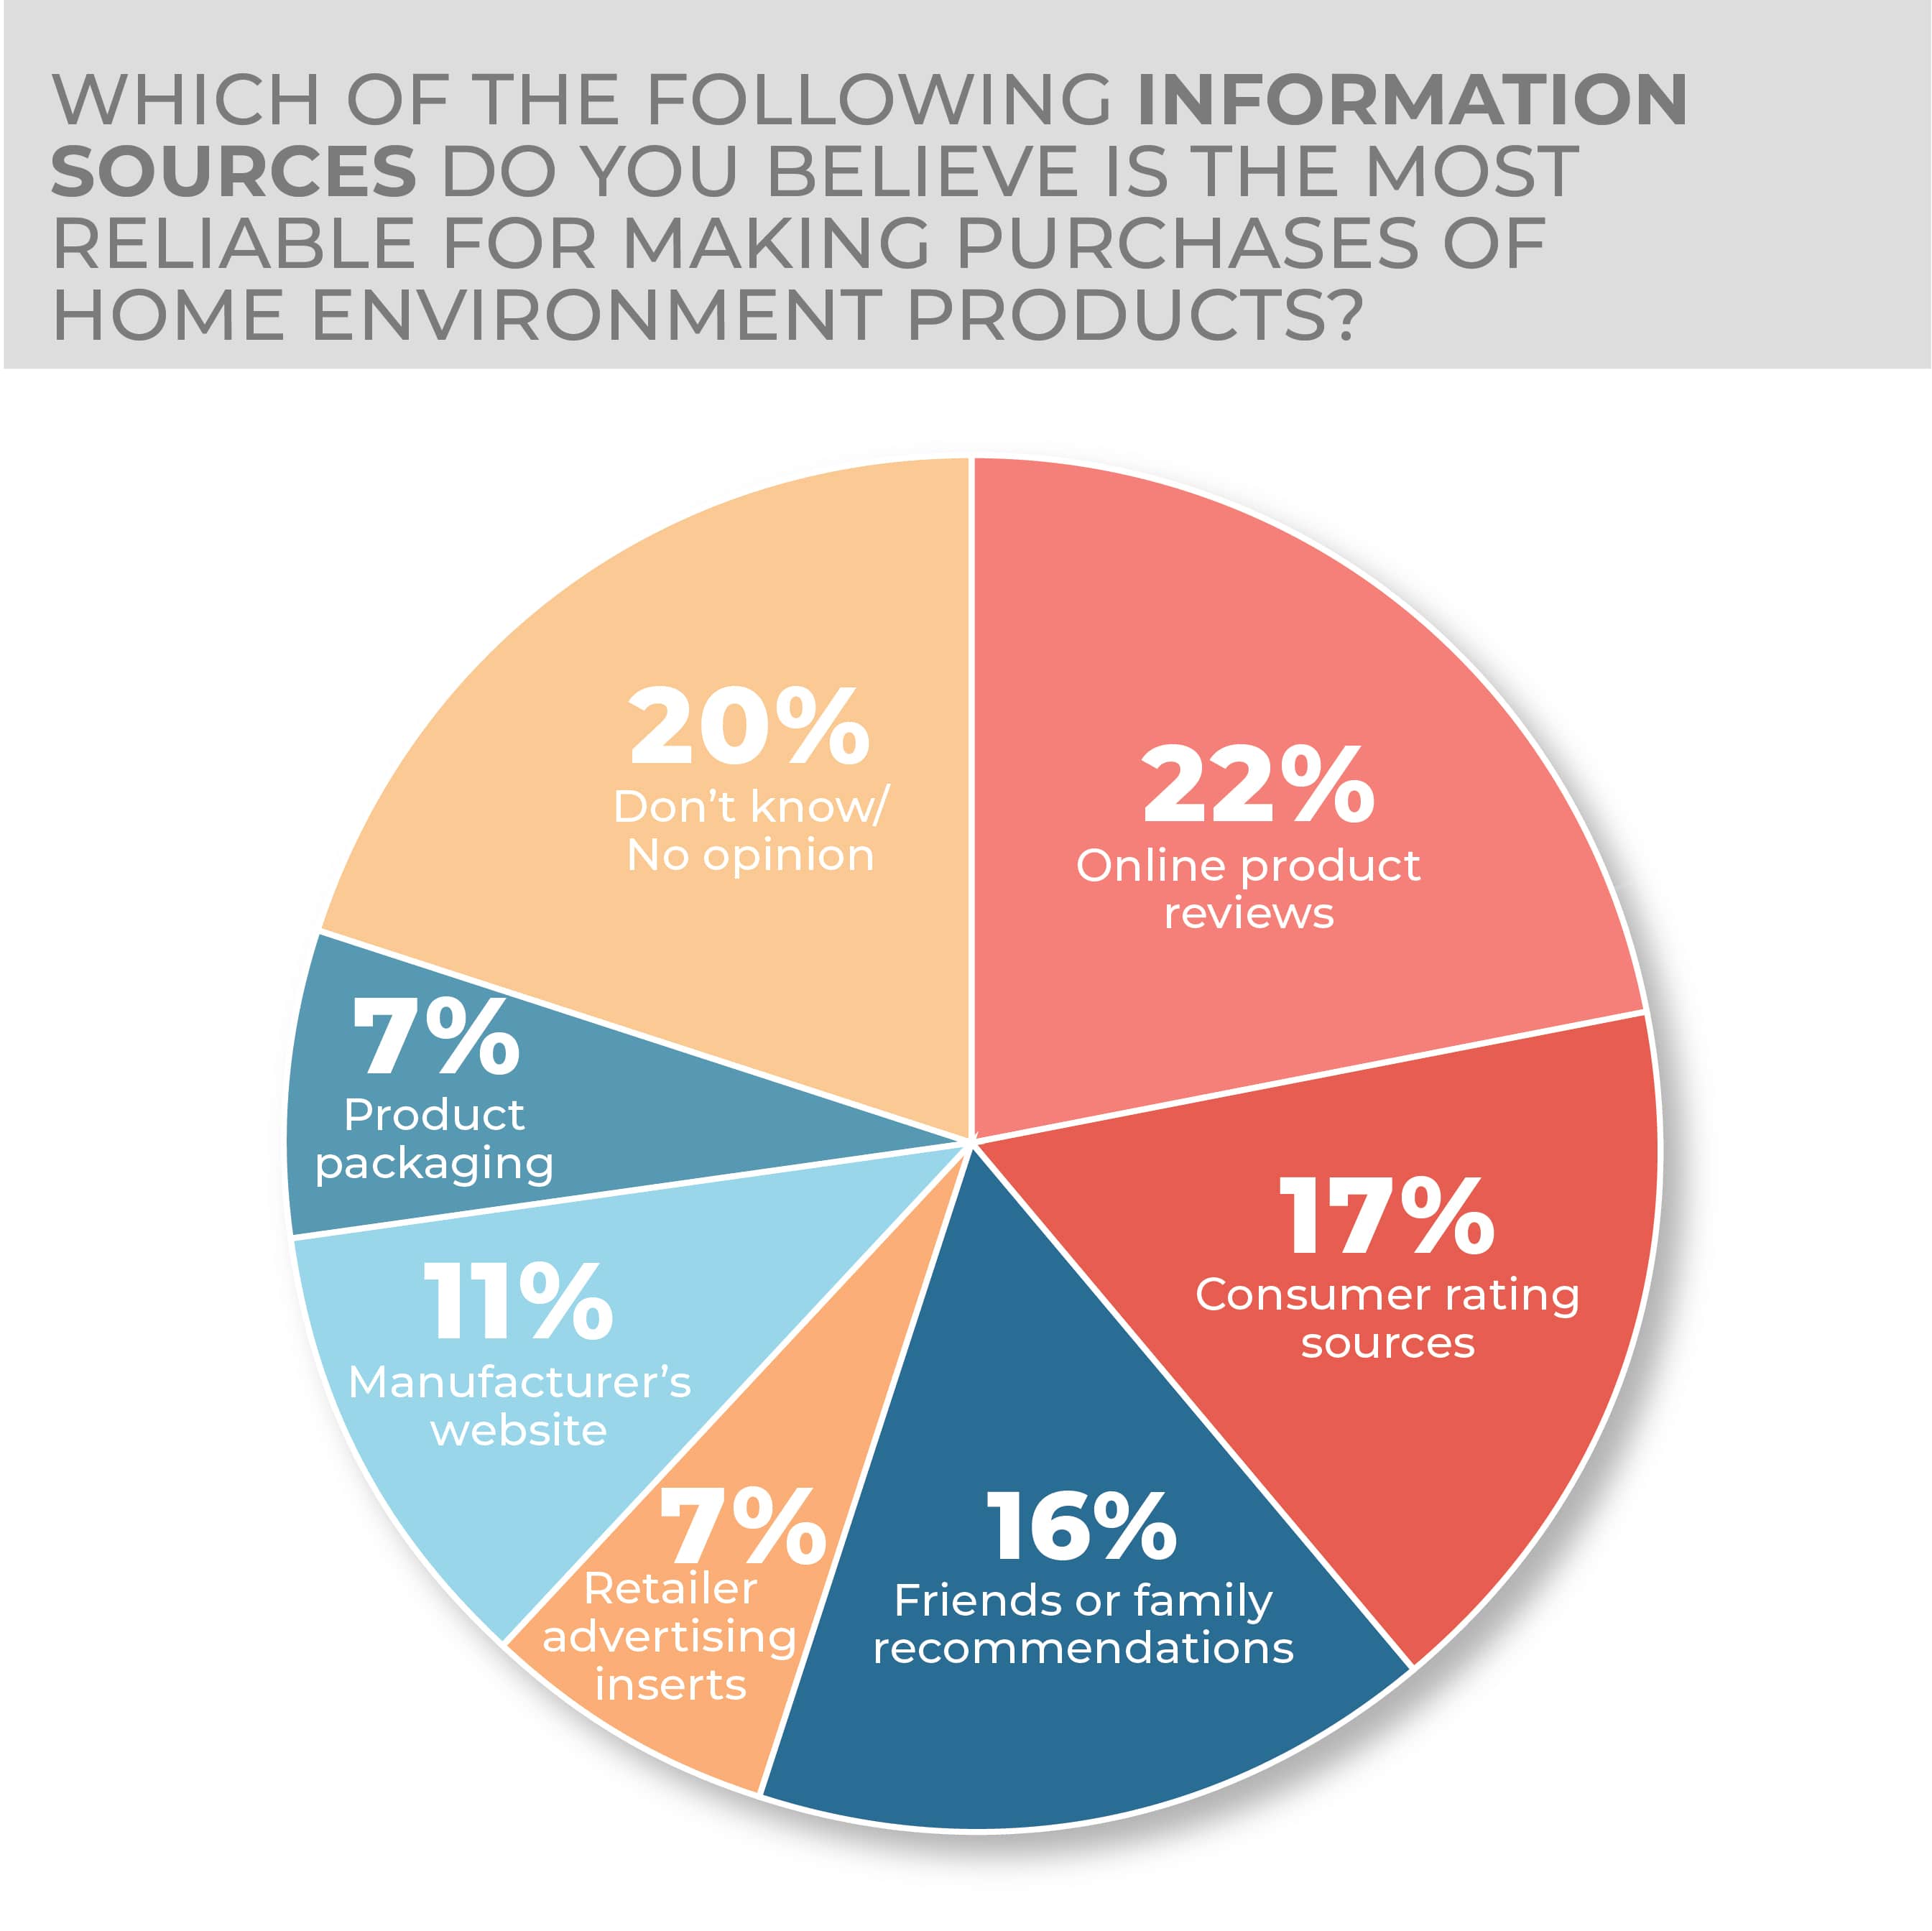
Third-party information sources were a bit lower year over year in the survey, especially online product reviews, down four points to 22%. Consumer rating sources came in just about flat, down one point to 17%, and friends or family recommendations slipped three points to 16% year over year. Retailers’ advertising inserts slipped three points to 7%. Product packaging also came in at 7% but that was up three points from the year-earlier survey. Manufacturers’ websites were up a couple of points to 11%.
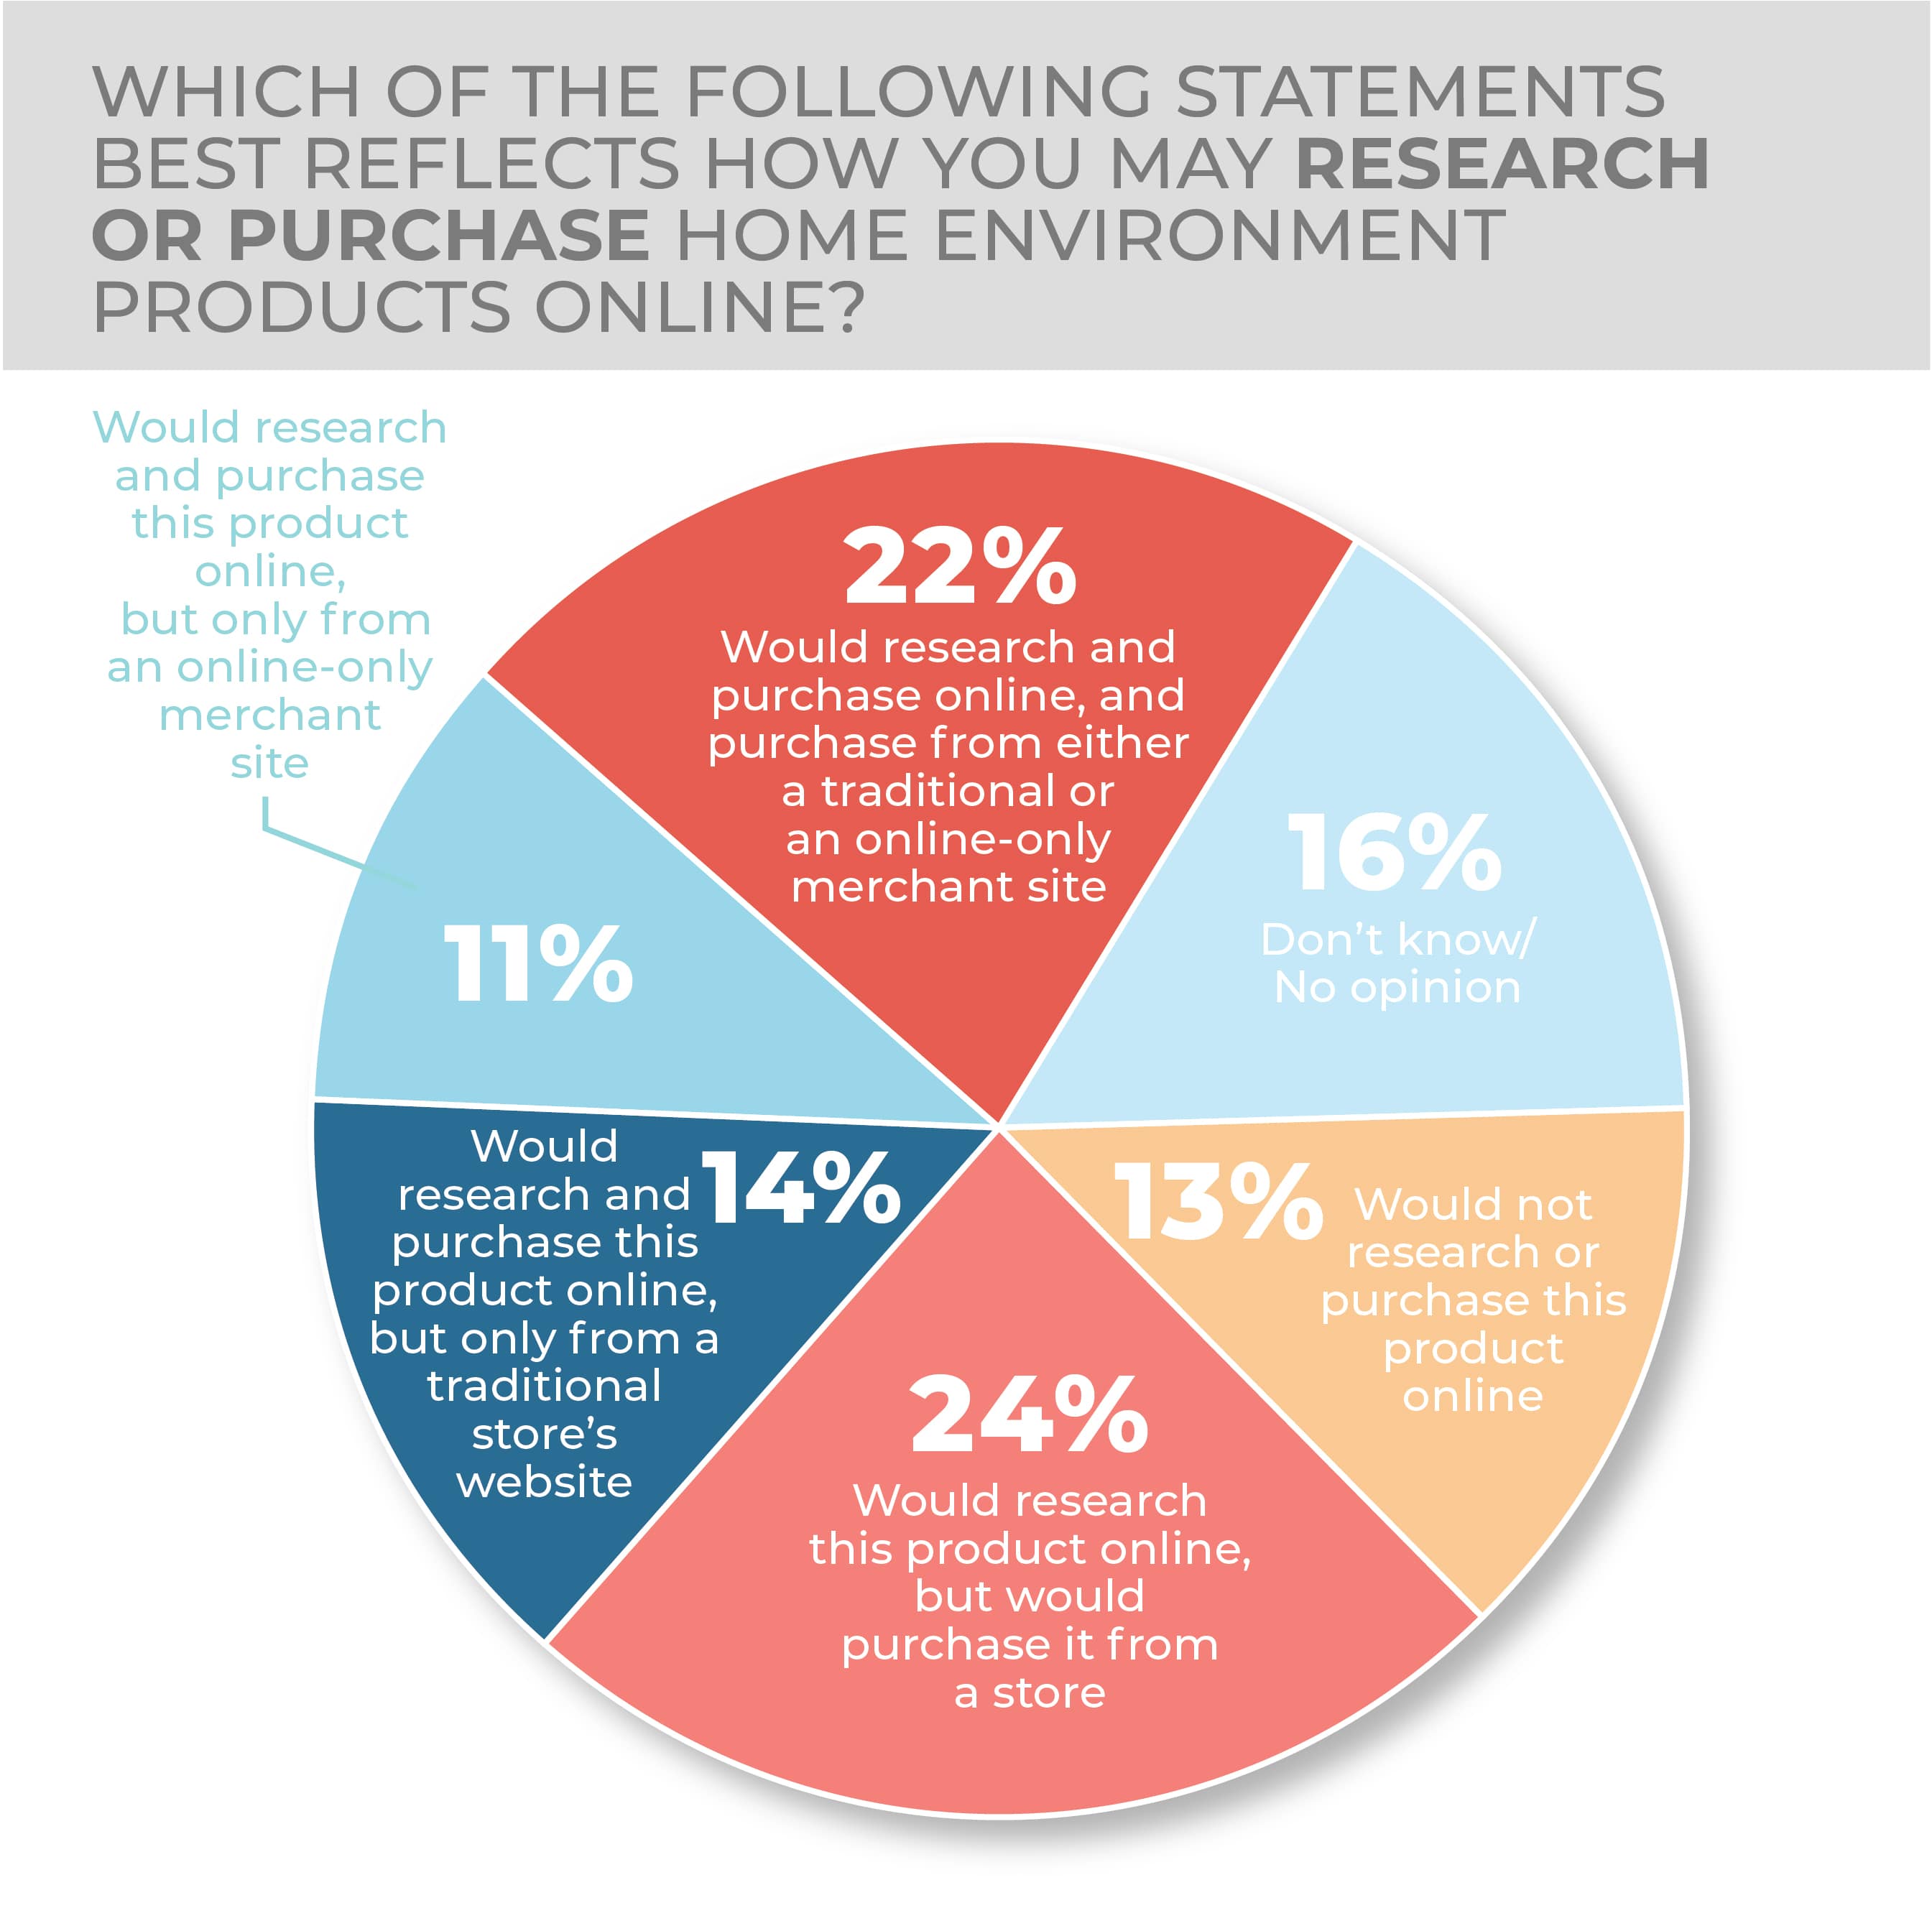
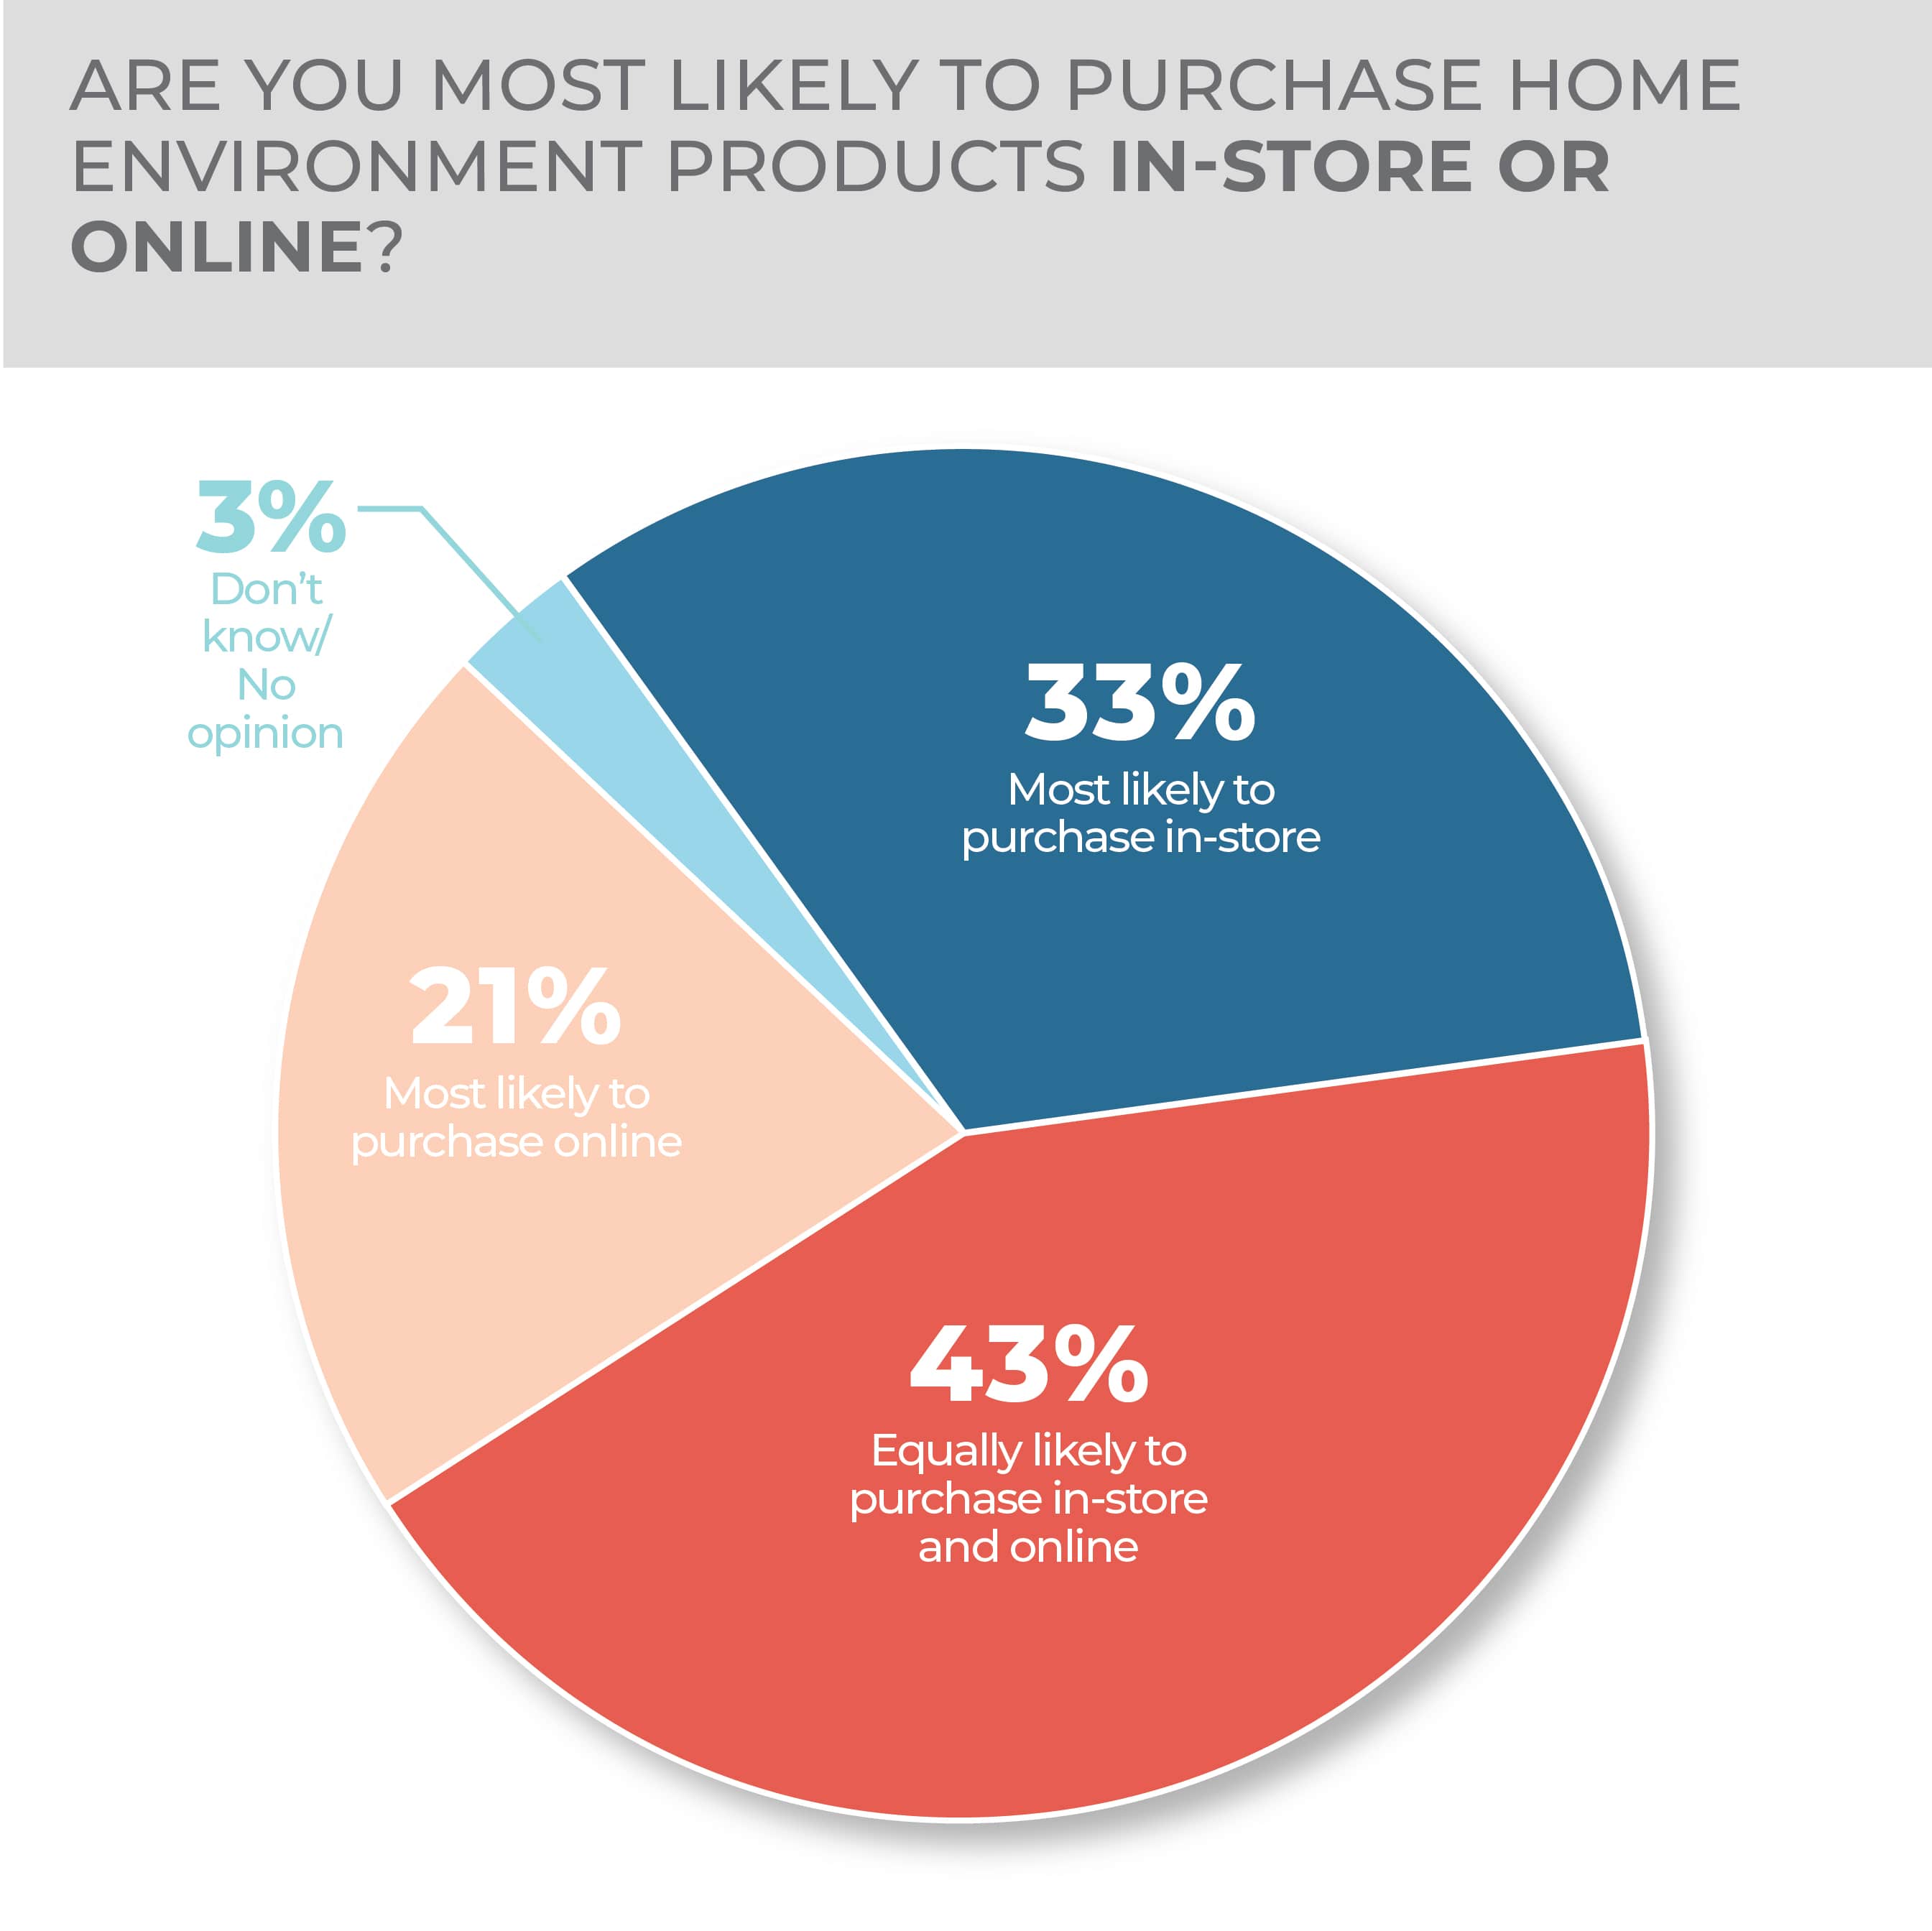
Consumers leaned toward researching online with would not research or purchase this product online at 13% and would research online and purchase in-store at 24%. That’s compared with 14% who would research and purchase online but from a traditional store website, 11% who would research online but purchase from an online-only merchant and 22% who would research and purchase online and buy from either an online only or traditional merchant. Some purchasing indecision exists in the category as 16% don’t know or have no opinion about where they would evaluate and finalize a purchase. When asked plainly where they would most likely purchase, in-store or online, survey respondents were more definitive, with 43% saying online or in-store, 33% saying in-store and 21% saying online. Only 4% didn’t know or had no opinion.
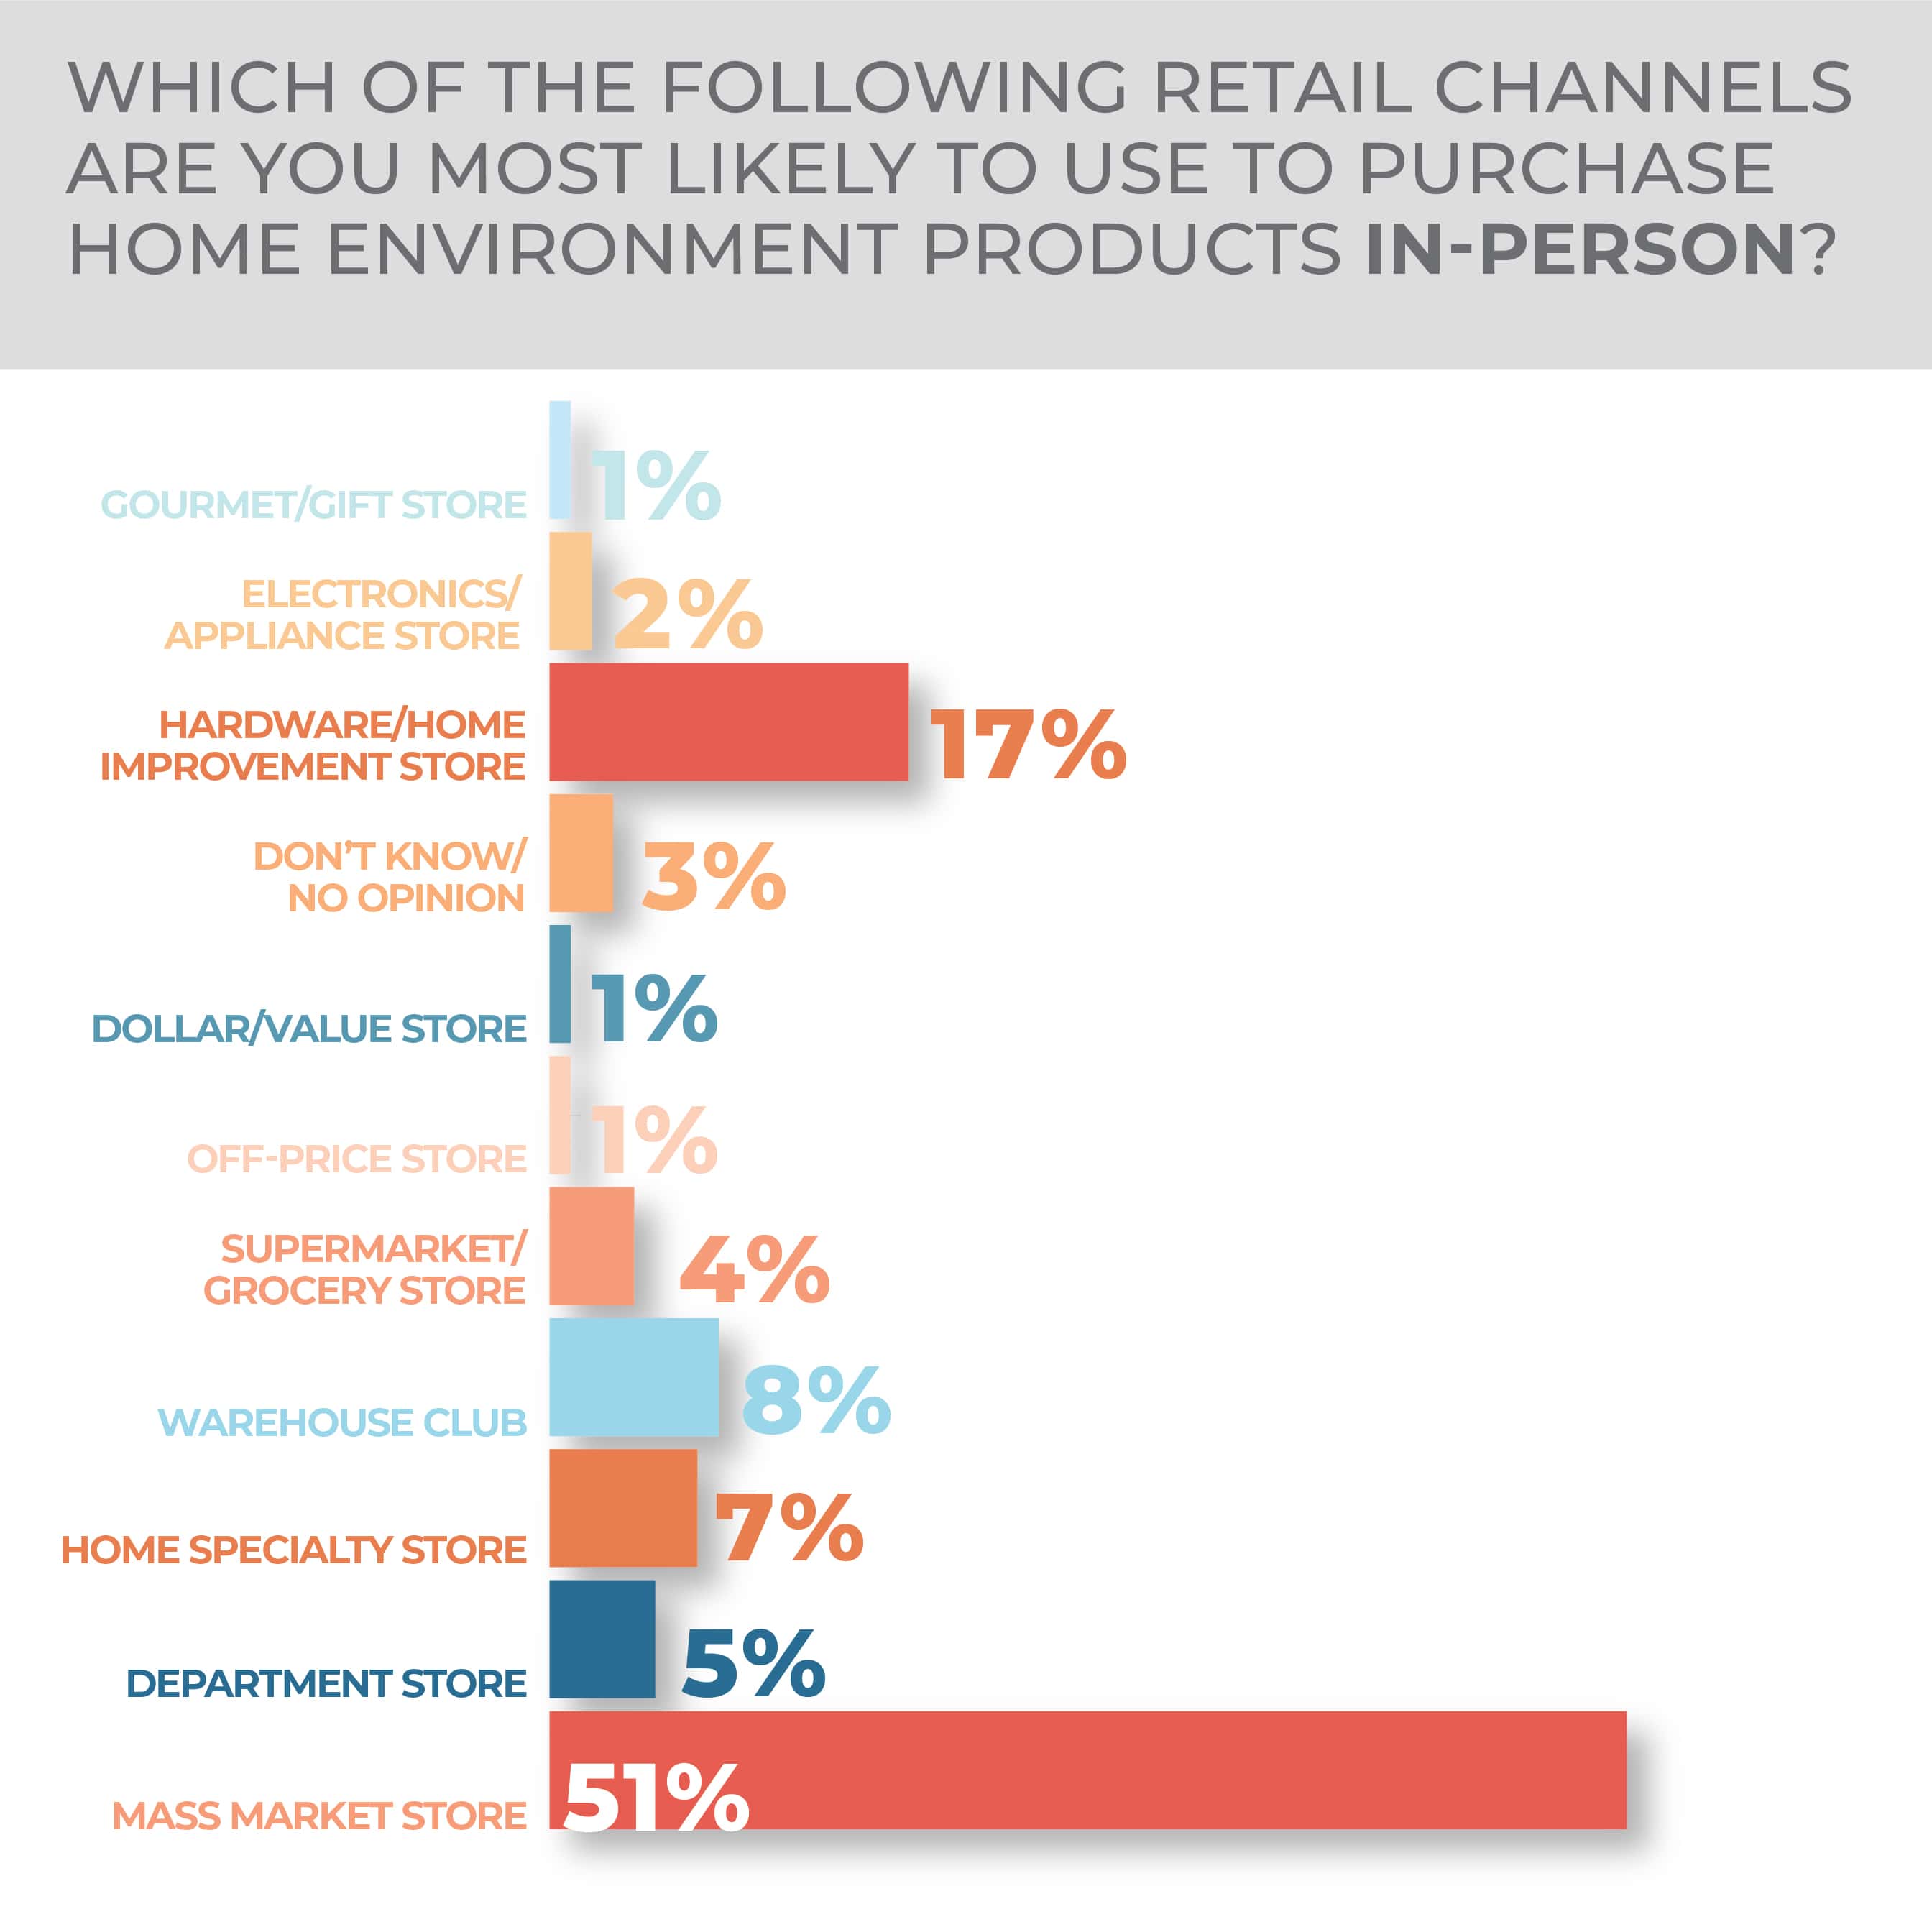
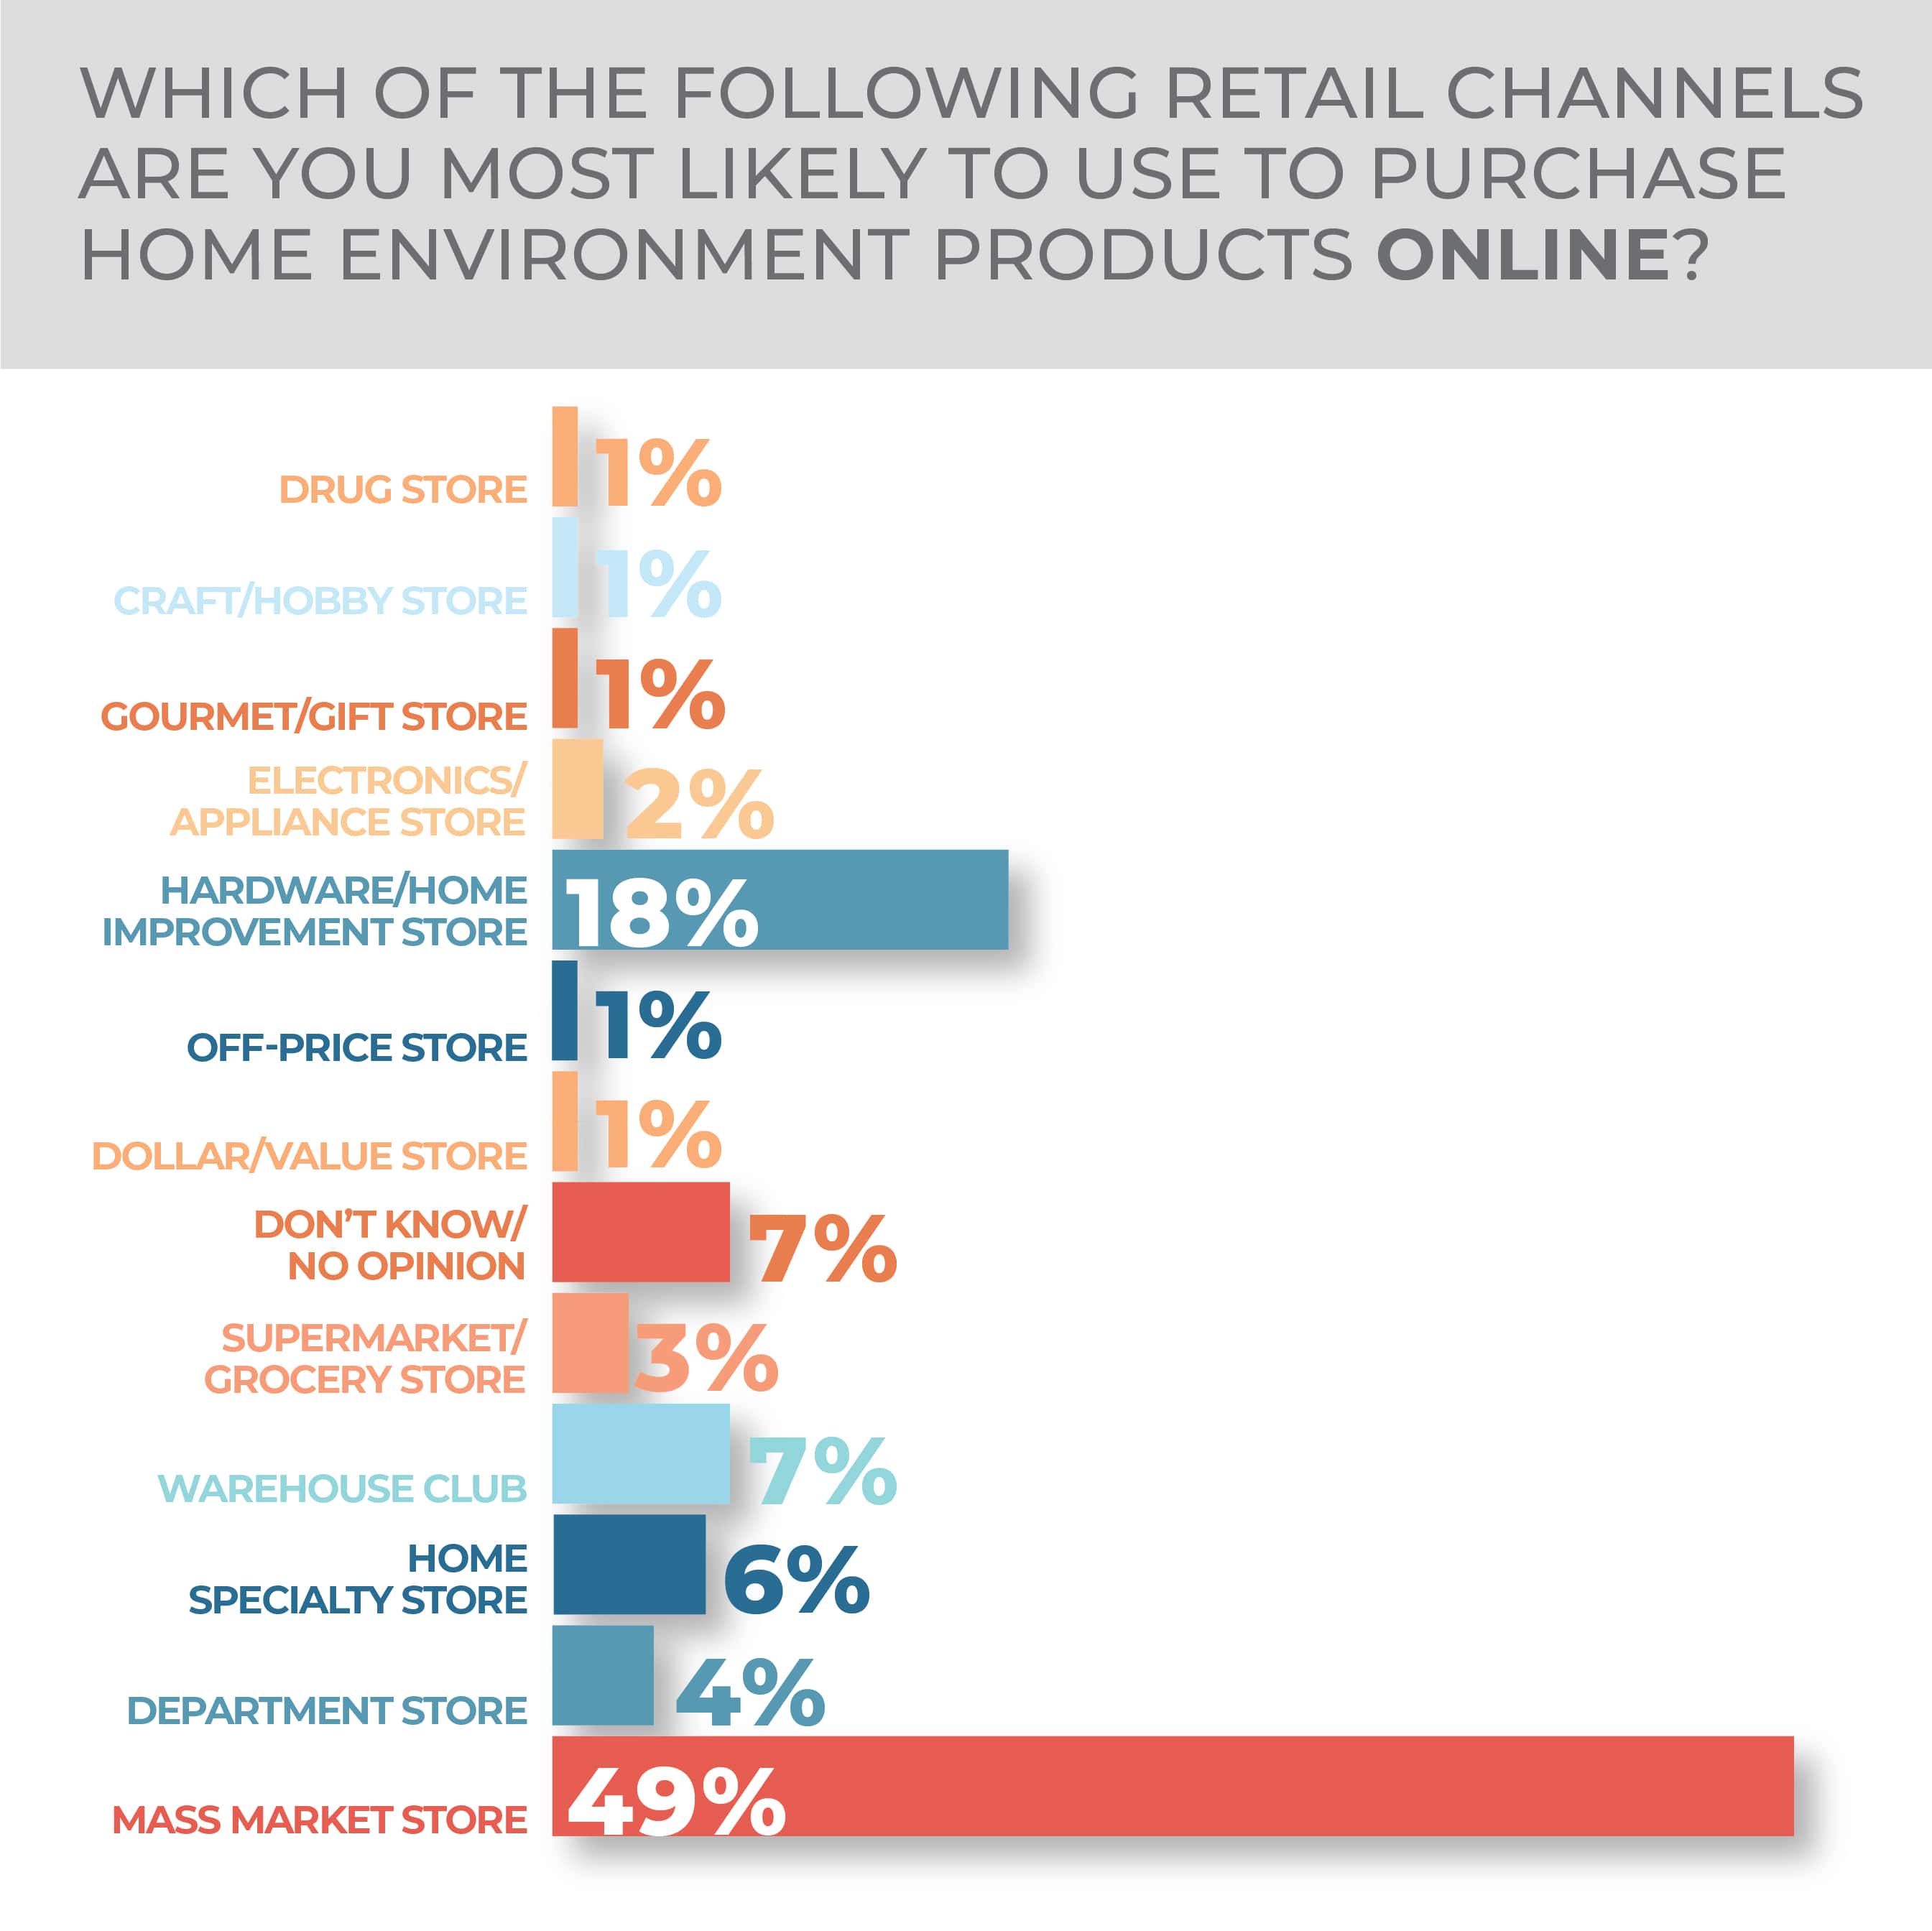
When buying in-person, 51% of consumers would pick a mass merchant as top among the big three finishers in the category, with 17% choosing a hardware or home improvement store and 8% choosing a warehouse club. Online, the top three came in at 49% mass merchant, 18% hardware or home improvement store and 7% warehouse club.
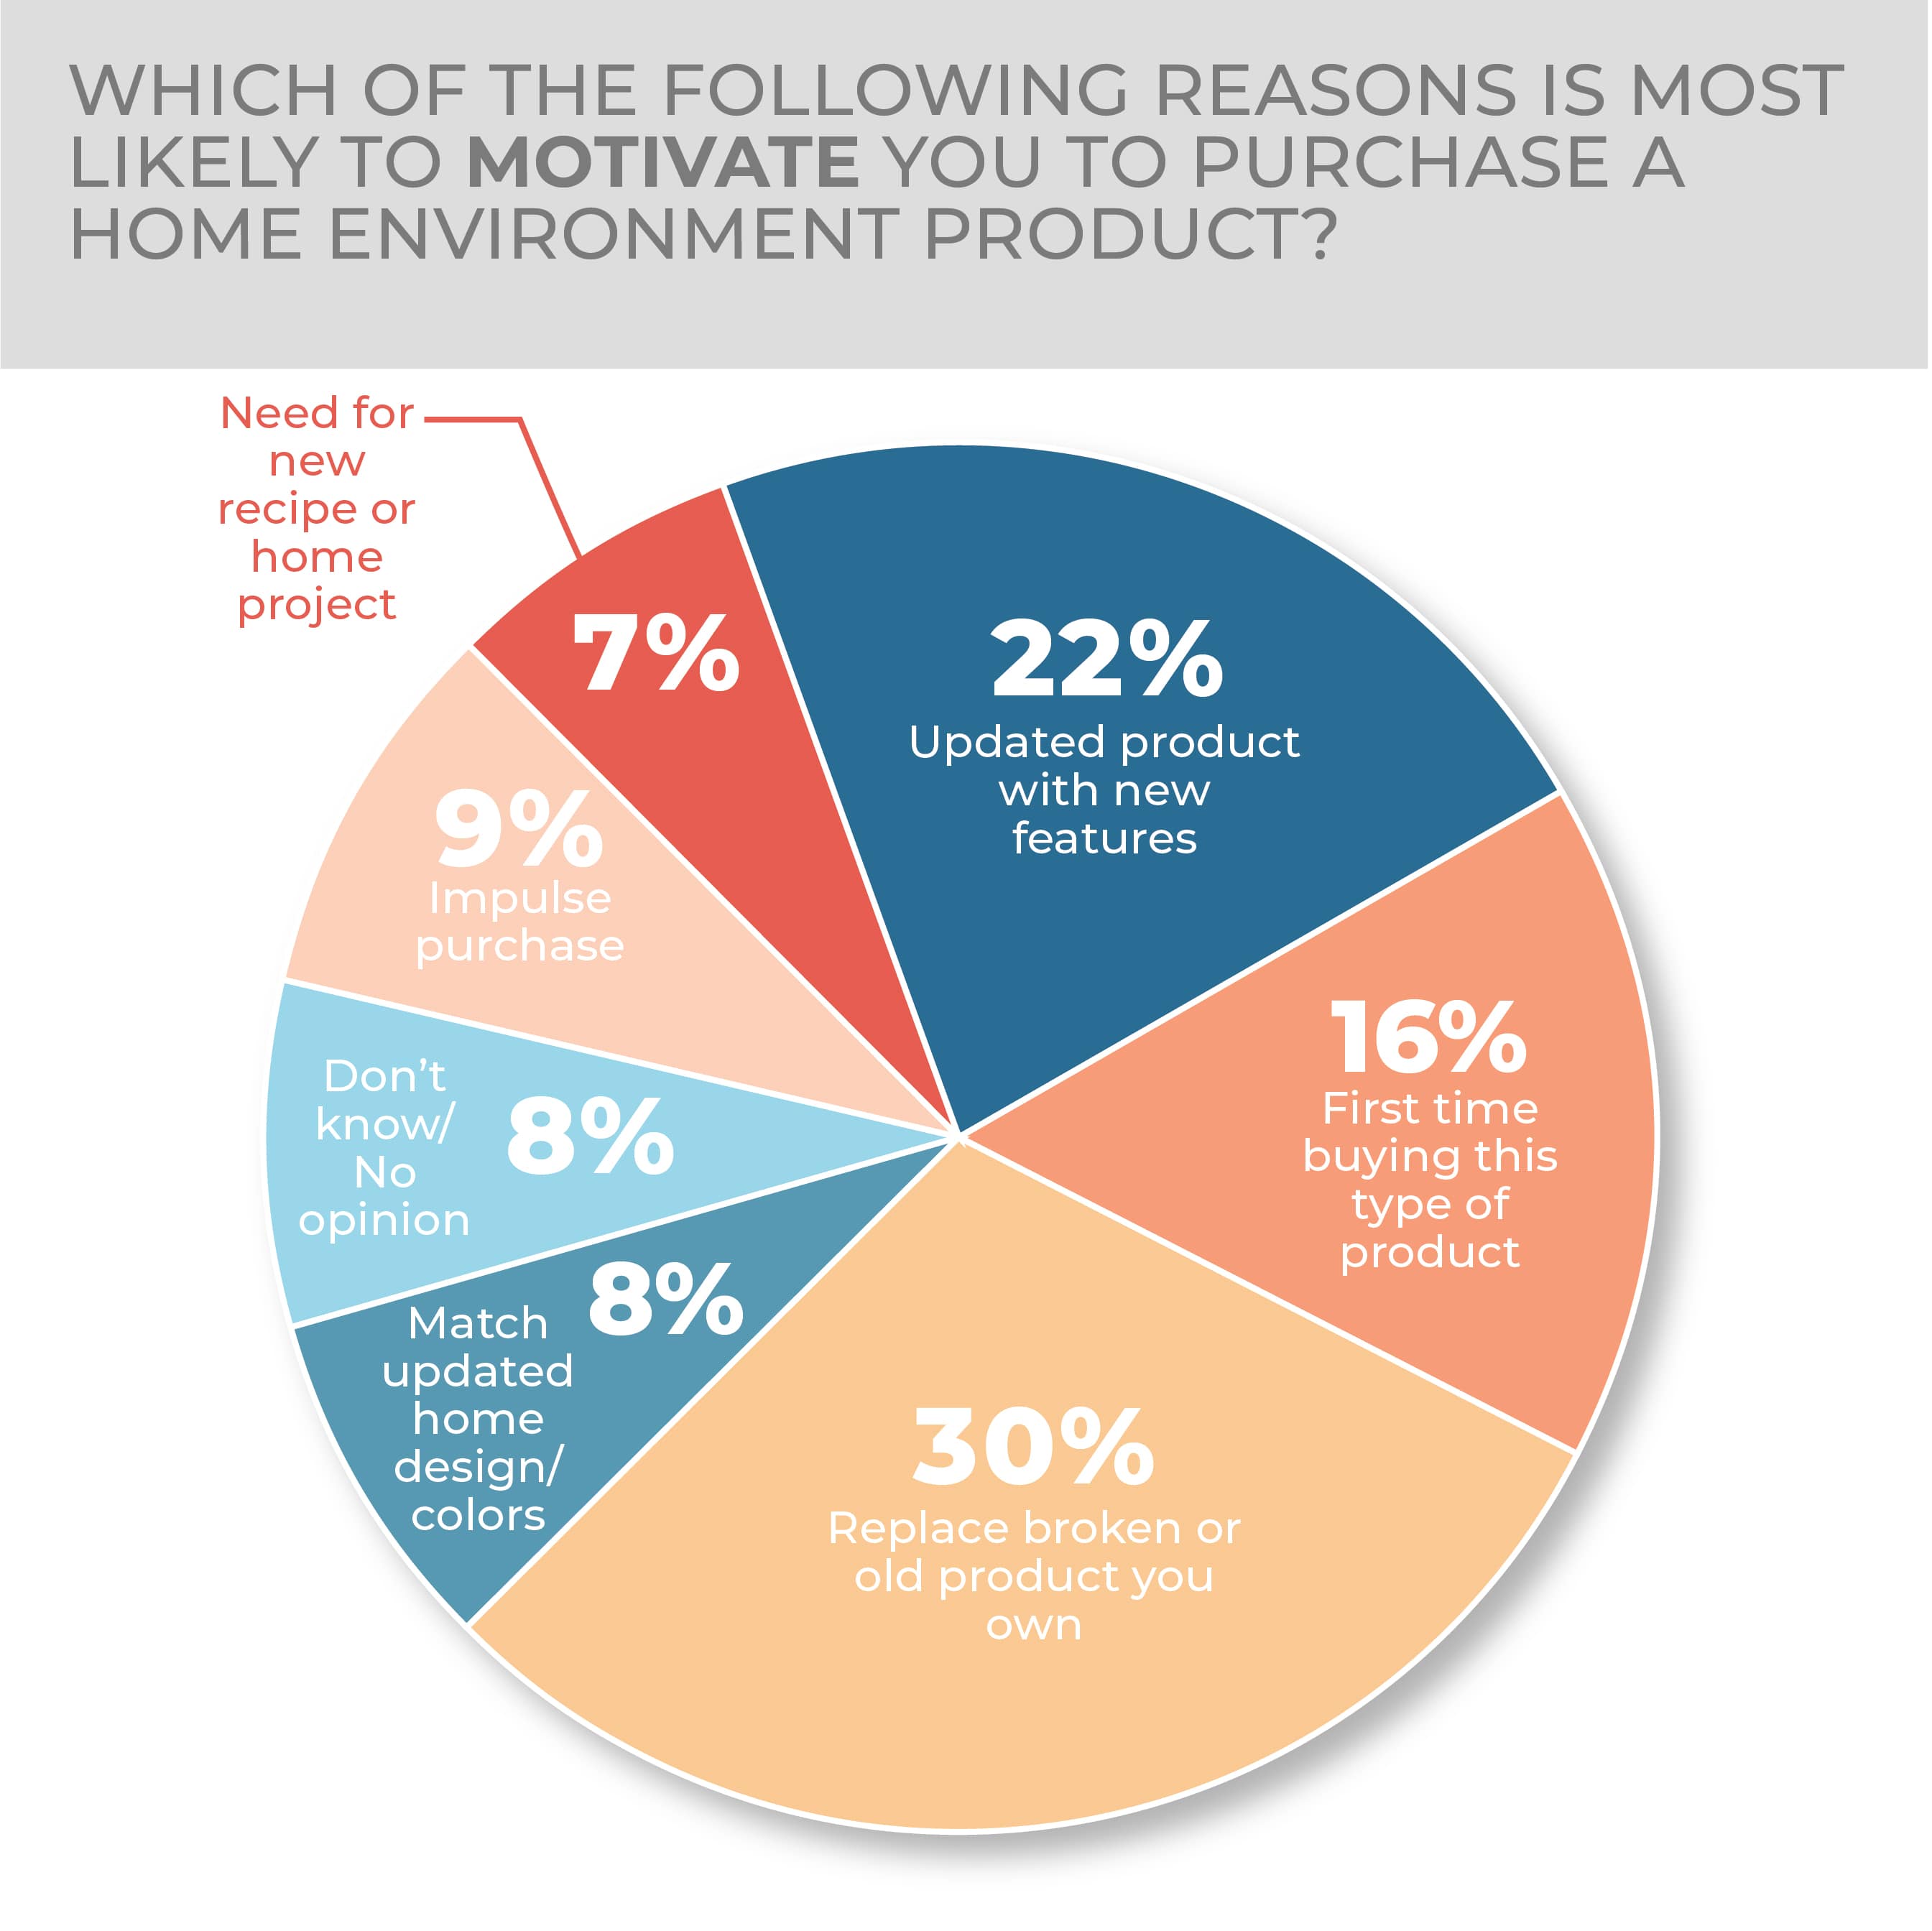
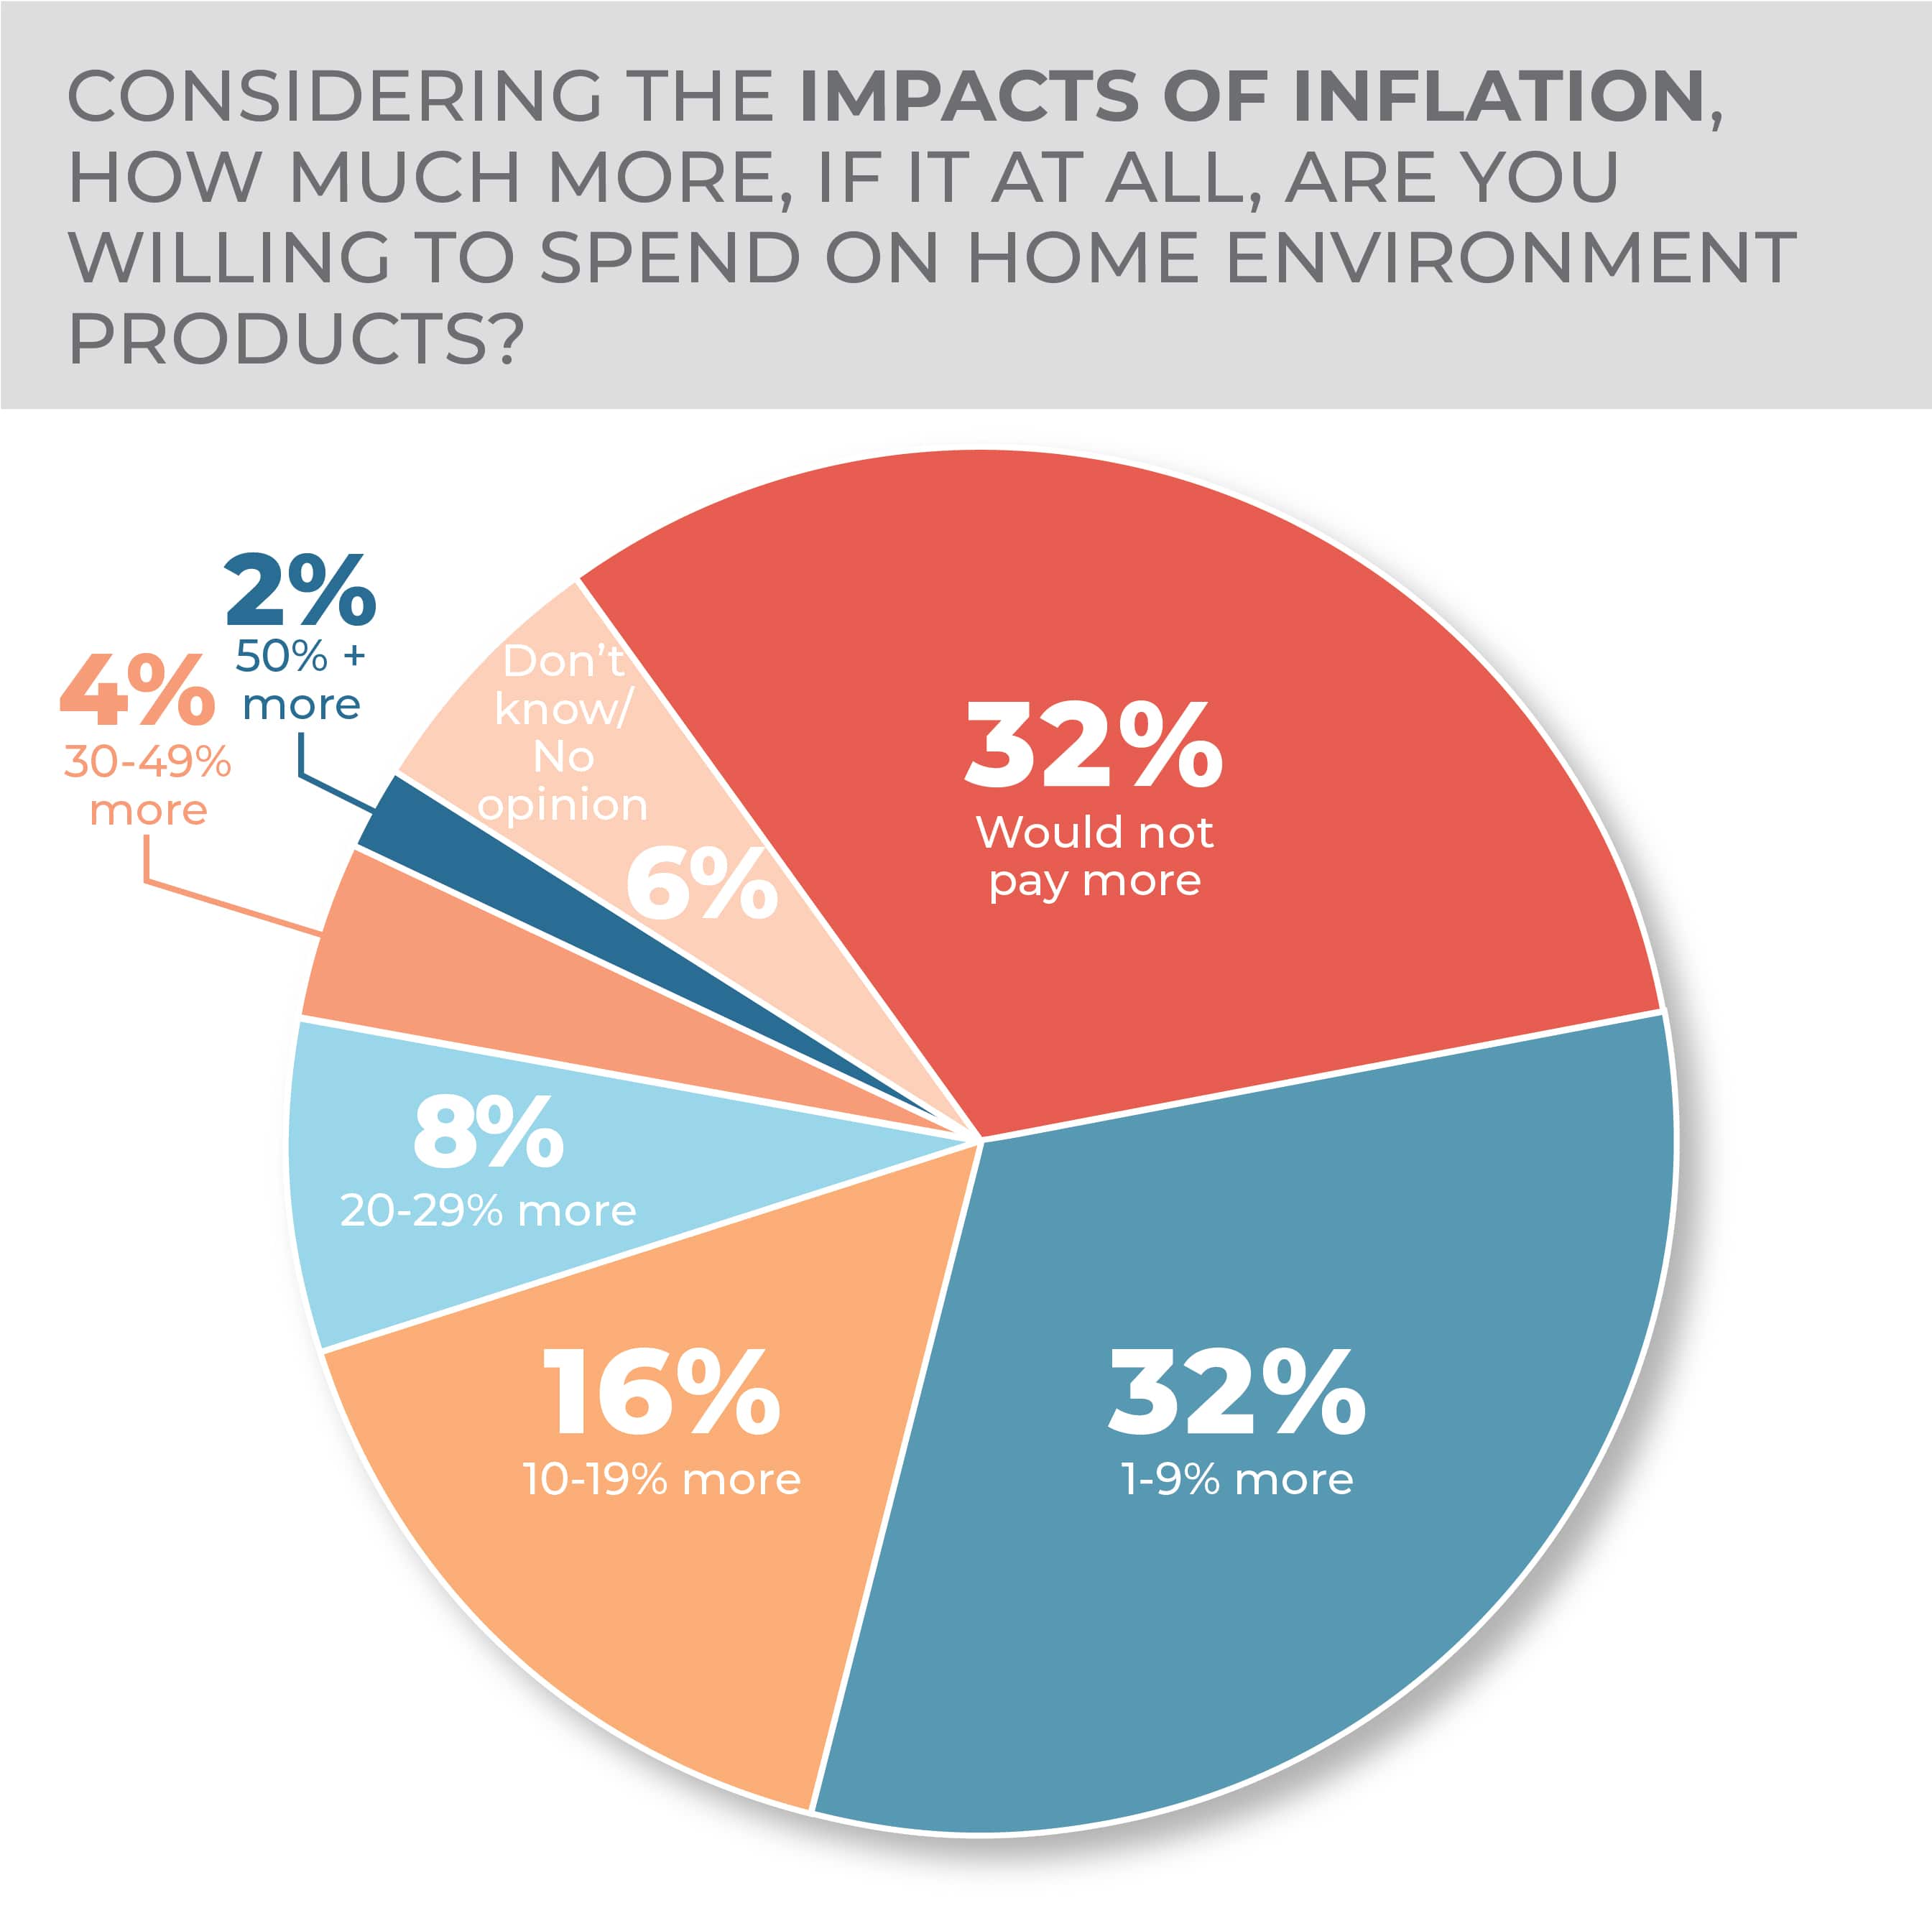
Consumers were willing to spend more on home environment products given inflation, or most were: 32% of survey respondents said they wouldn’t spend any more for a home environment product while the same proportion said 1% to 9% more and 16% said 10% to 19% more.
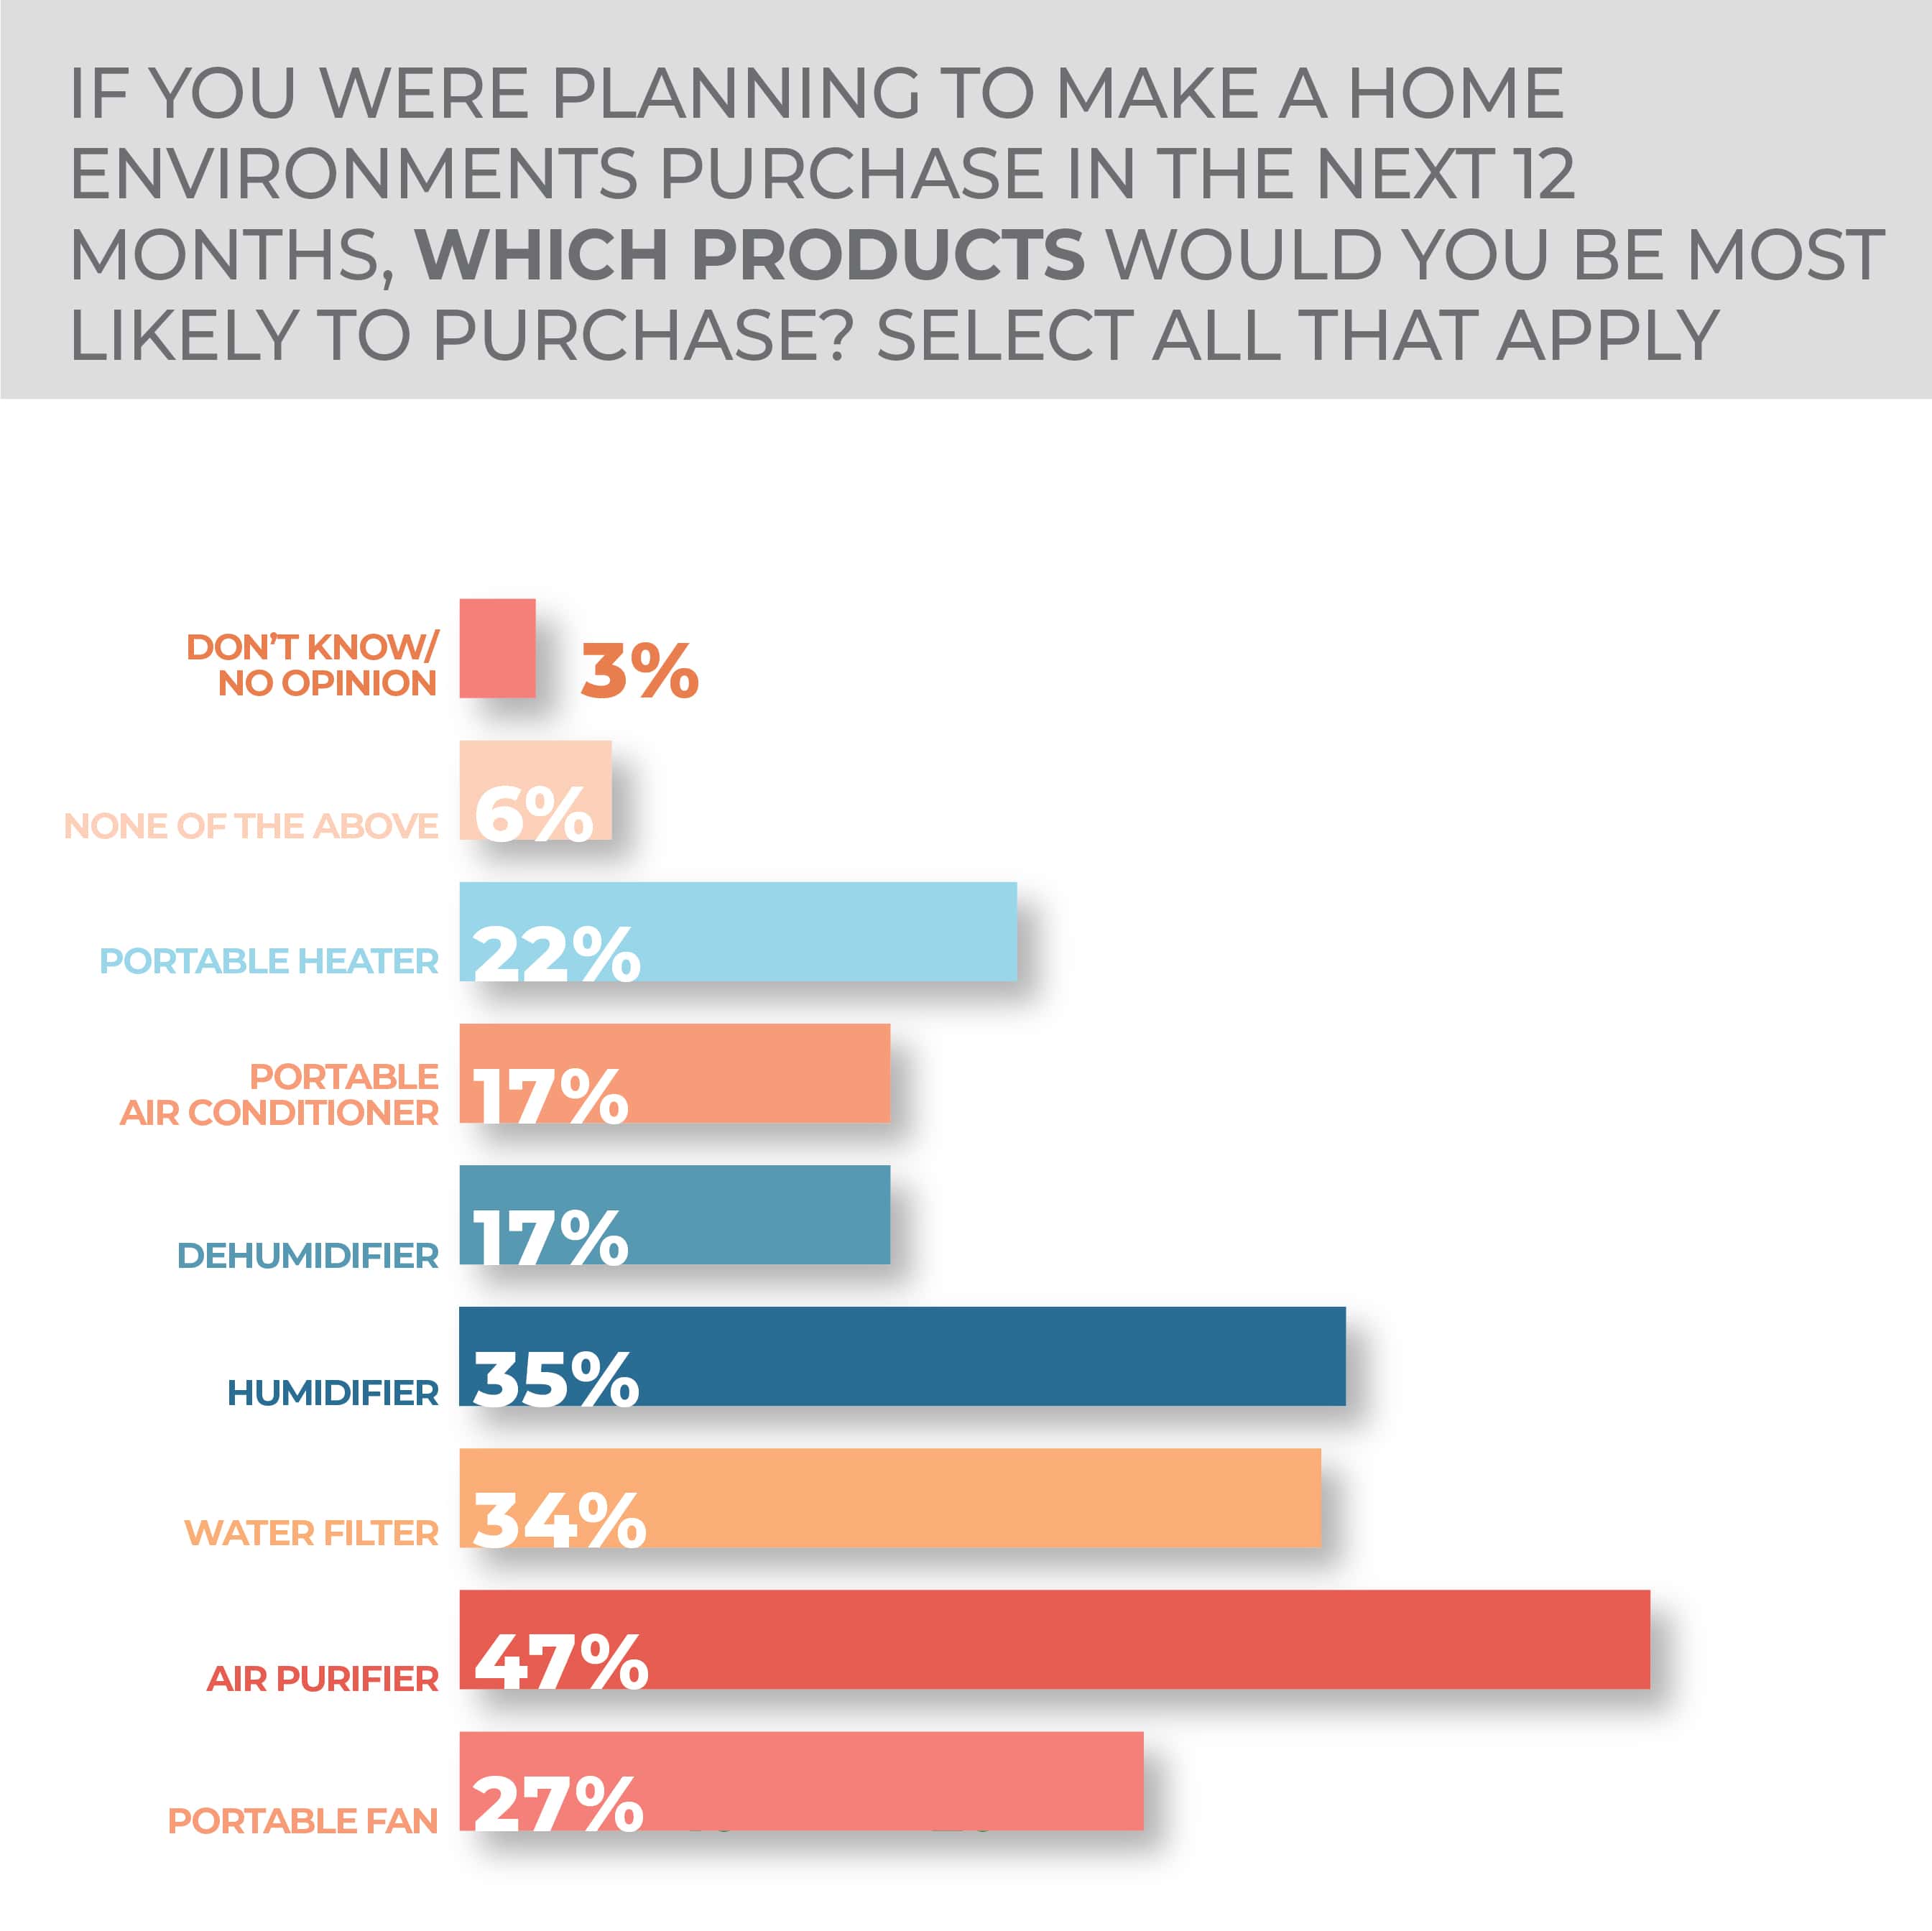
The leader on the product potential purchase list was air purifiers at 47%, humidifiers at 35% and water filters at 34%. Following were portable fans at 27%, portable heaters at 22%, and, in a tie at 17%, portable air conditioners and dehumidifiers. Substantive changes year over year included a four-point gain in humidifier purchase consideration, a seven-point drop in dehumidifier consideration, a four-point drop in the portable air conditioner intention and a three-point drop in the portable heater intention.
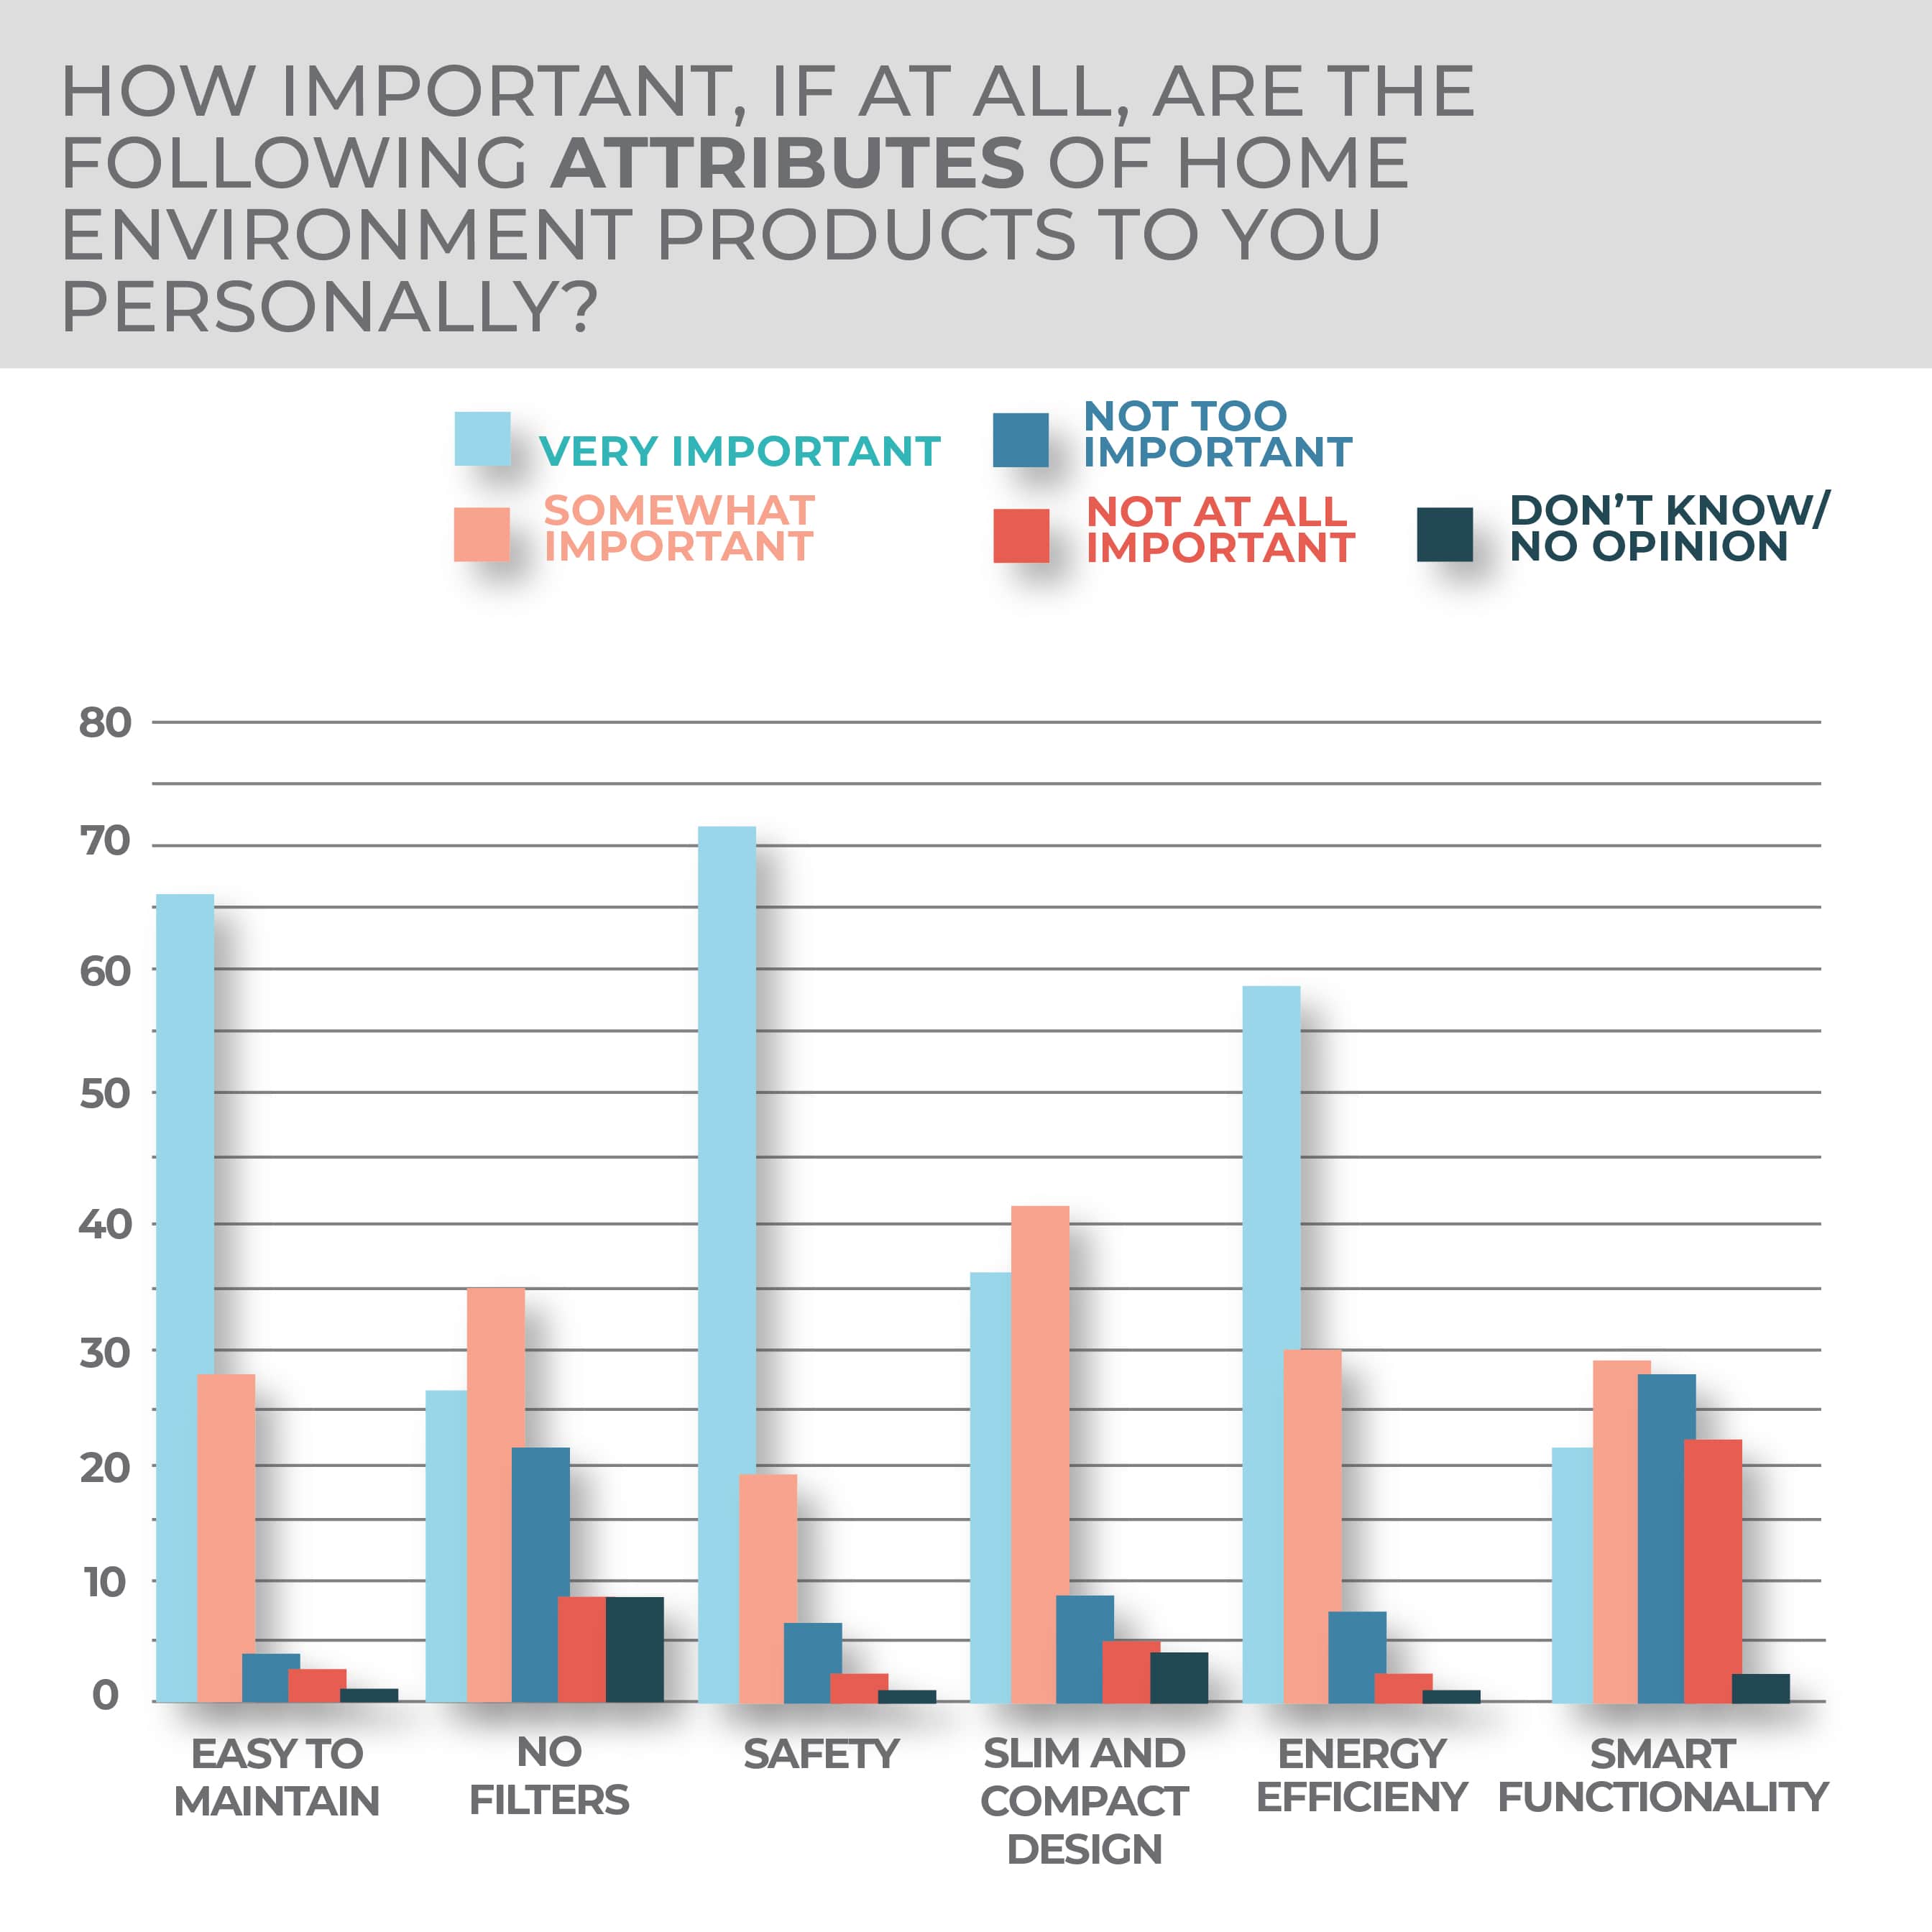
As for top product characteristics, 72% of survey respondents said safety was very and 19% said somewhat important, while 66% of consumers said ease of maintenance was very and 27% said somewhat important, and 59% of consumers said energy efficiency was very and 30% said somewhat important. Almost half of the consumers responding to the survey said smart functionality such as WiFi-enabled control was a consideration for them when it comes to home environment products, with 21% saying it’s very important and 28% saying somewhat important.
Women at 14% very and 26% somewhat, were almost flat with men at 13% very and 26% somewhat likely to purchase a home environment product in the year ahead when it comes down to demographics. As is true of other survey categories, younger consumers again were the most likely to purchase, with 18-34-year-olds 22% very and 34% somewhat likely to purchase, 35 to 44-year-olds 18% very and 30% somewhat likely to purchase, 45-64-year-olds 9% very and 22% somewhat likely to purchase and 65 and over 5% very and 18% somewhat likely to purchase.
By region, Southerners were most intent on purchasing at 15% very and 26% somewhat likely to purchase, while Westerners were 13% very and 29% somewhat likely to purchase, and Northeasterners at 13% and 24% and Midwesterners at 12% and 24%, respectively
More Home Environment Findings:
Kitchen Electrics
After a sales surge in category purchasing over the past few years, with multicookers and air fryers being among those products driving momentum, it might be forgivable to imagine a kitchen electrics sales slump in the year ahead, but that doesn’t seem to be in the cards.
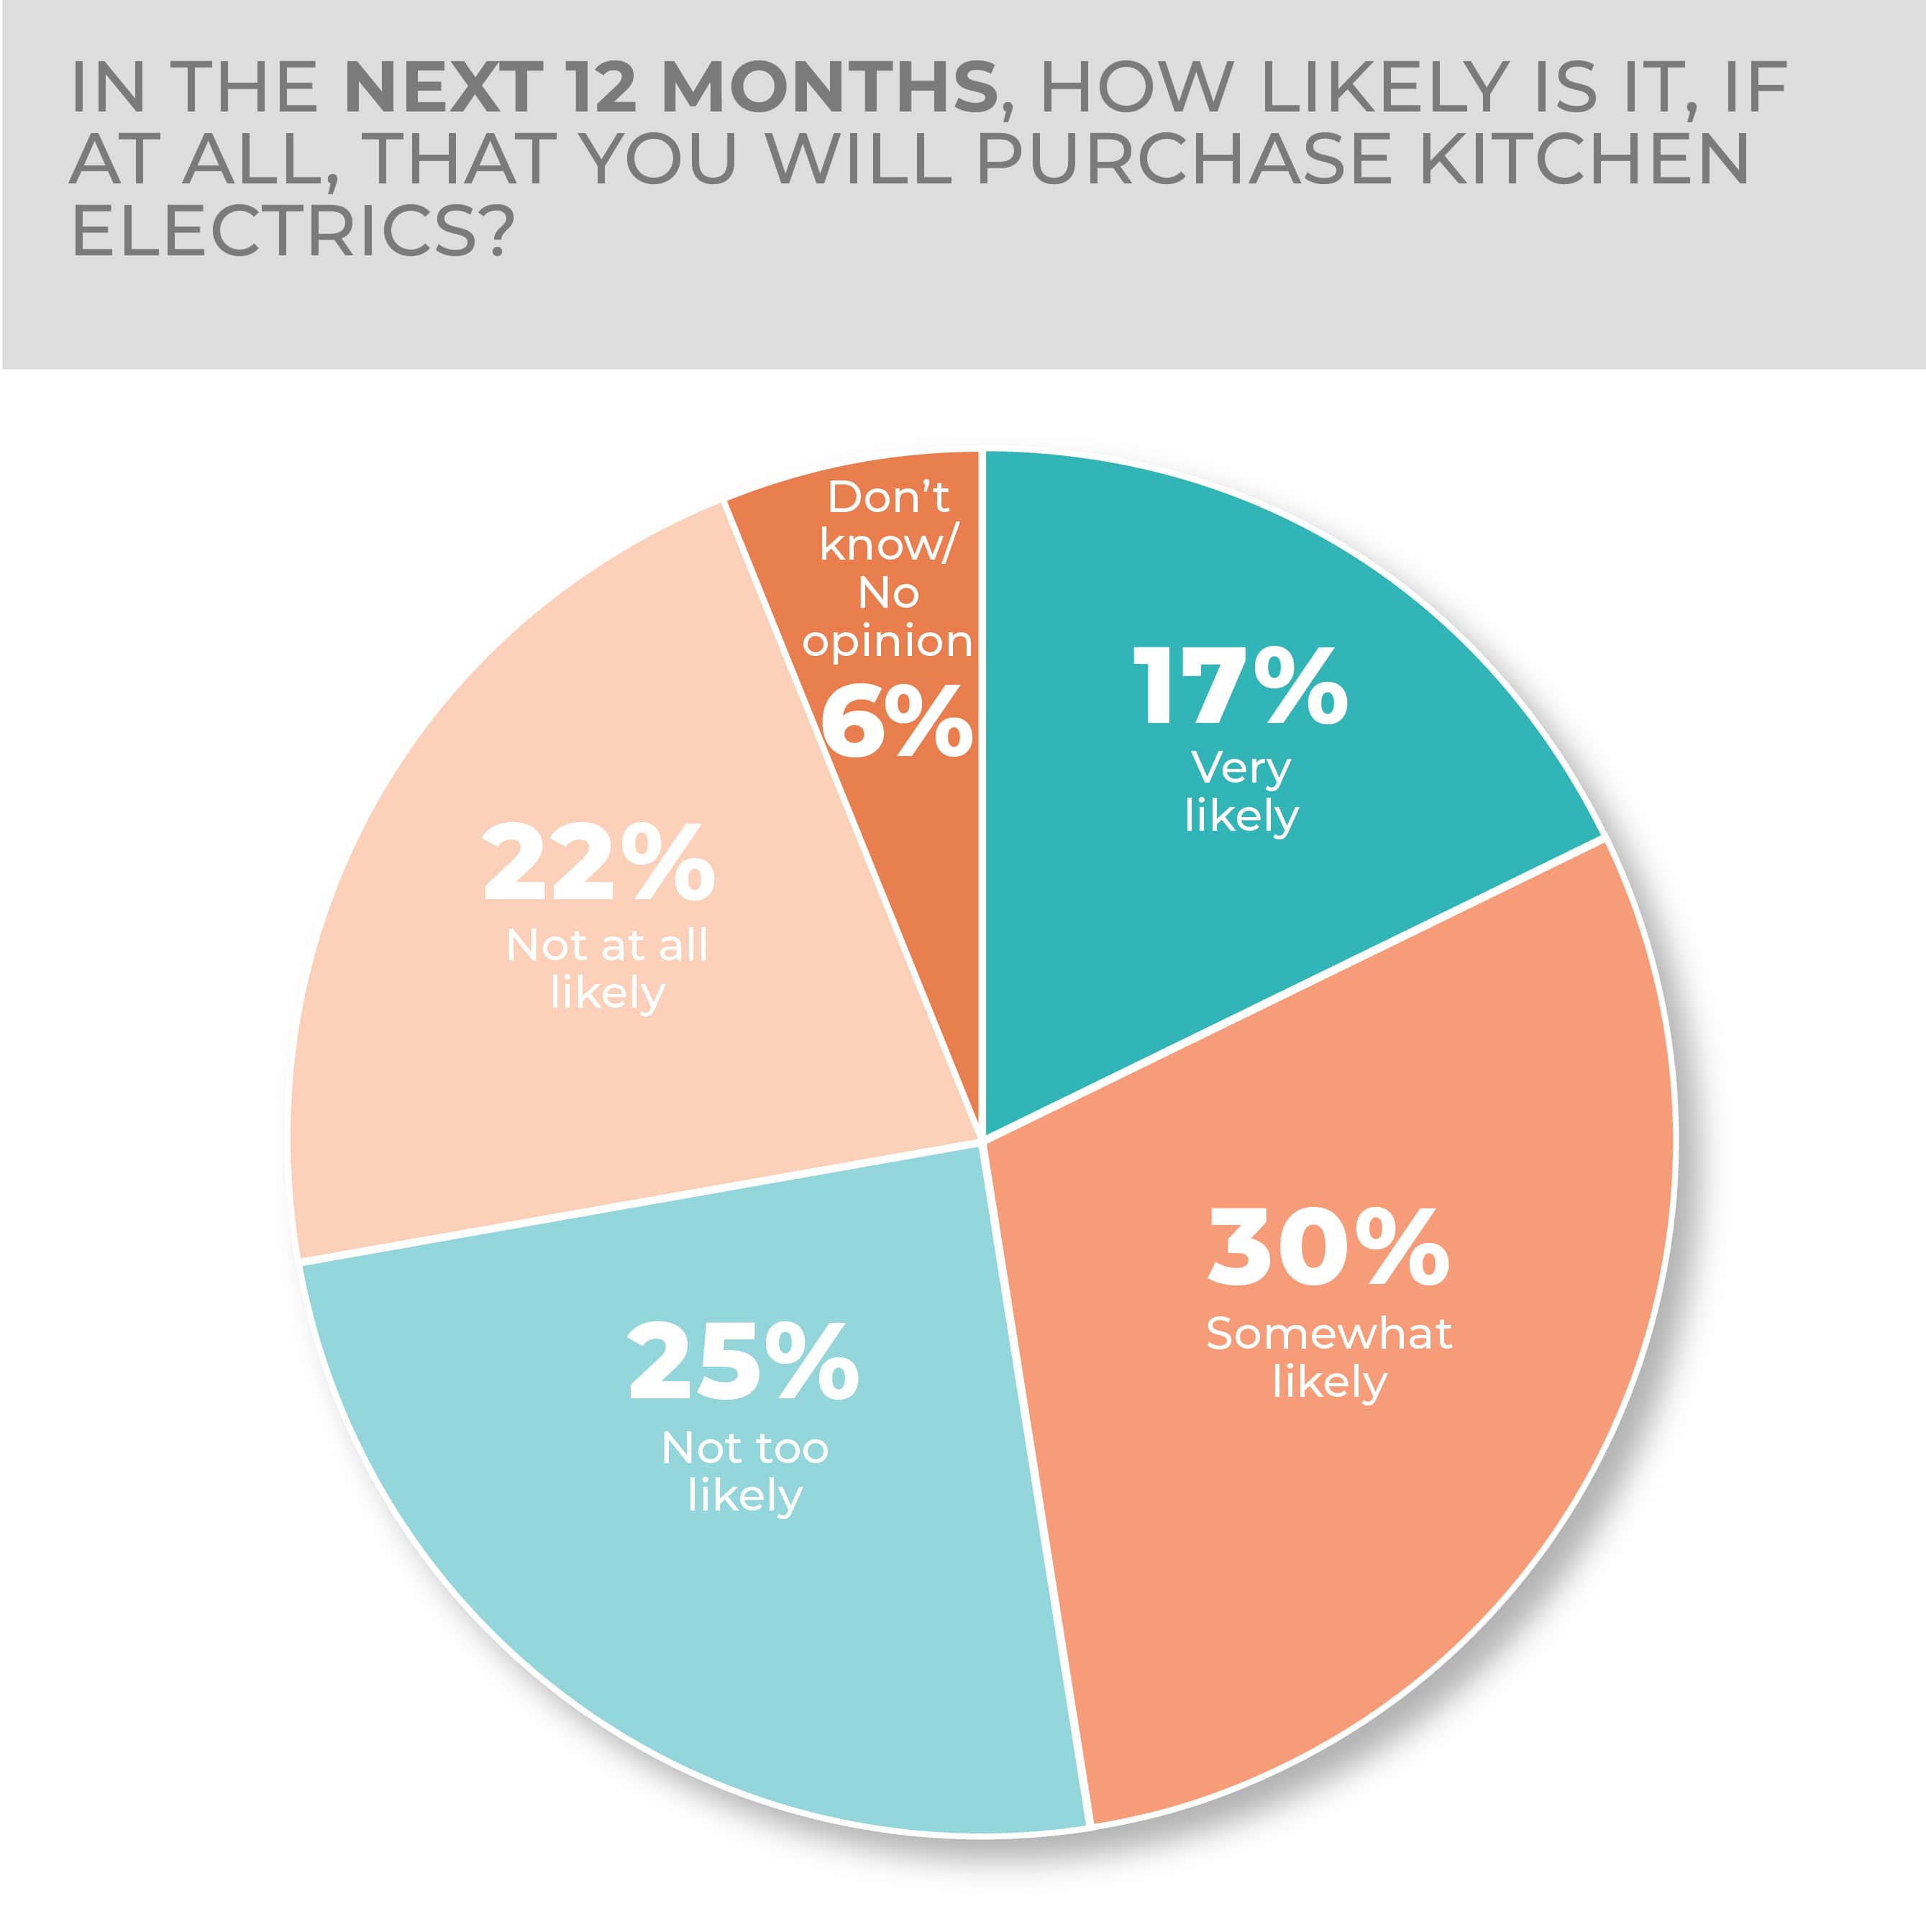
Intention is down, with 17% of respondents to the HomePage News 2023 Consumer Outlook Survey saying they were very likely to purchase kitchen electrics and 30% somewhat likely versus 21% and 29% in the year-prior study, but the combined figure is only down three points. So almost half of consumers may purchase in the year ahead.
-
- Older Millennials are most likely to purchase kitchen electrics, but older Gen Z and younger Millennials are almost neck and neck with them.
- Consumers still like to purchase kitchen electrics in stores with 42% saying they would buy in-store or online and more than 37% saying they would buy only in-store, with mass merchants dominating as physical and omnichannel destinations.
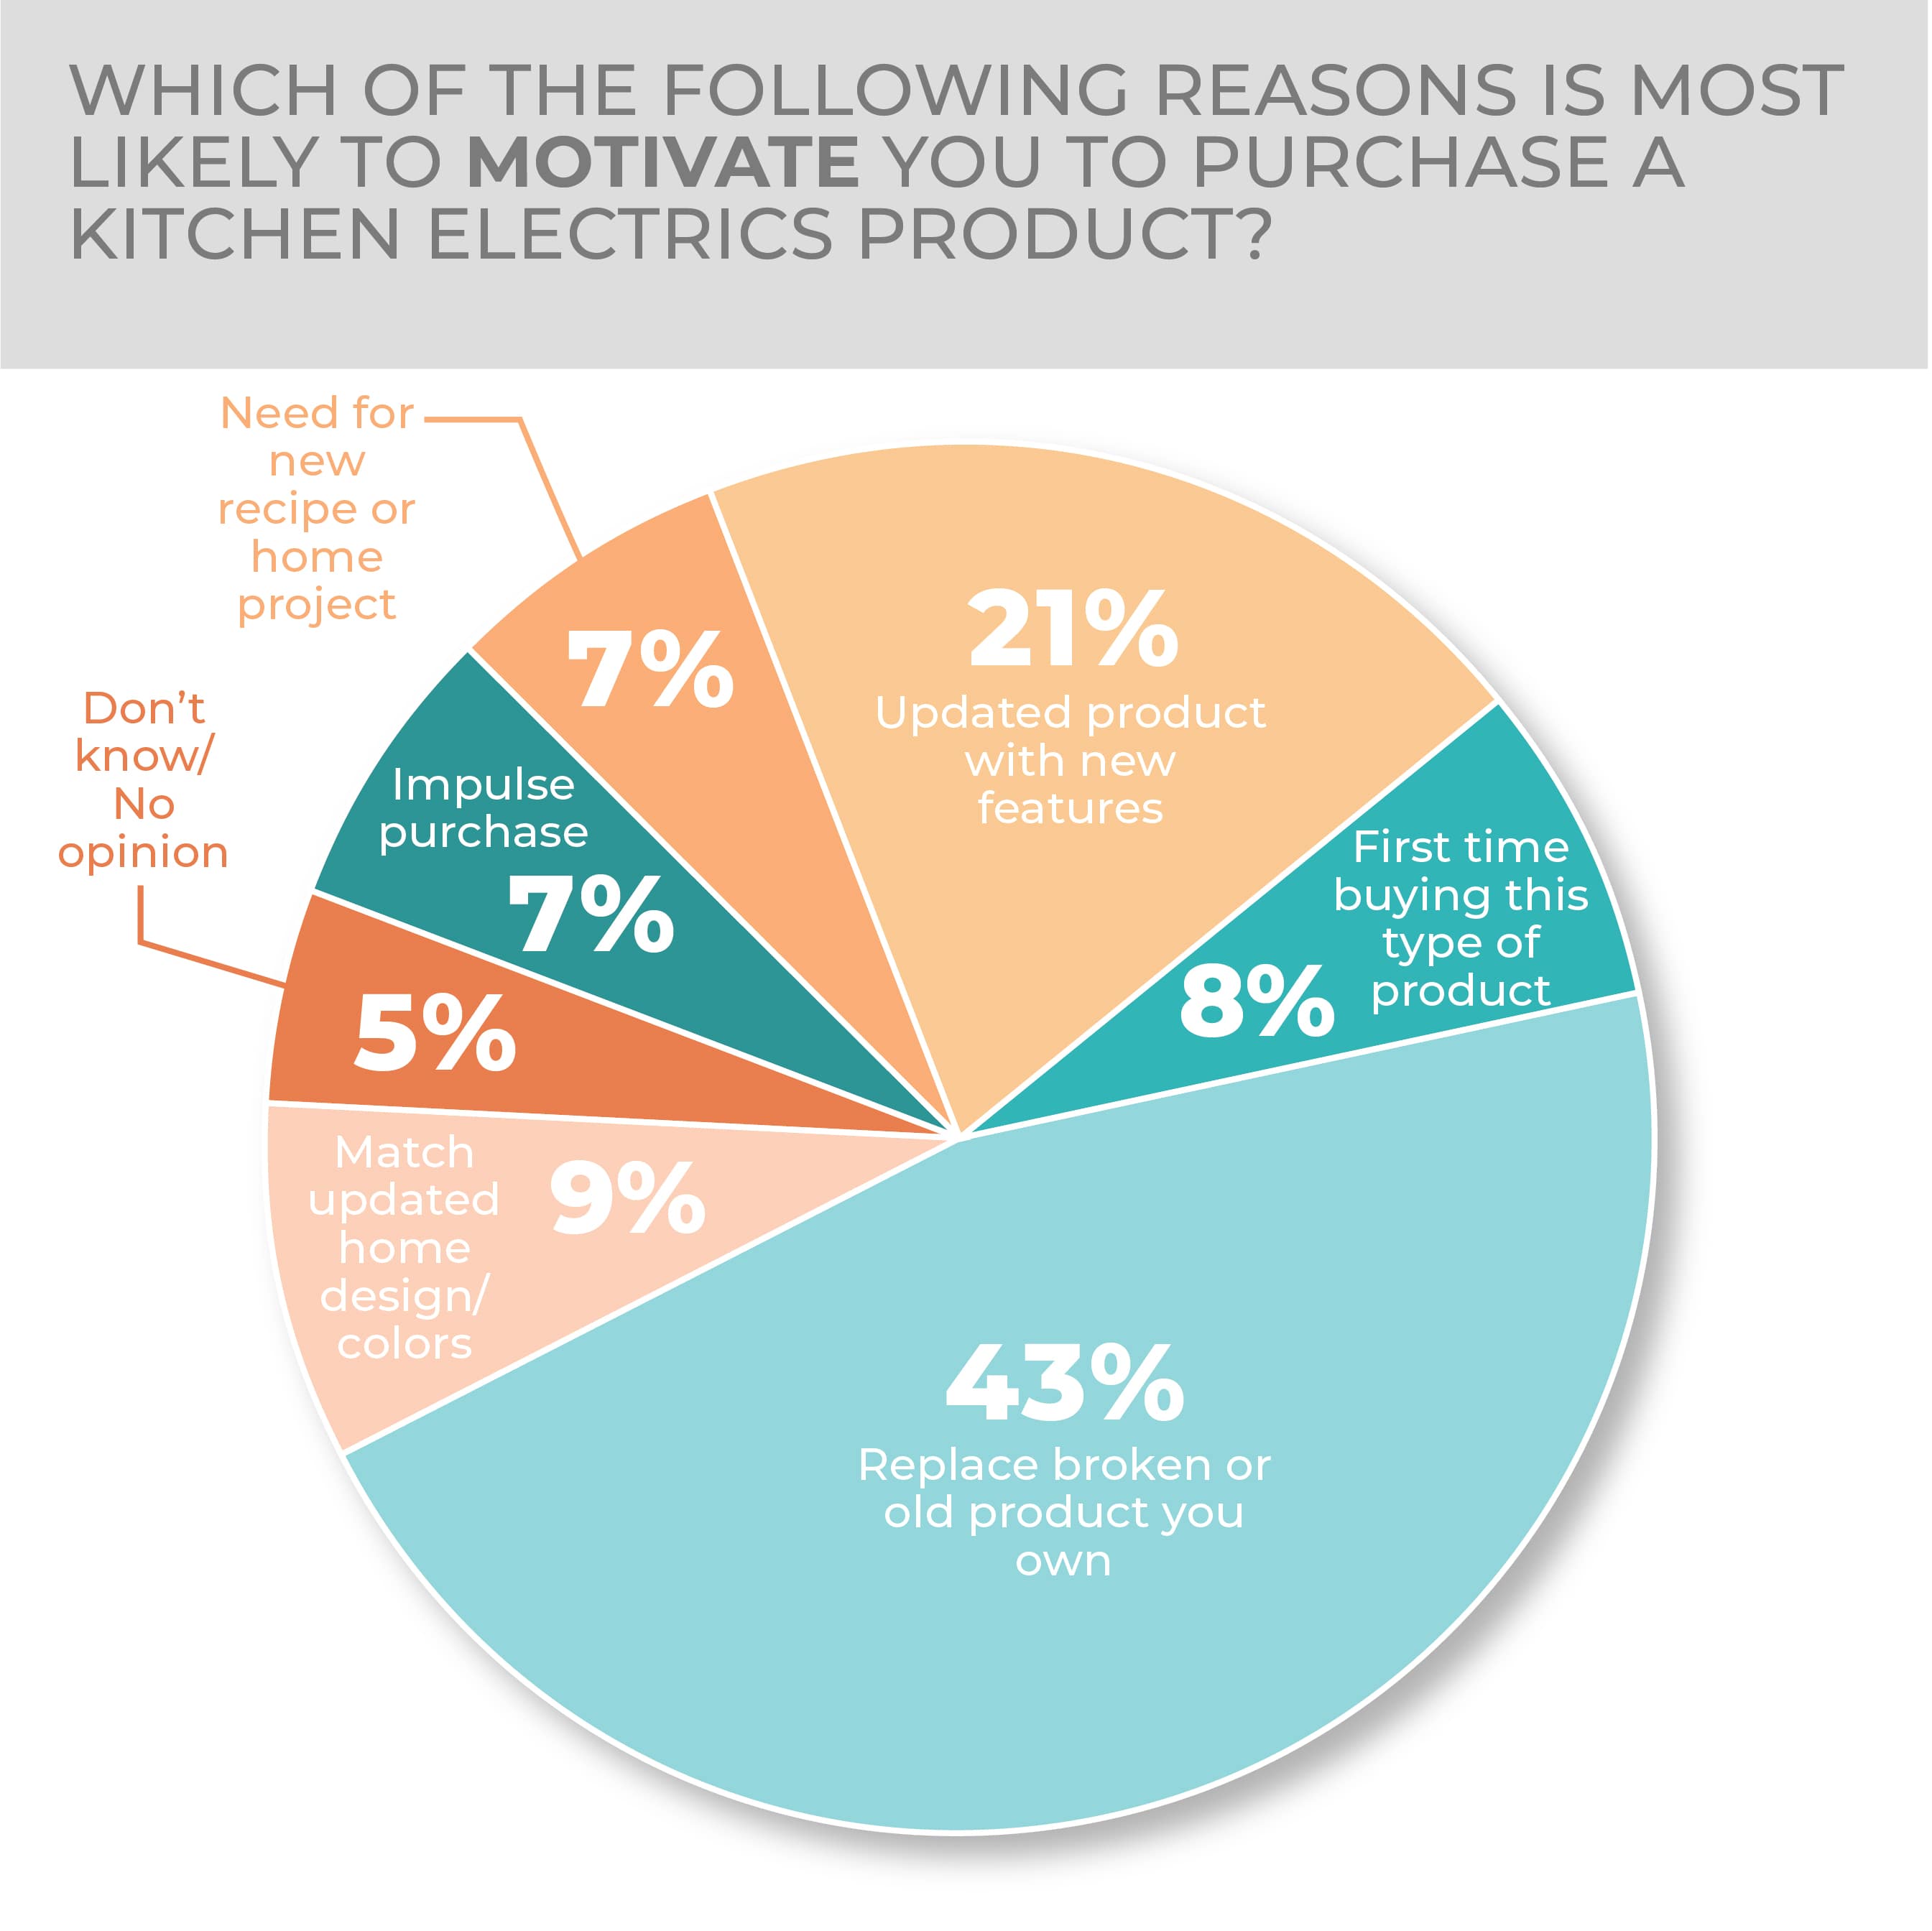
Replacement is the main motivation to purchase at 43%, only two points higher than in the year-earlier survey, while the desire to enjoy new features is down two points to 21%. Little year-over-year change in motivation is evident.
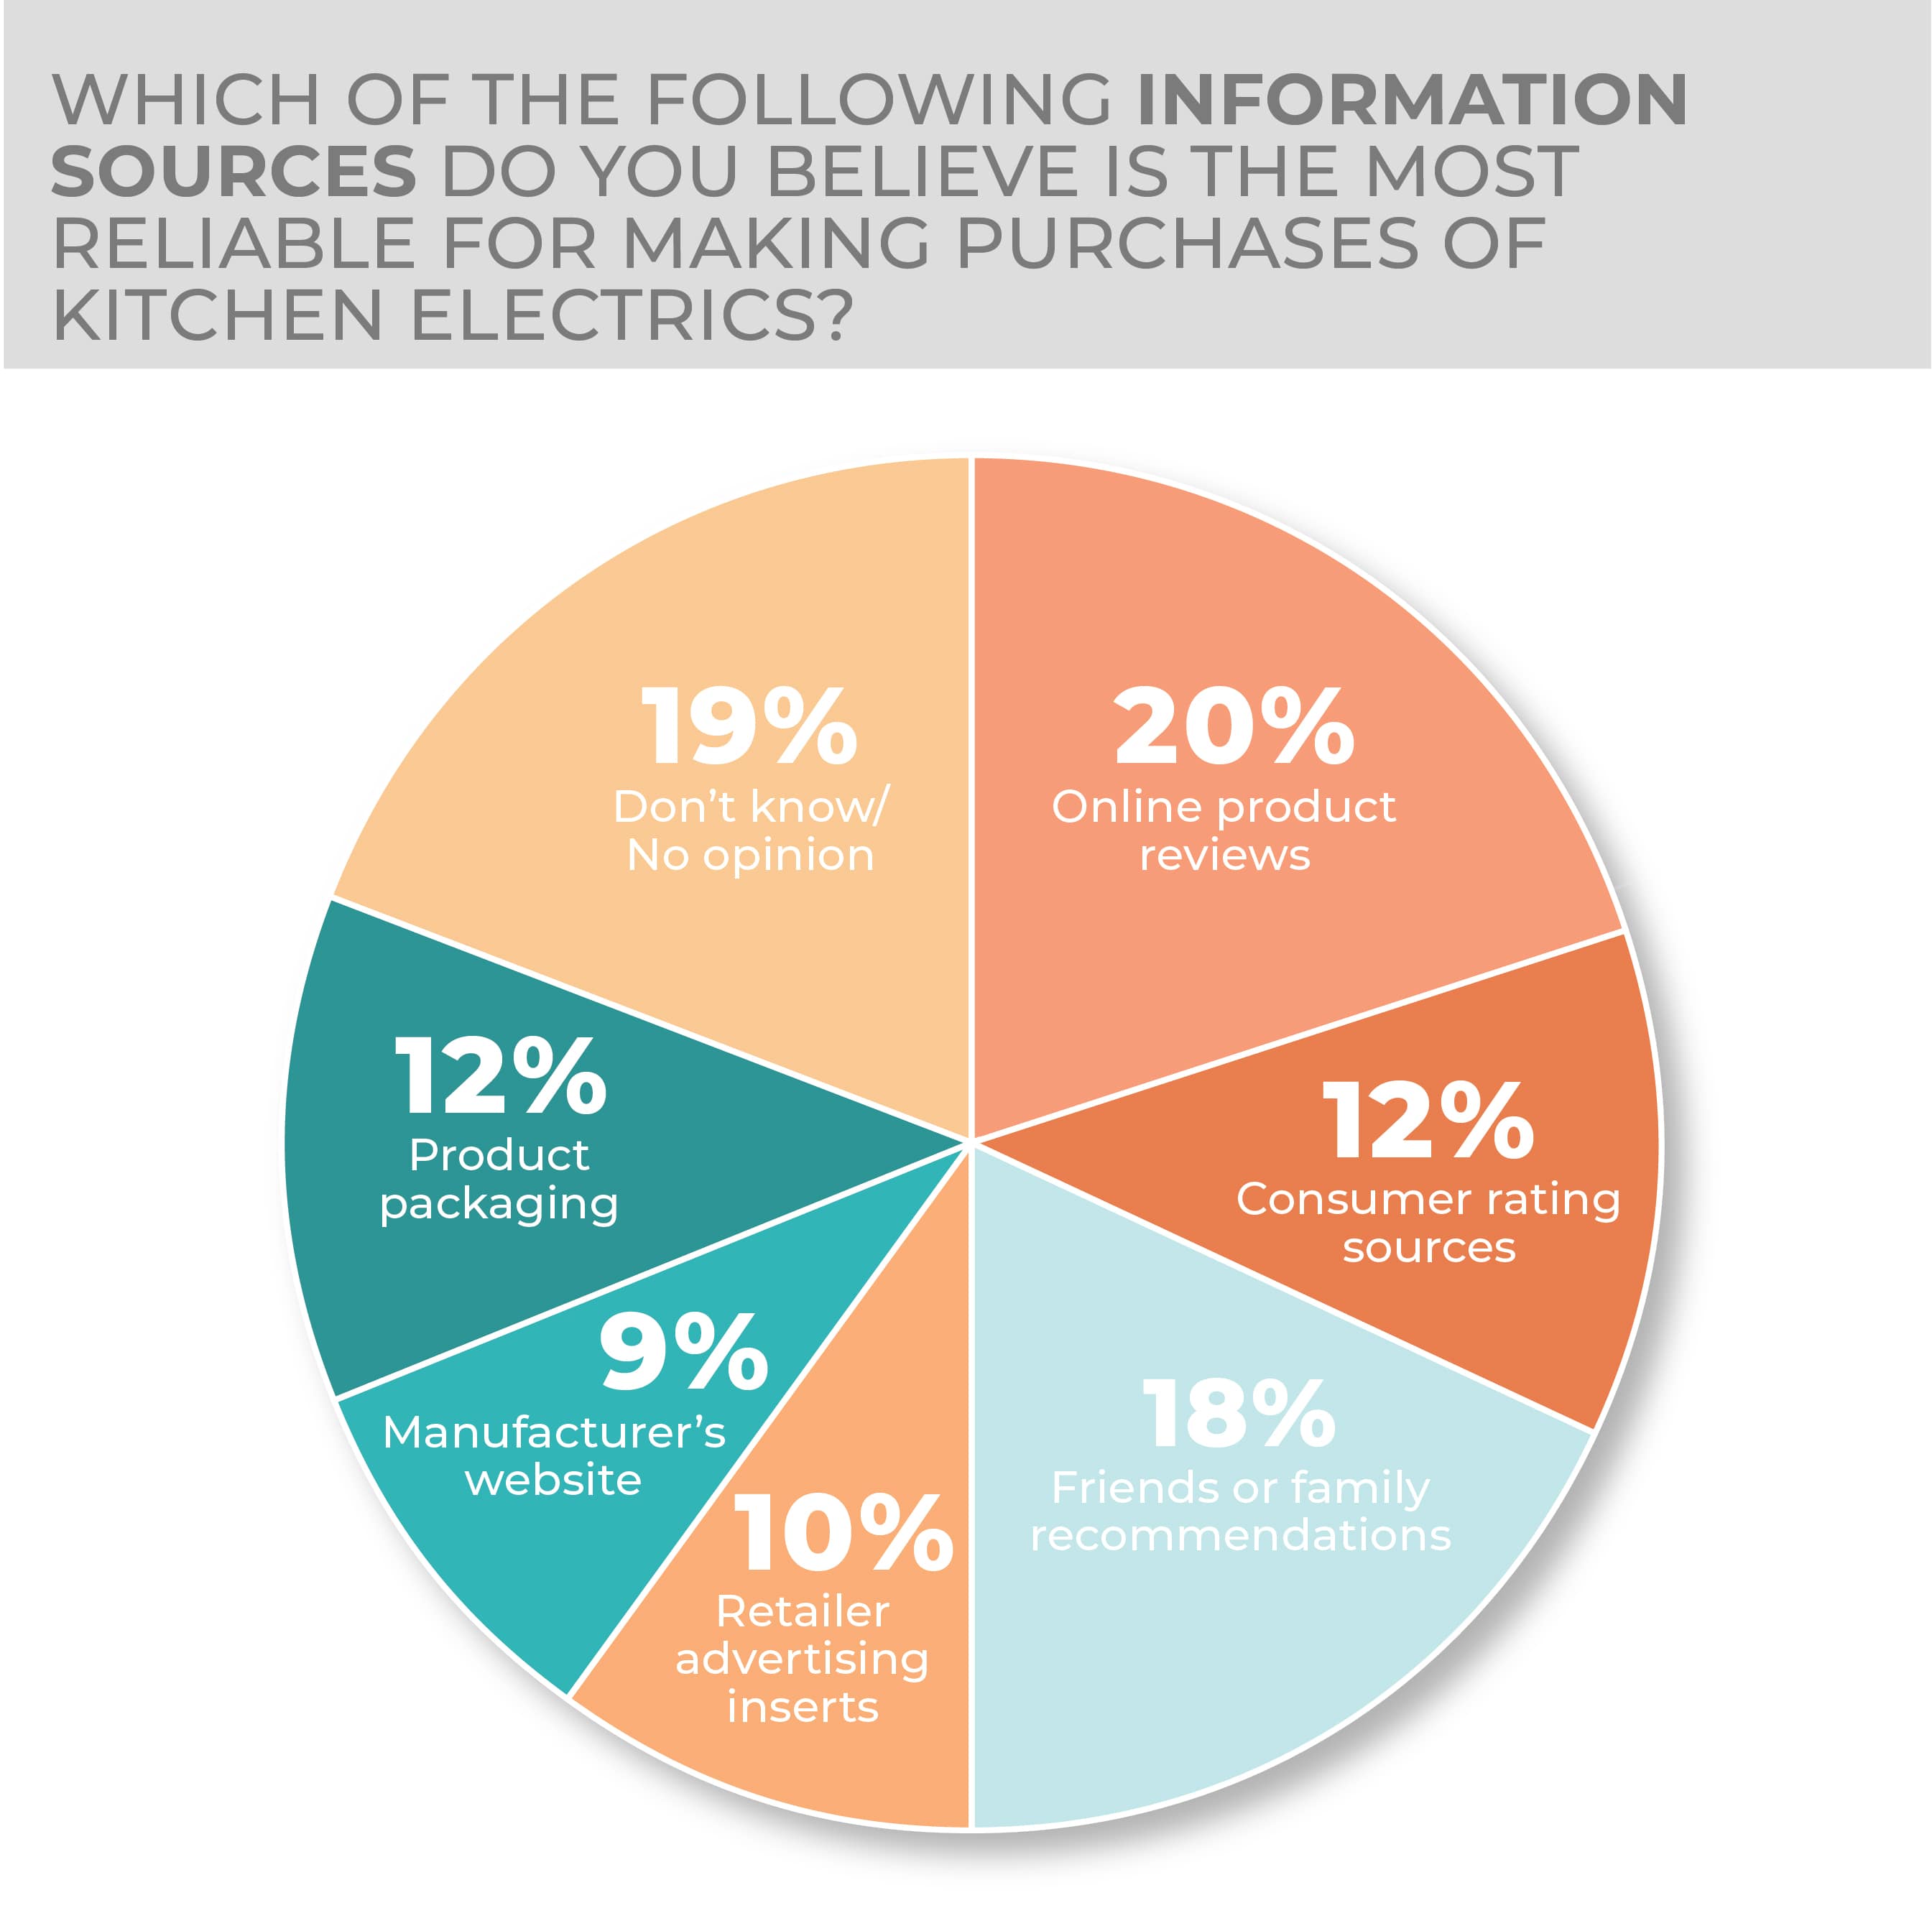
Although not overwhelmingly so, the 2022 survey demonstrated that consumers are somewhat more trusting of information from manufacturers when it comes to making buying decisions. When looking at reliable sources of information, manufacturers’ websites came in at 9% and product packaging at 12%. Still, although each was down a few points year over year, online product reviews, family and friends’ recommendations and consumer rating sources are again the top three most trusted sources for information used in making buying decisions. Where to research and purchase changed little in the survey year over year, with research online, buy in-store, and research and purchase online from a traditional or online-only merchant site leading.
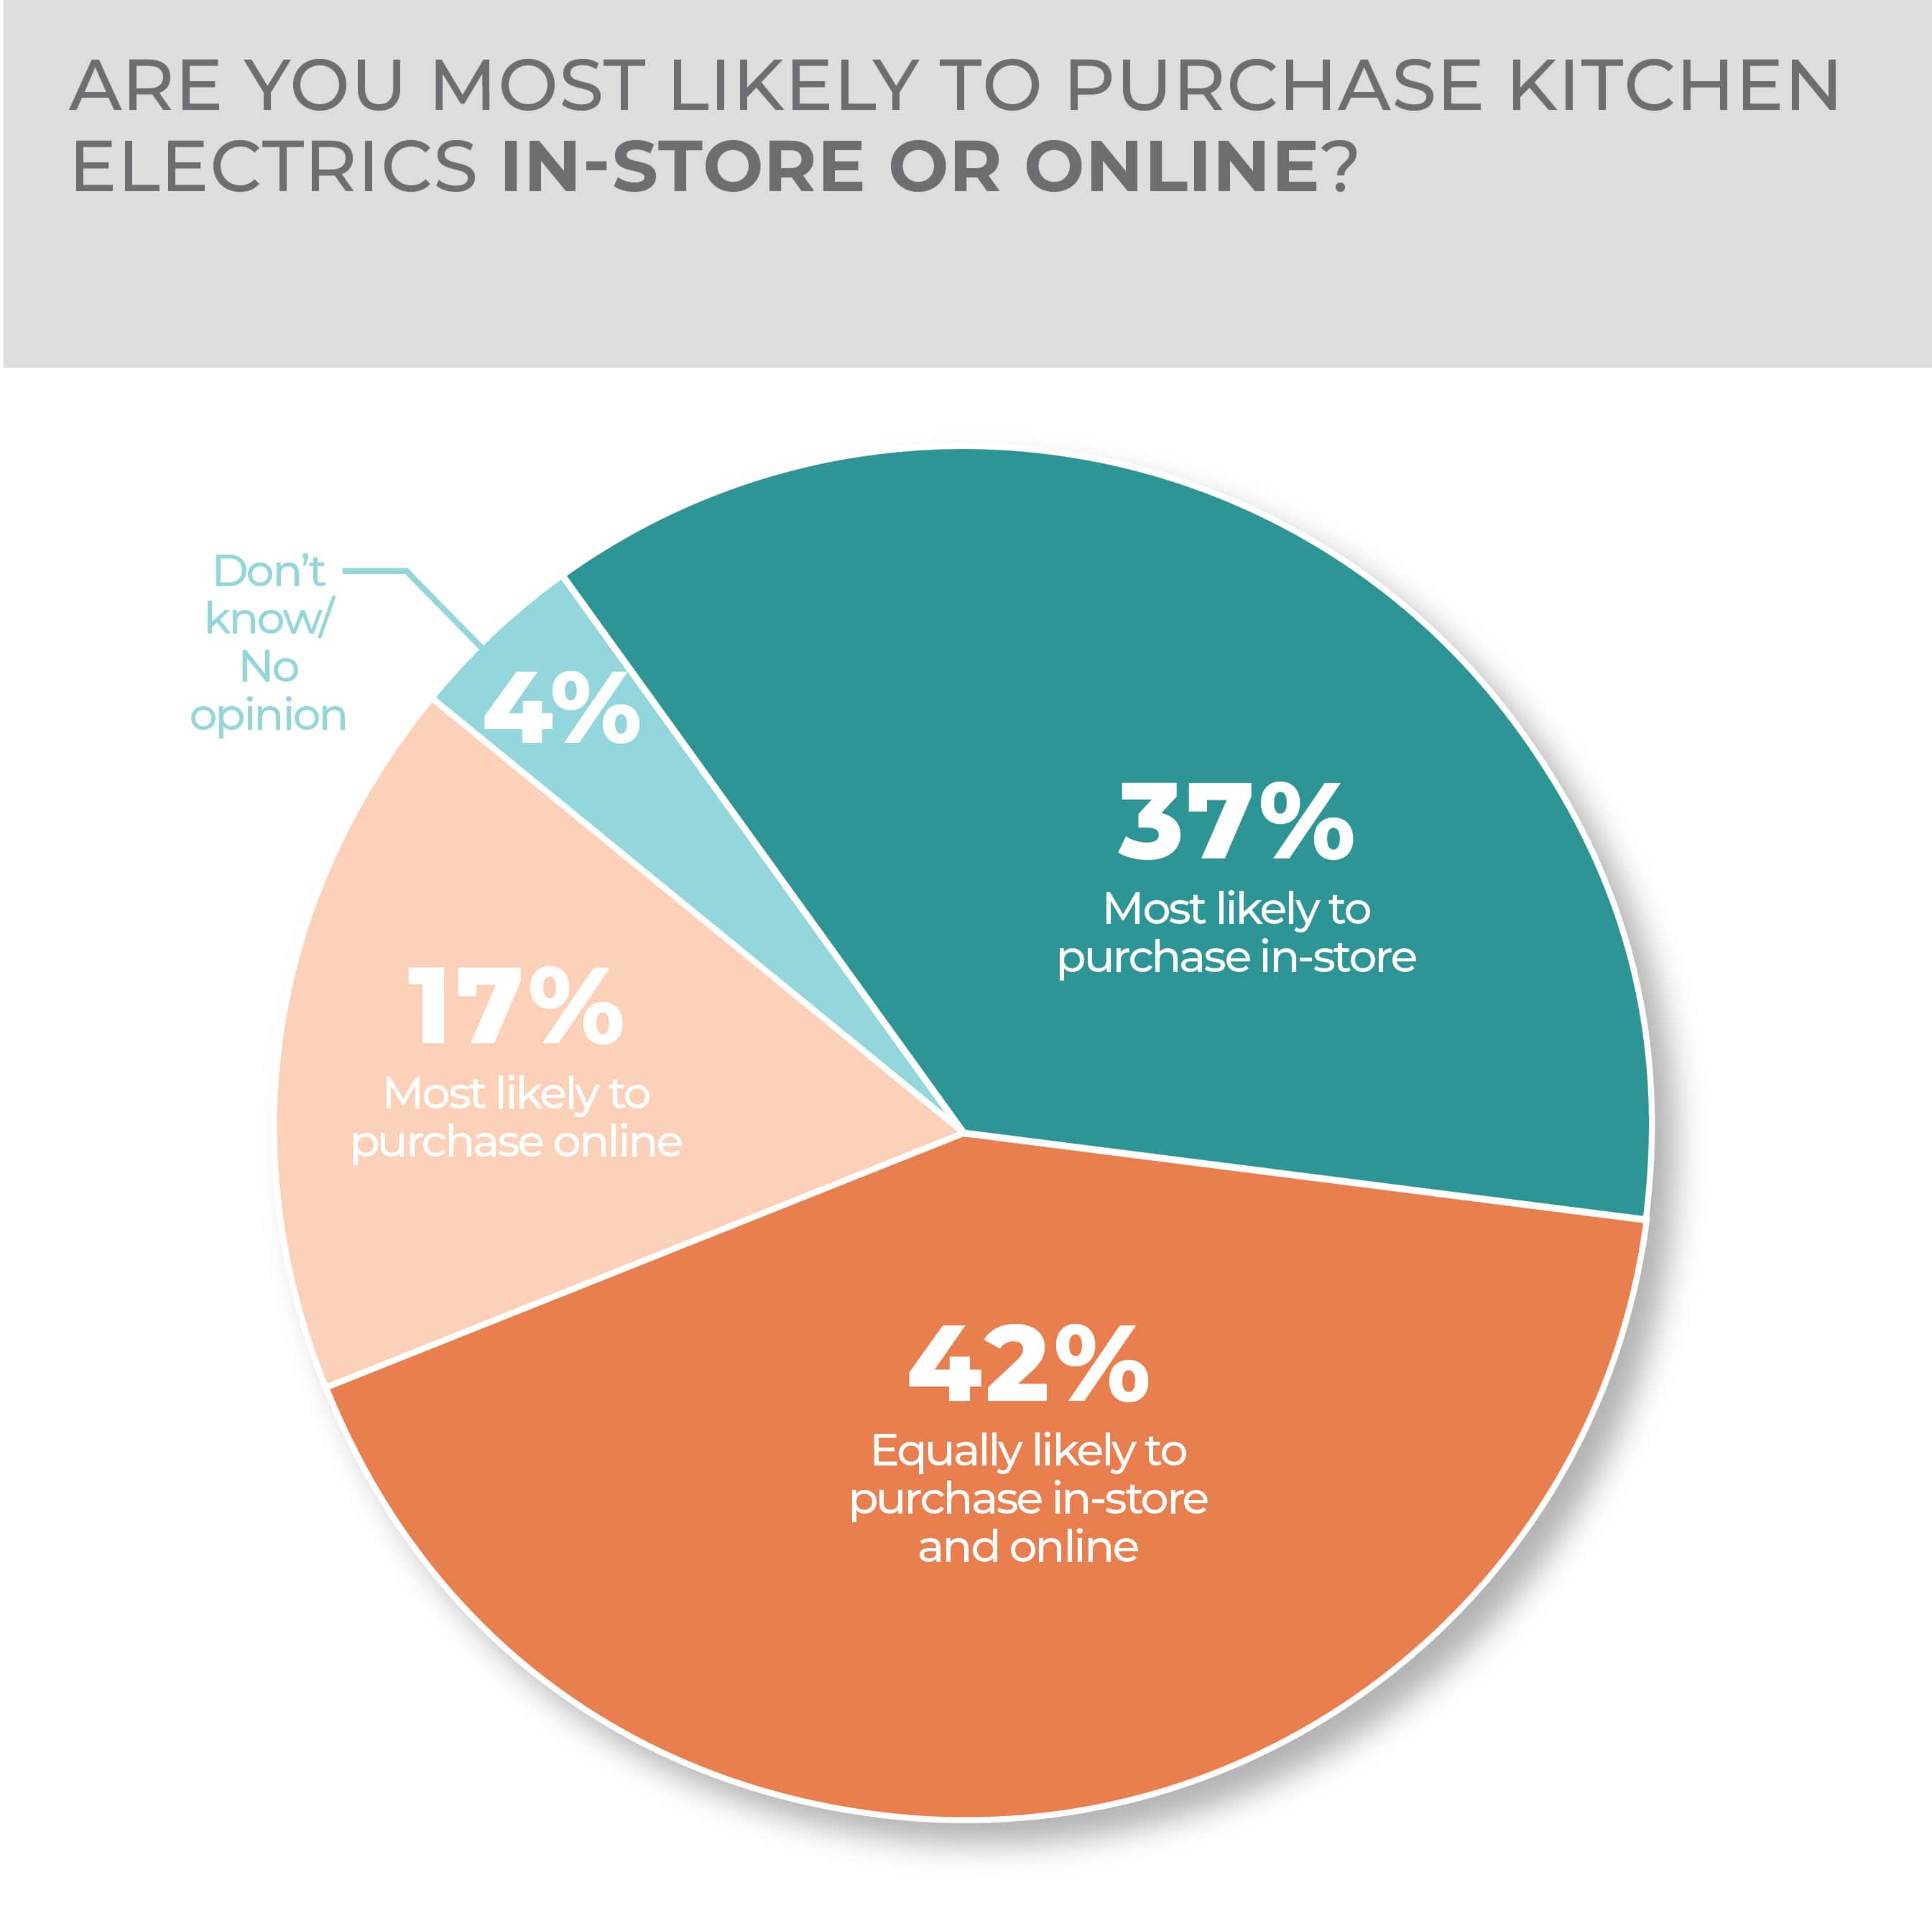
Kitchen electrics is among those housewares categories demonstrating that purchasing in-store still appeals to consumers, although a significant proportion of them are agnostic as to buying in the real or virtual world: 42% of survey respondents said they were equally likely to purchase in-store and online, and 37% saying they were most likely to buy in-store.
The overwhelming strength of the mass-market stores in the kitchen electrics category is evident in that 60% of consumers would most likely make such a purchase in person through the channel. Far behind at 8% are department stores and home specialty stores, while the only other store category above 5% is warehouse clubs at 7%. When shopping online among omnichannel operators, 59% of consumers would most likely purchase at a mass merchant followed by department store at 8%, warehouse club at 7% and home specialty store at 6%.
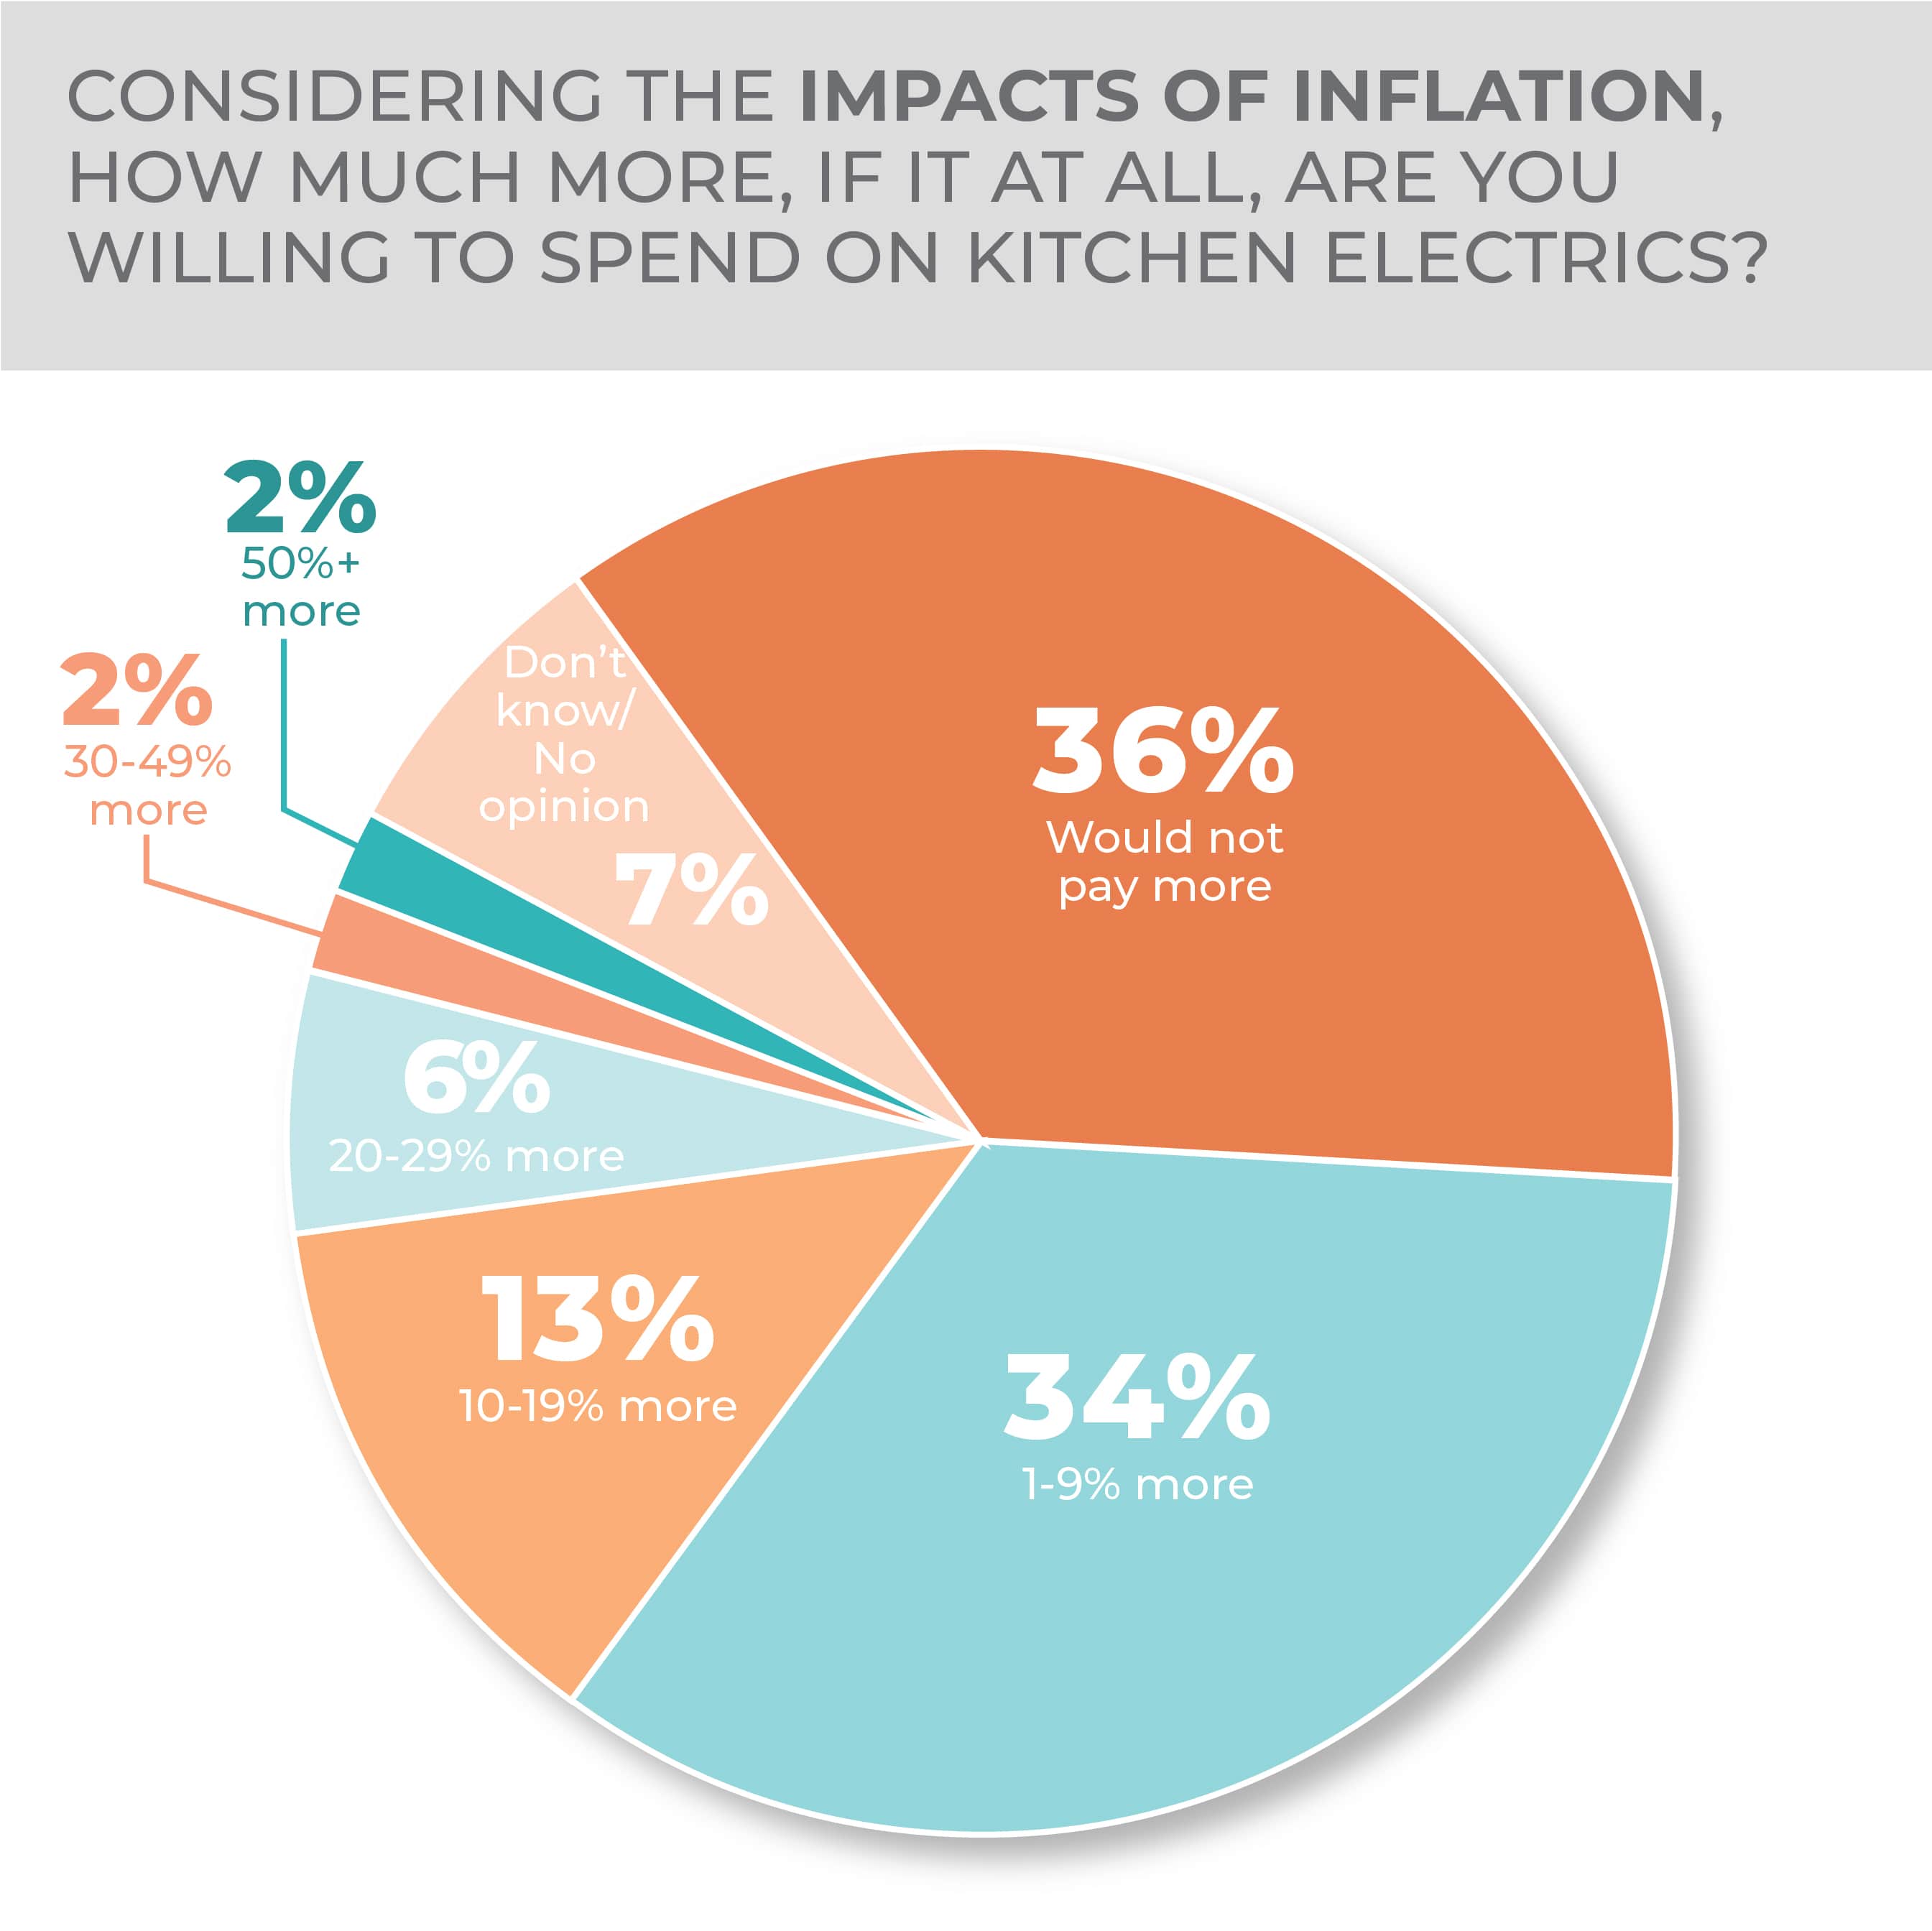
Consumers are price sensitive when purchasing in the kitchen electrics category, with 36% saying they would not pay more for a product despite inflation, 34% saying they would pay 1%-9% more and 13% saying they would pay 10%-19% more. No higher response made it into the double digits.
When considering what they might buy in the year ahead, air fryers came out on top at 35%, followed by toasters at 28%, toaster ovens at 21%, blenders at 21%, drip coffee makers at 19%, food processors at 18%, slow cookers at 17%, deep fryers at 16%, single-serve coffee makers at 15%, juicers at 14%, stand mixers at 12%, bread makers at 11%, multicookers at 11%, espresso makers at 10%, indoor grills at 10%, roaster ovens at 10% and electric kettles at 9%.
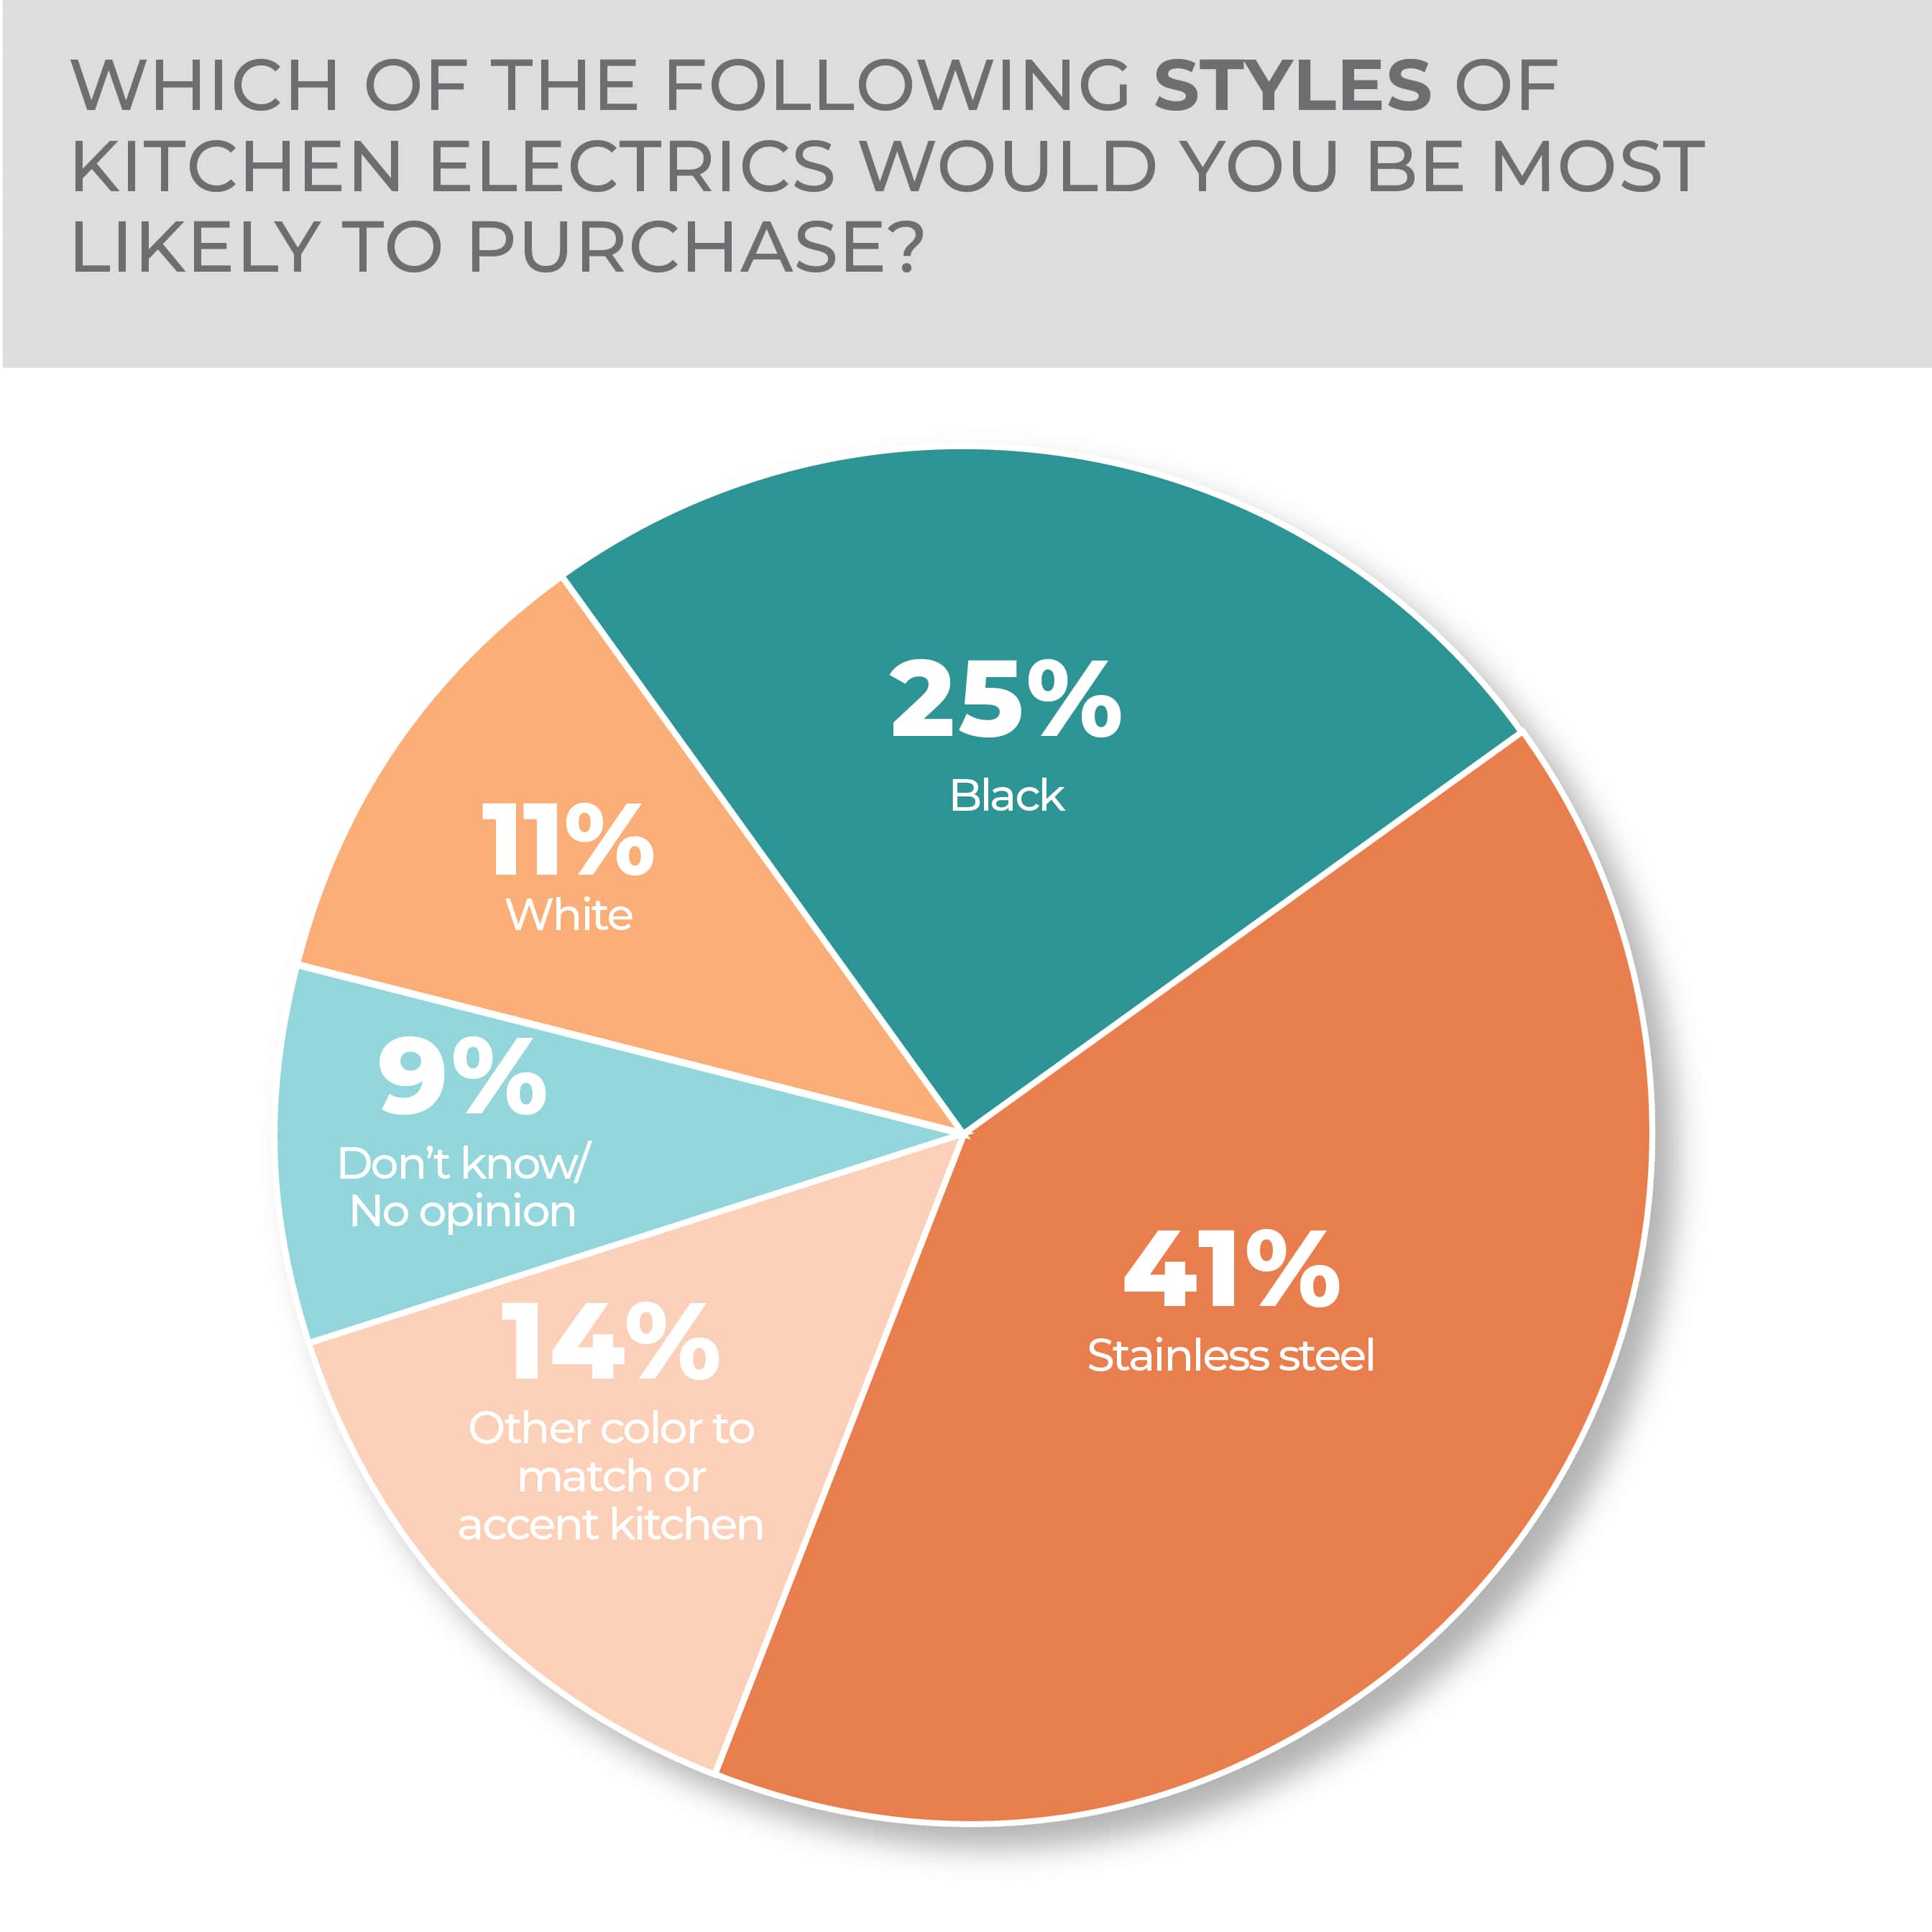
Stainless steel rules as a color choice at 41% for purchase intention followed by black at 25%. Color to match or accent a kitchen came in at 14% beating out white at 11%.
Consumers in the survey said they would very willing to spend $10 more for products made in America, at 37%; nonstick surfaces on parts requiring cleaning at 32%; longer warranties, a preferred brand or lower energy consumption at 30%; stainless steel finish, professional/commercial performance or more power to perform functions at 28%; kitchen electrics that come in a preferred color at 26%; products that offer a retractable cord at 25%; ones that provide contemporary styling at 20%; and kitchen electrics that carry a celebrity chef brand or endorsed by one at 15%.
As for demographics, men and women were pretty much equal in their purchase intentions. Consumers aged 35-44 were most intent on a kitchen electrics purchase overall, at 22% very and 38% somewhat likely. Although the group that follows, 18-34-year-olds, had the highest very likely score at 26%, they trailed in the somewhat likely designation at 30%.
By region, Southerners, at 20% very likely and 31% somewhat likely, were most intent on purchasing kitchen electrics.
More Kitchen Electrics Findings:
Kitchen Textiles
Kitchen textiles are a great way to cost-effectively freshen up the most popular room in the house, so it’s not surprising that many consumers are interested in purchasing them.
They can set a style, be swapped out seasonally or dress up the home from holiday to holiday.
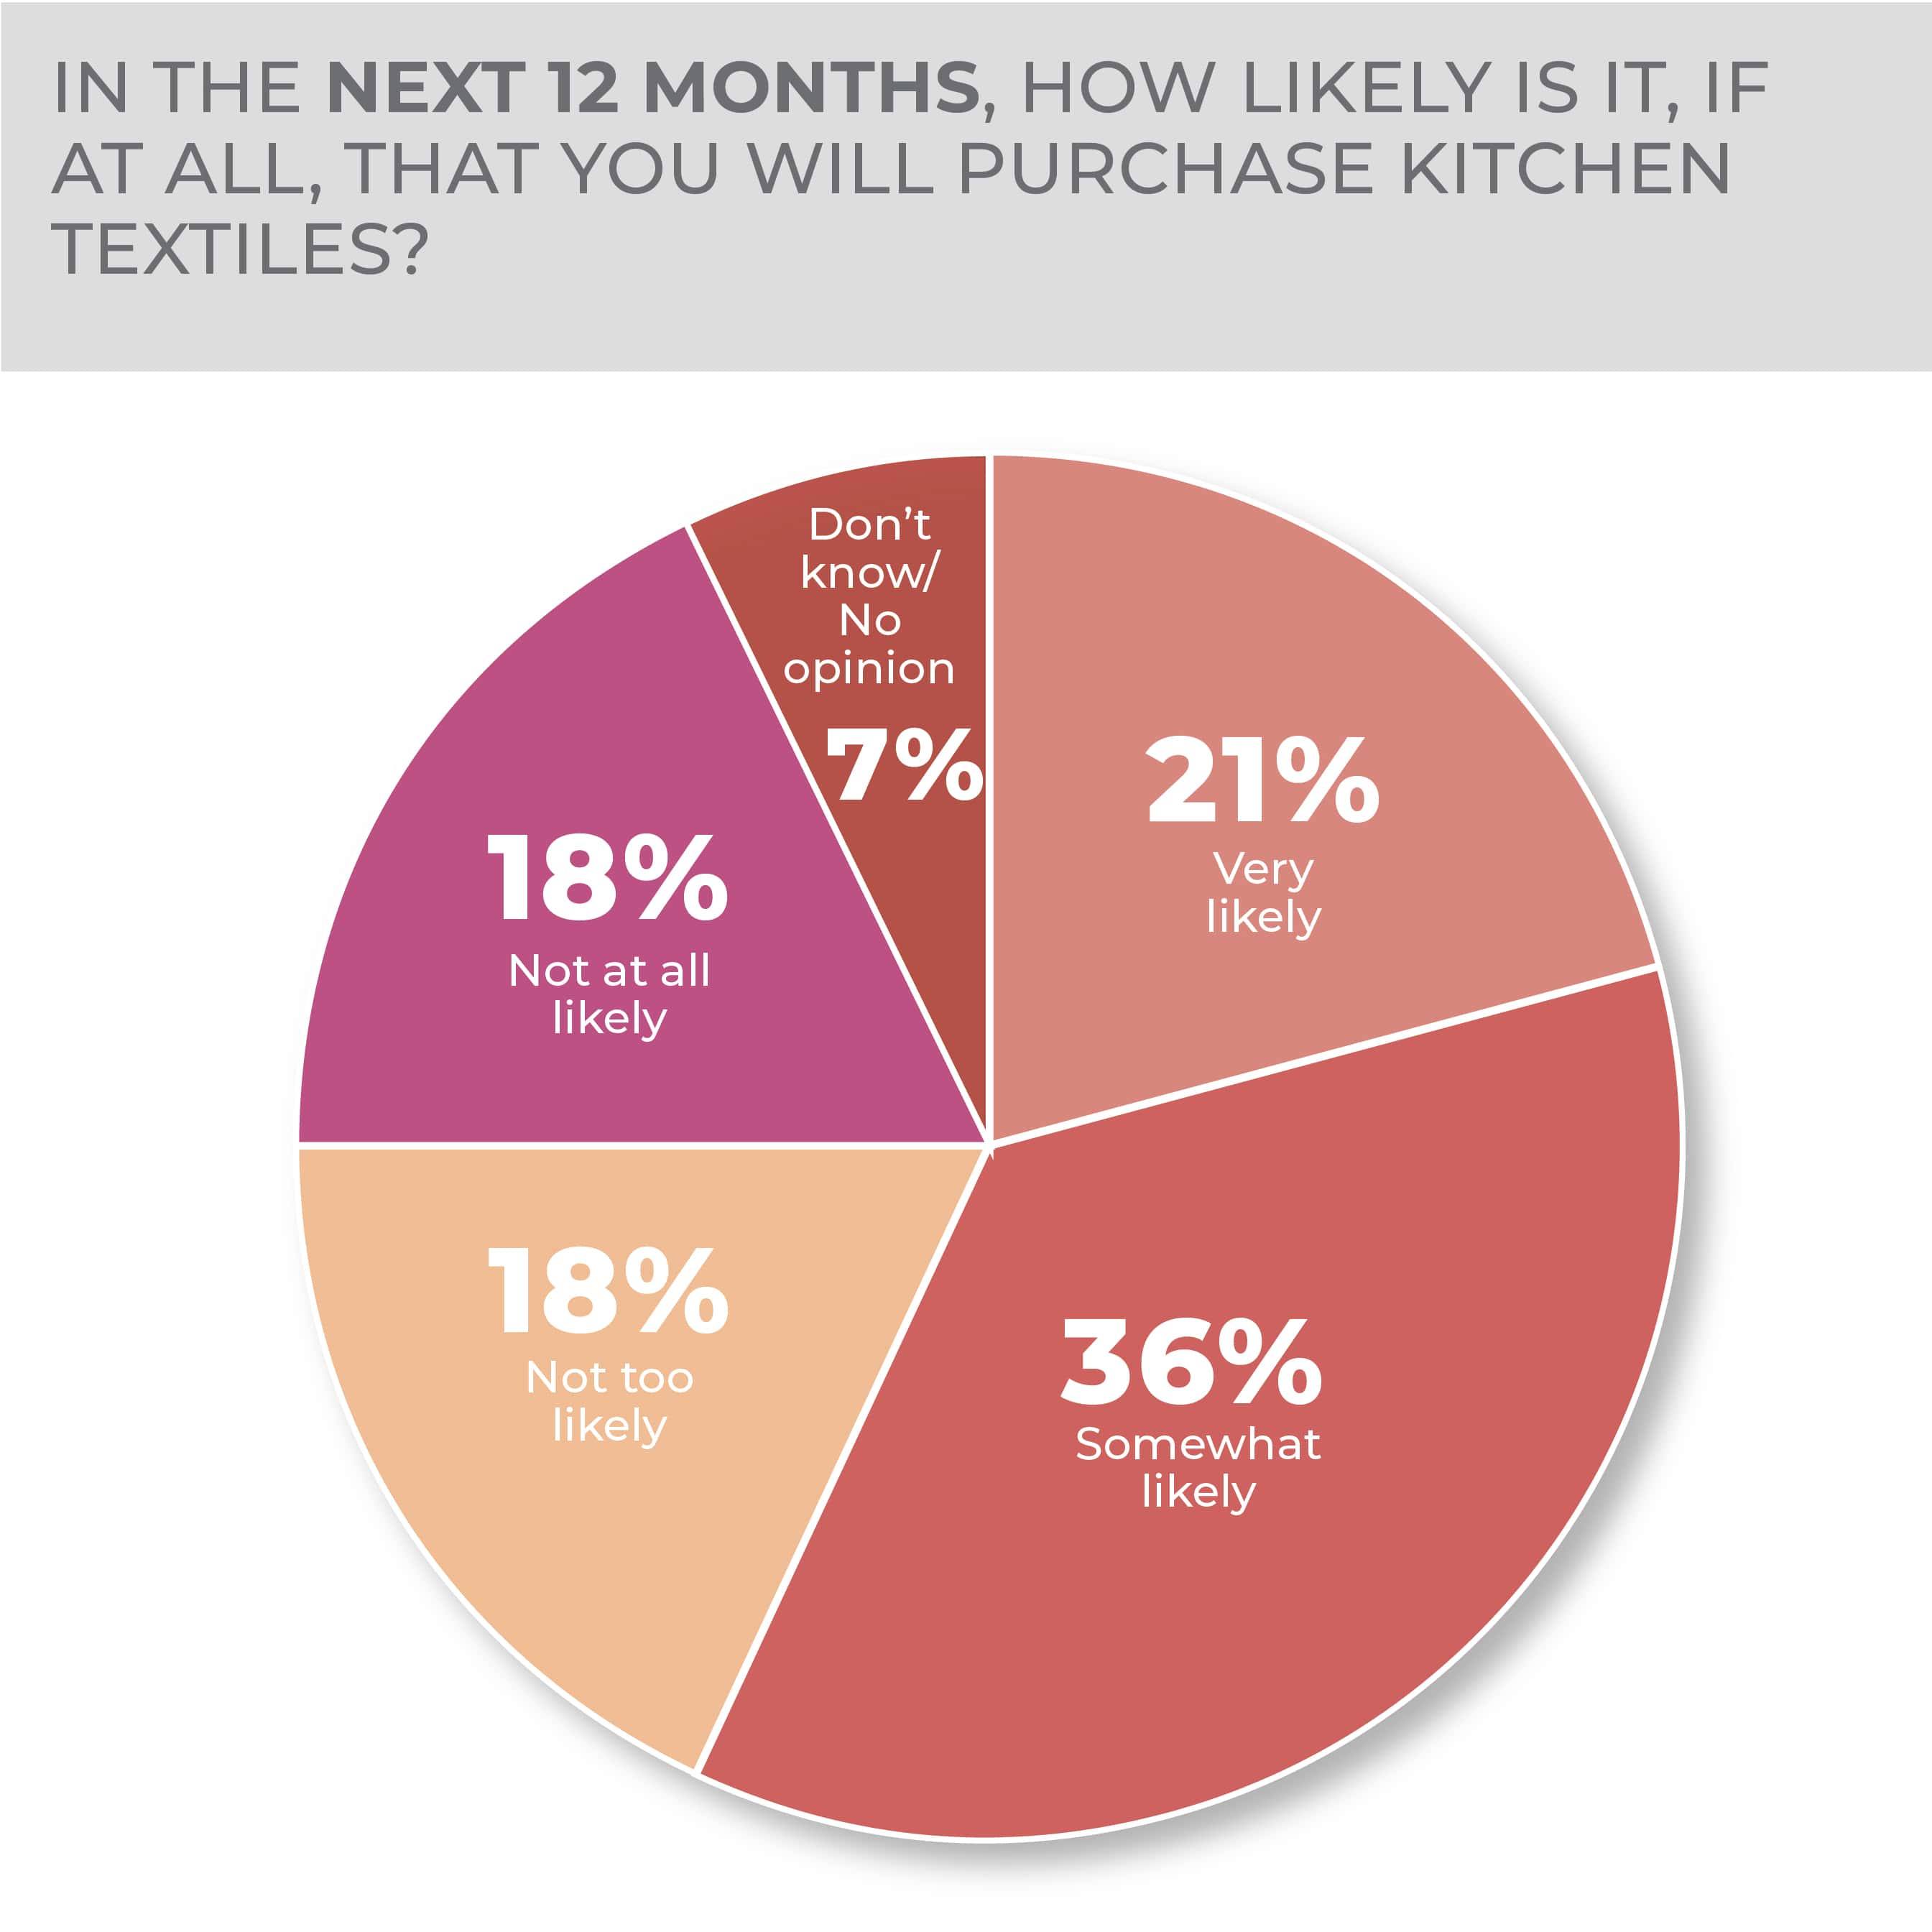
As such, 21% of respondents to the HomePage News 2023 Consumer Outlook Survey said they would be very likely to purchase kitchen textiles at some point in 2023 while 36% said they were somewhat likely to do so. The numbers should be considered in the context that kitchen textiles are often an impulse purchase and replacing them is always one ugly spill, splash or stain away.
Given the need for them, it’s not too surprising that kitchen textiles purchasing potential hasn’t changed a lot over the past year as respondents were 25% very and 35% somewhat likely to purchase in last year’s survey.
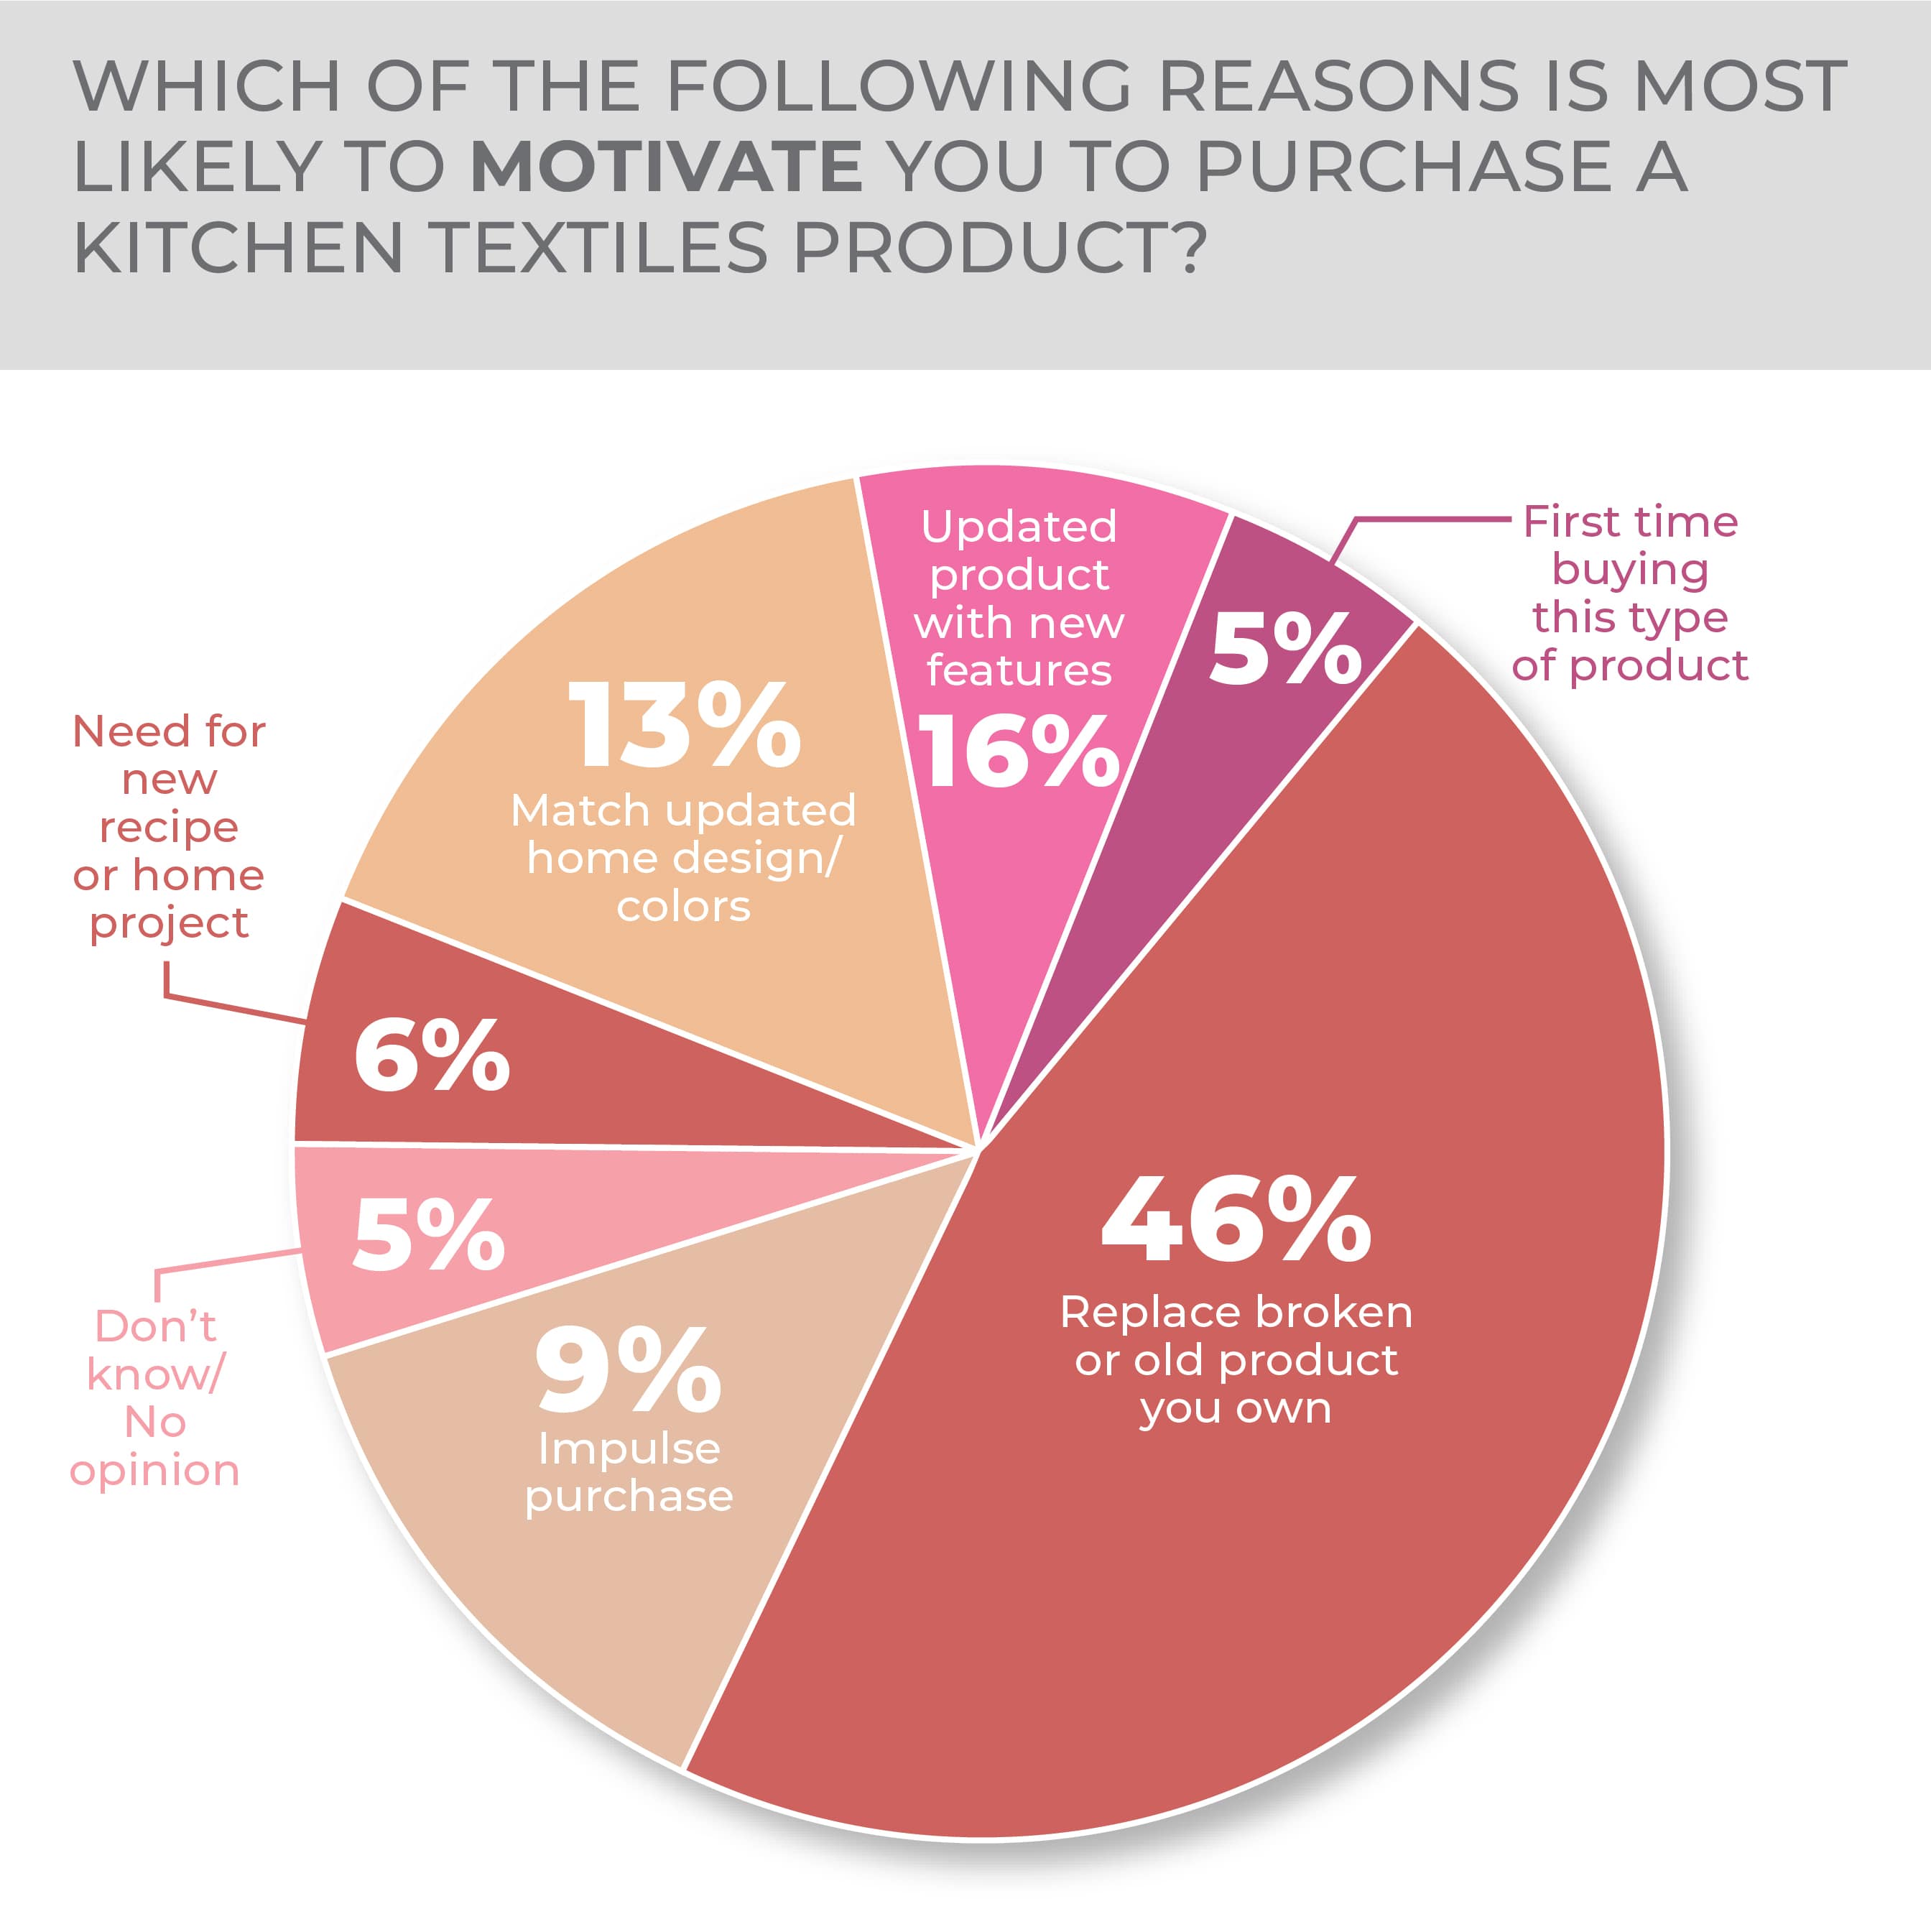
Also not surprising, replacement, at 46%, is overwhelmingly the main reason to purchase, up four points from last year’s survey. An updated product with new features comes in at 16% and matching updated home design/colors comes in at 13% to round out second and third. This year’s numbers flip last year’s results when updated products with new features rated 15% and matching updated home design/colors came in at 18%.
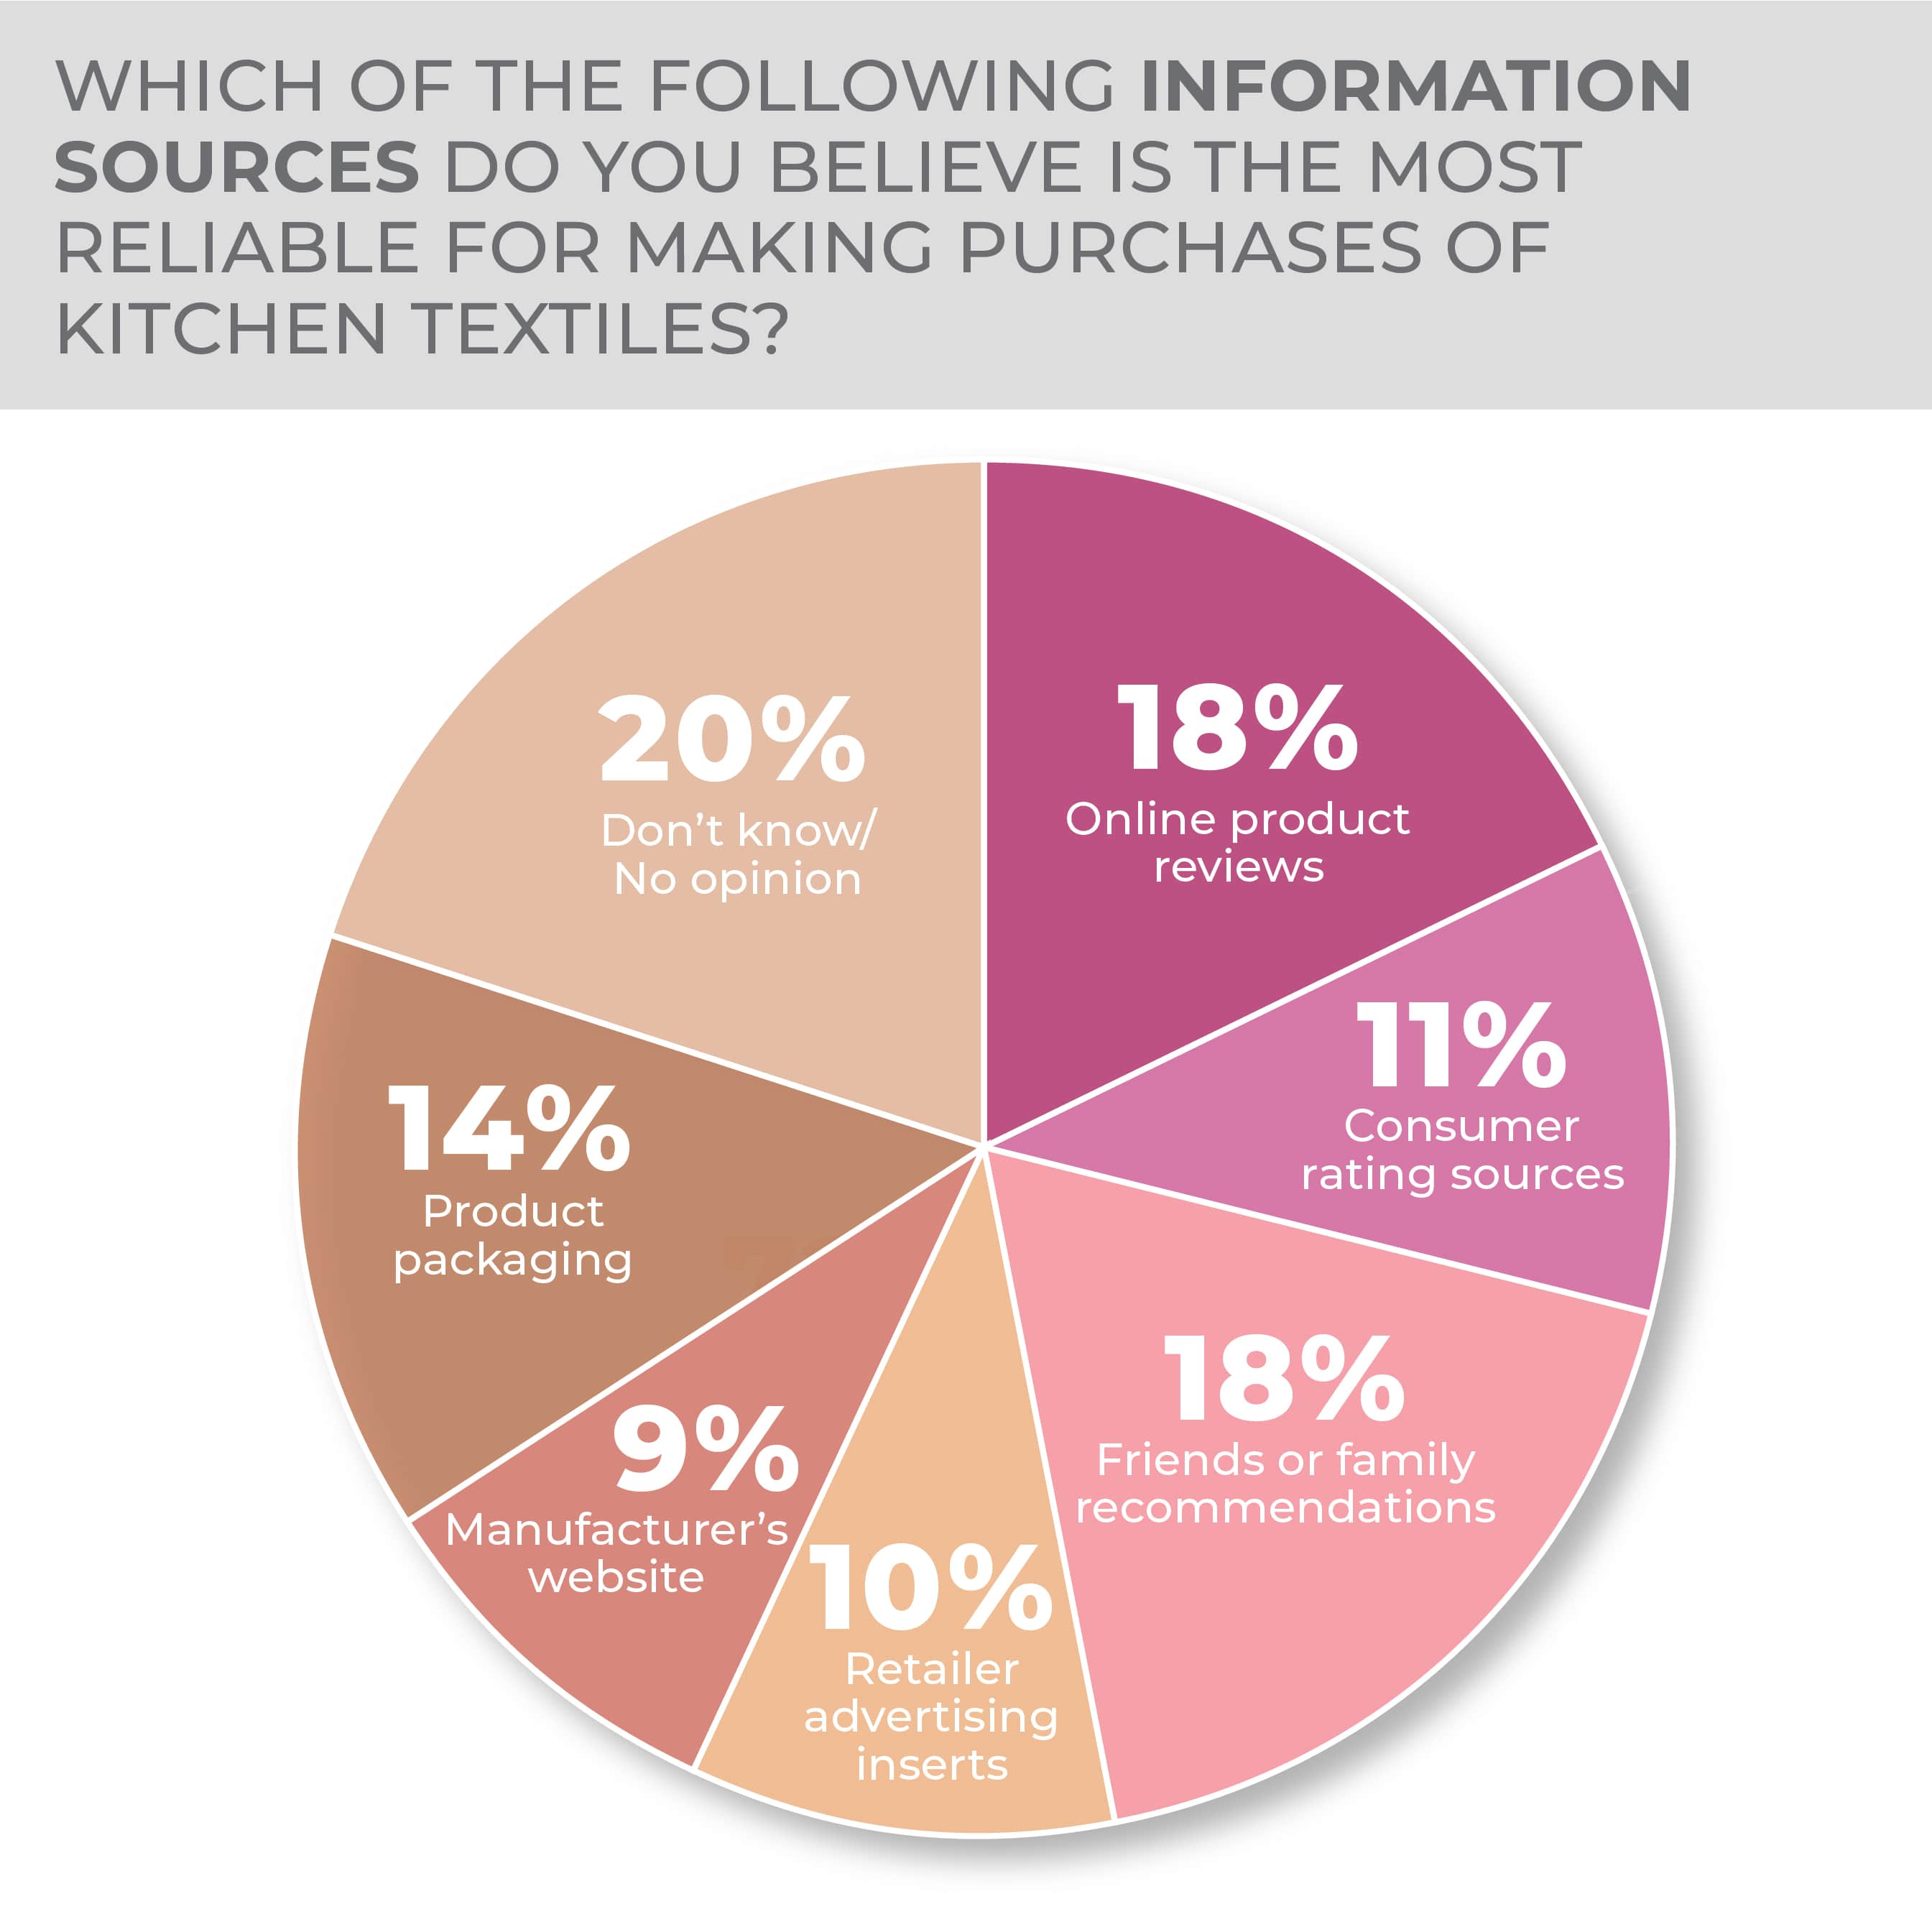
No definitive source of information for making purchasing decisions emerges when it comes to kitchen textiles. In fact, in this year’s survey, don’t know/no opinion leads at 20%. Otherwise, the top three sources were online product reviews at 18%, family and friend recommendations at 18% and product packaging at 14%. A year ago, people had the most faith in family and friends recommendations at 22% and online product reviews at 21%, with consumer ratings sources and retailer advertising inserts tied at 12%. Don’t know/no opinion was a lesser but still significant 17%. The numbers suggest that an opportunity exists for more robust product communication.
-
- More than half of consumers already have at least some interest in purchasing kitchen textiles in a category where impulse purchases are common.
- More than half of men have an interest in a kitchen textiles purchase and are only slightly less interested than women.
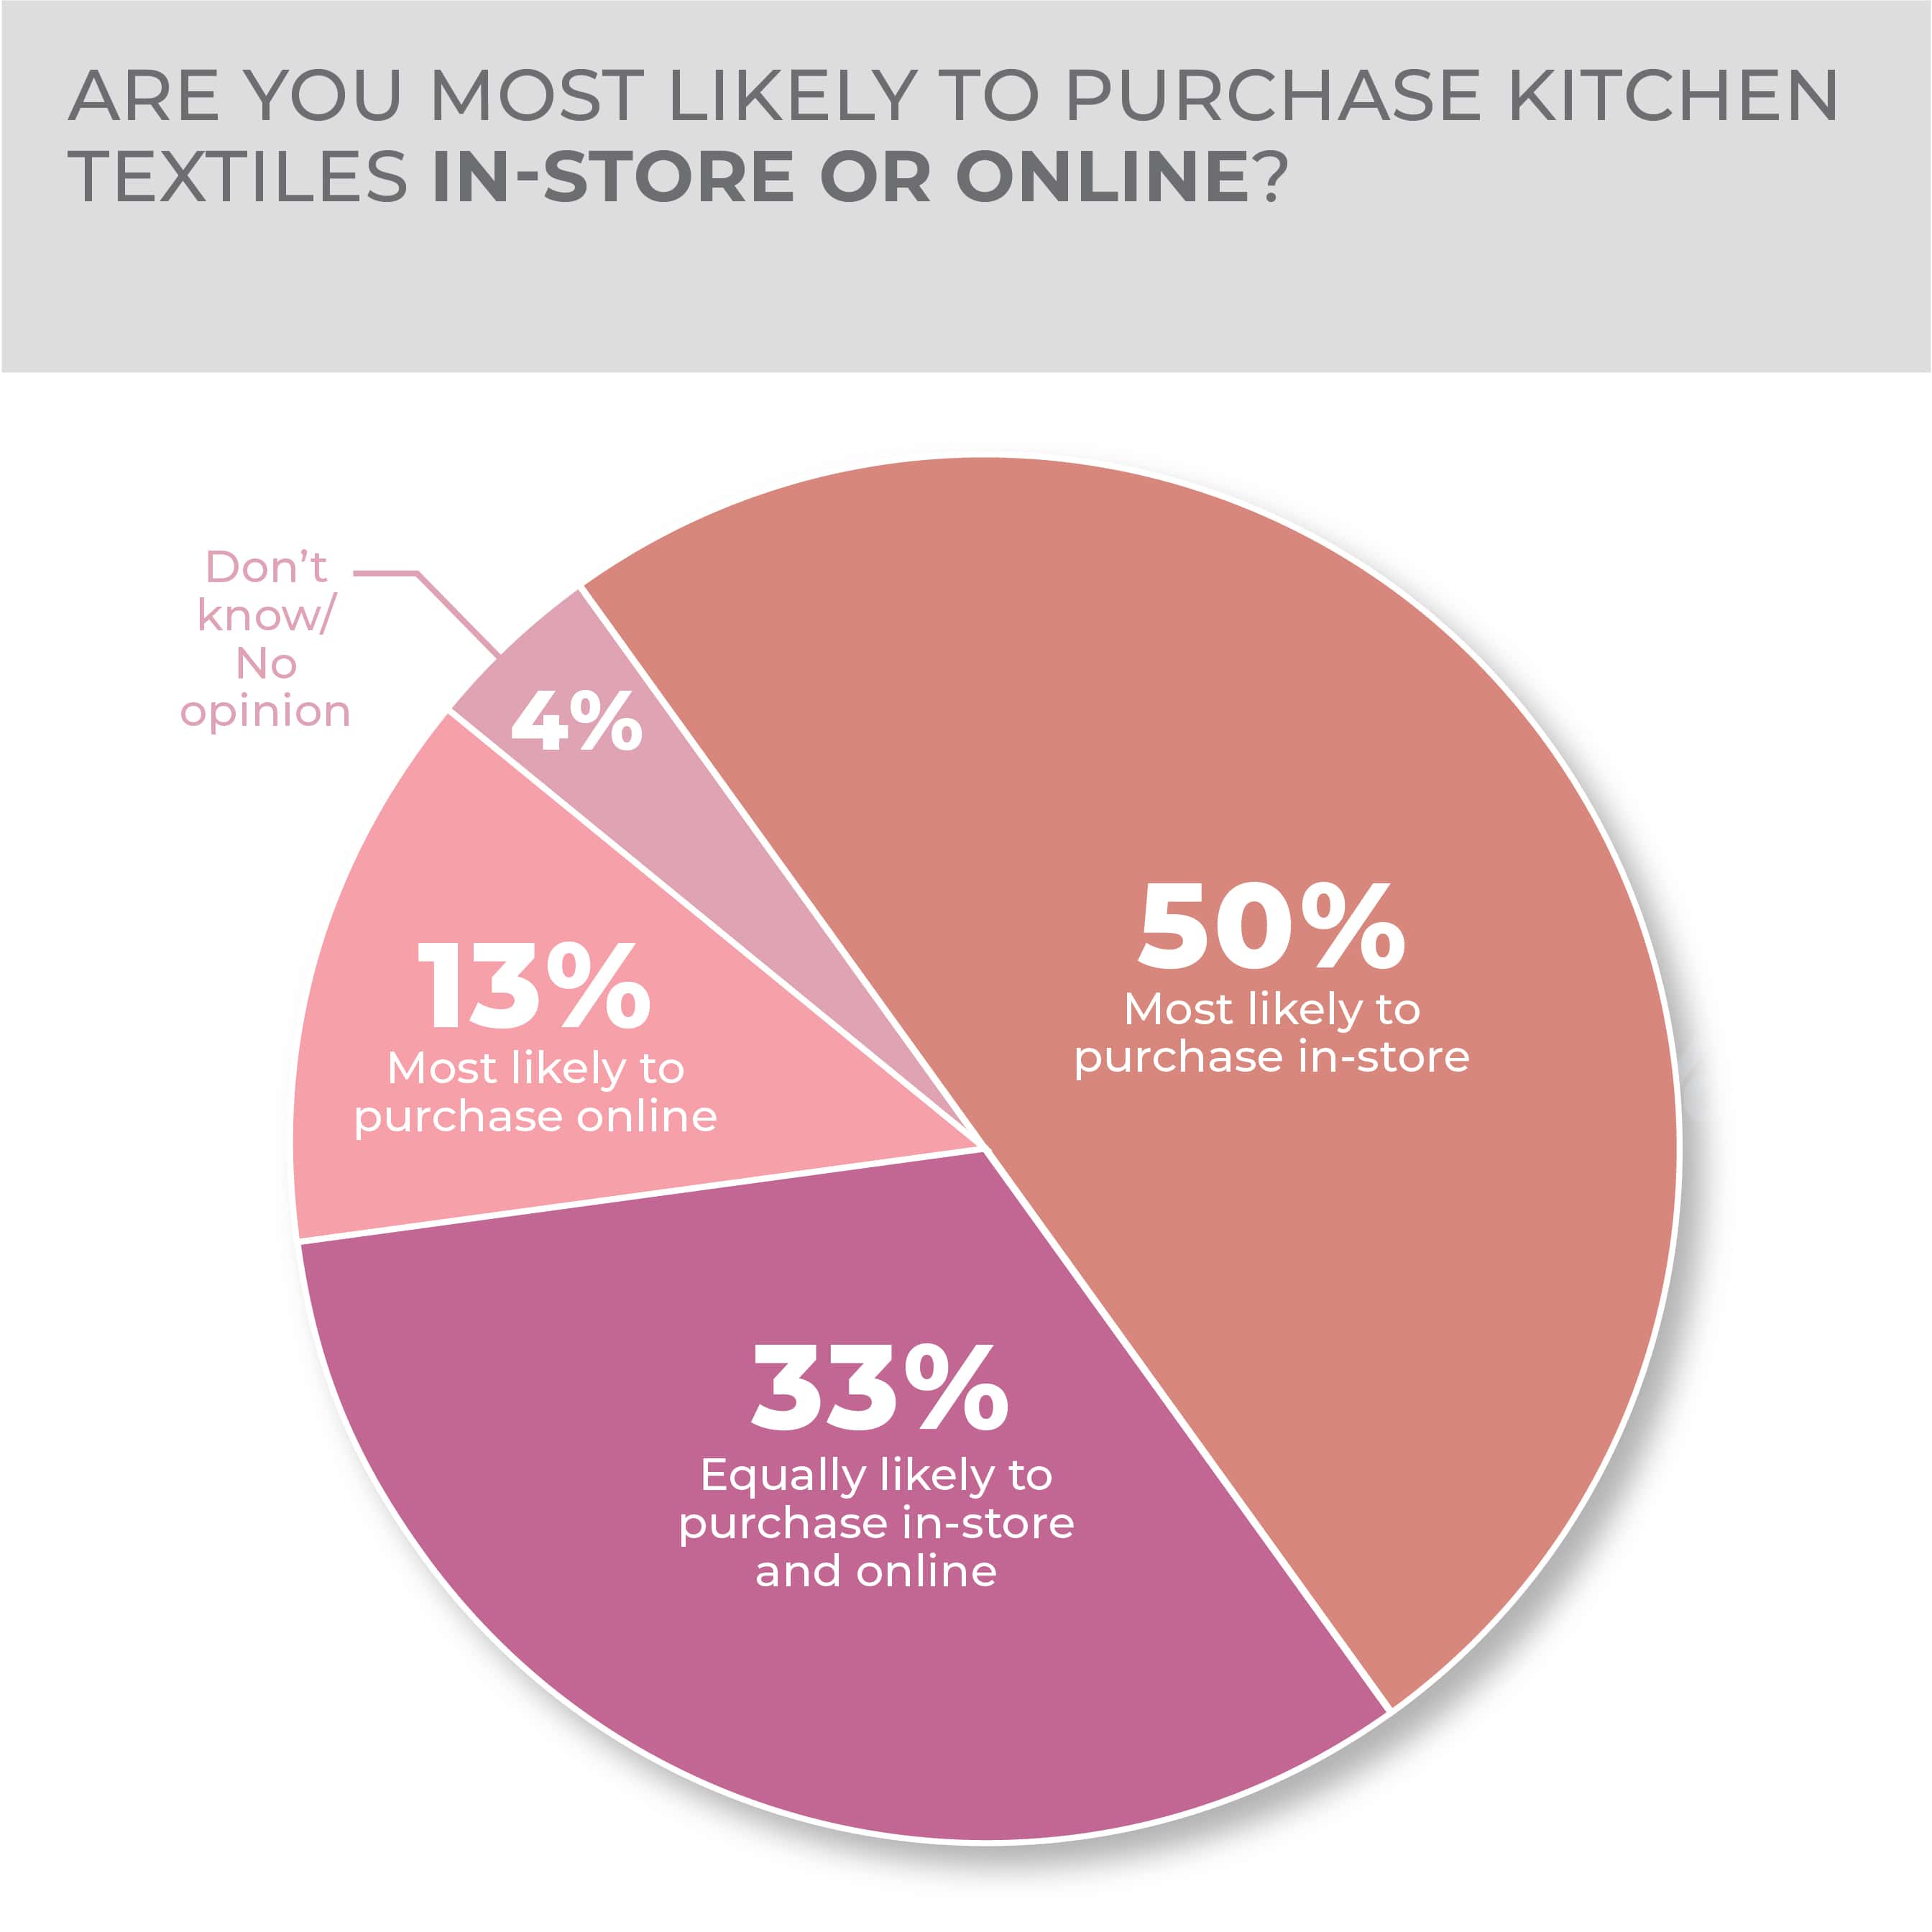
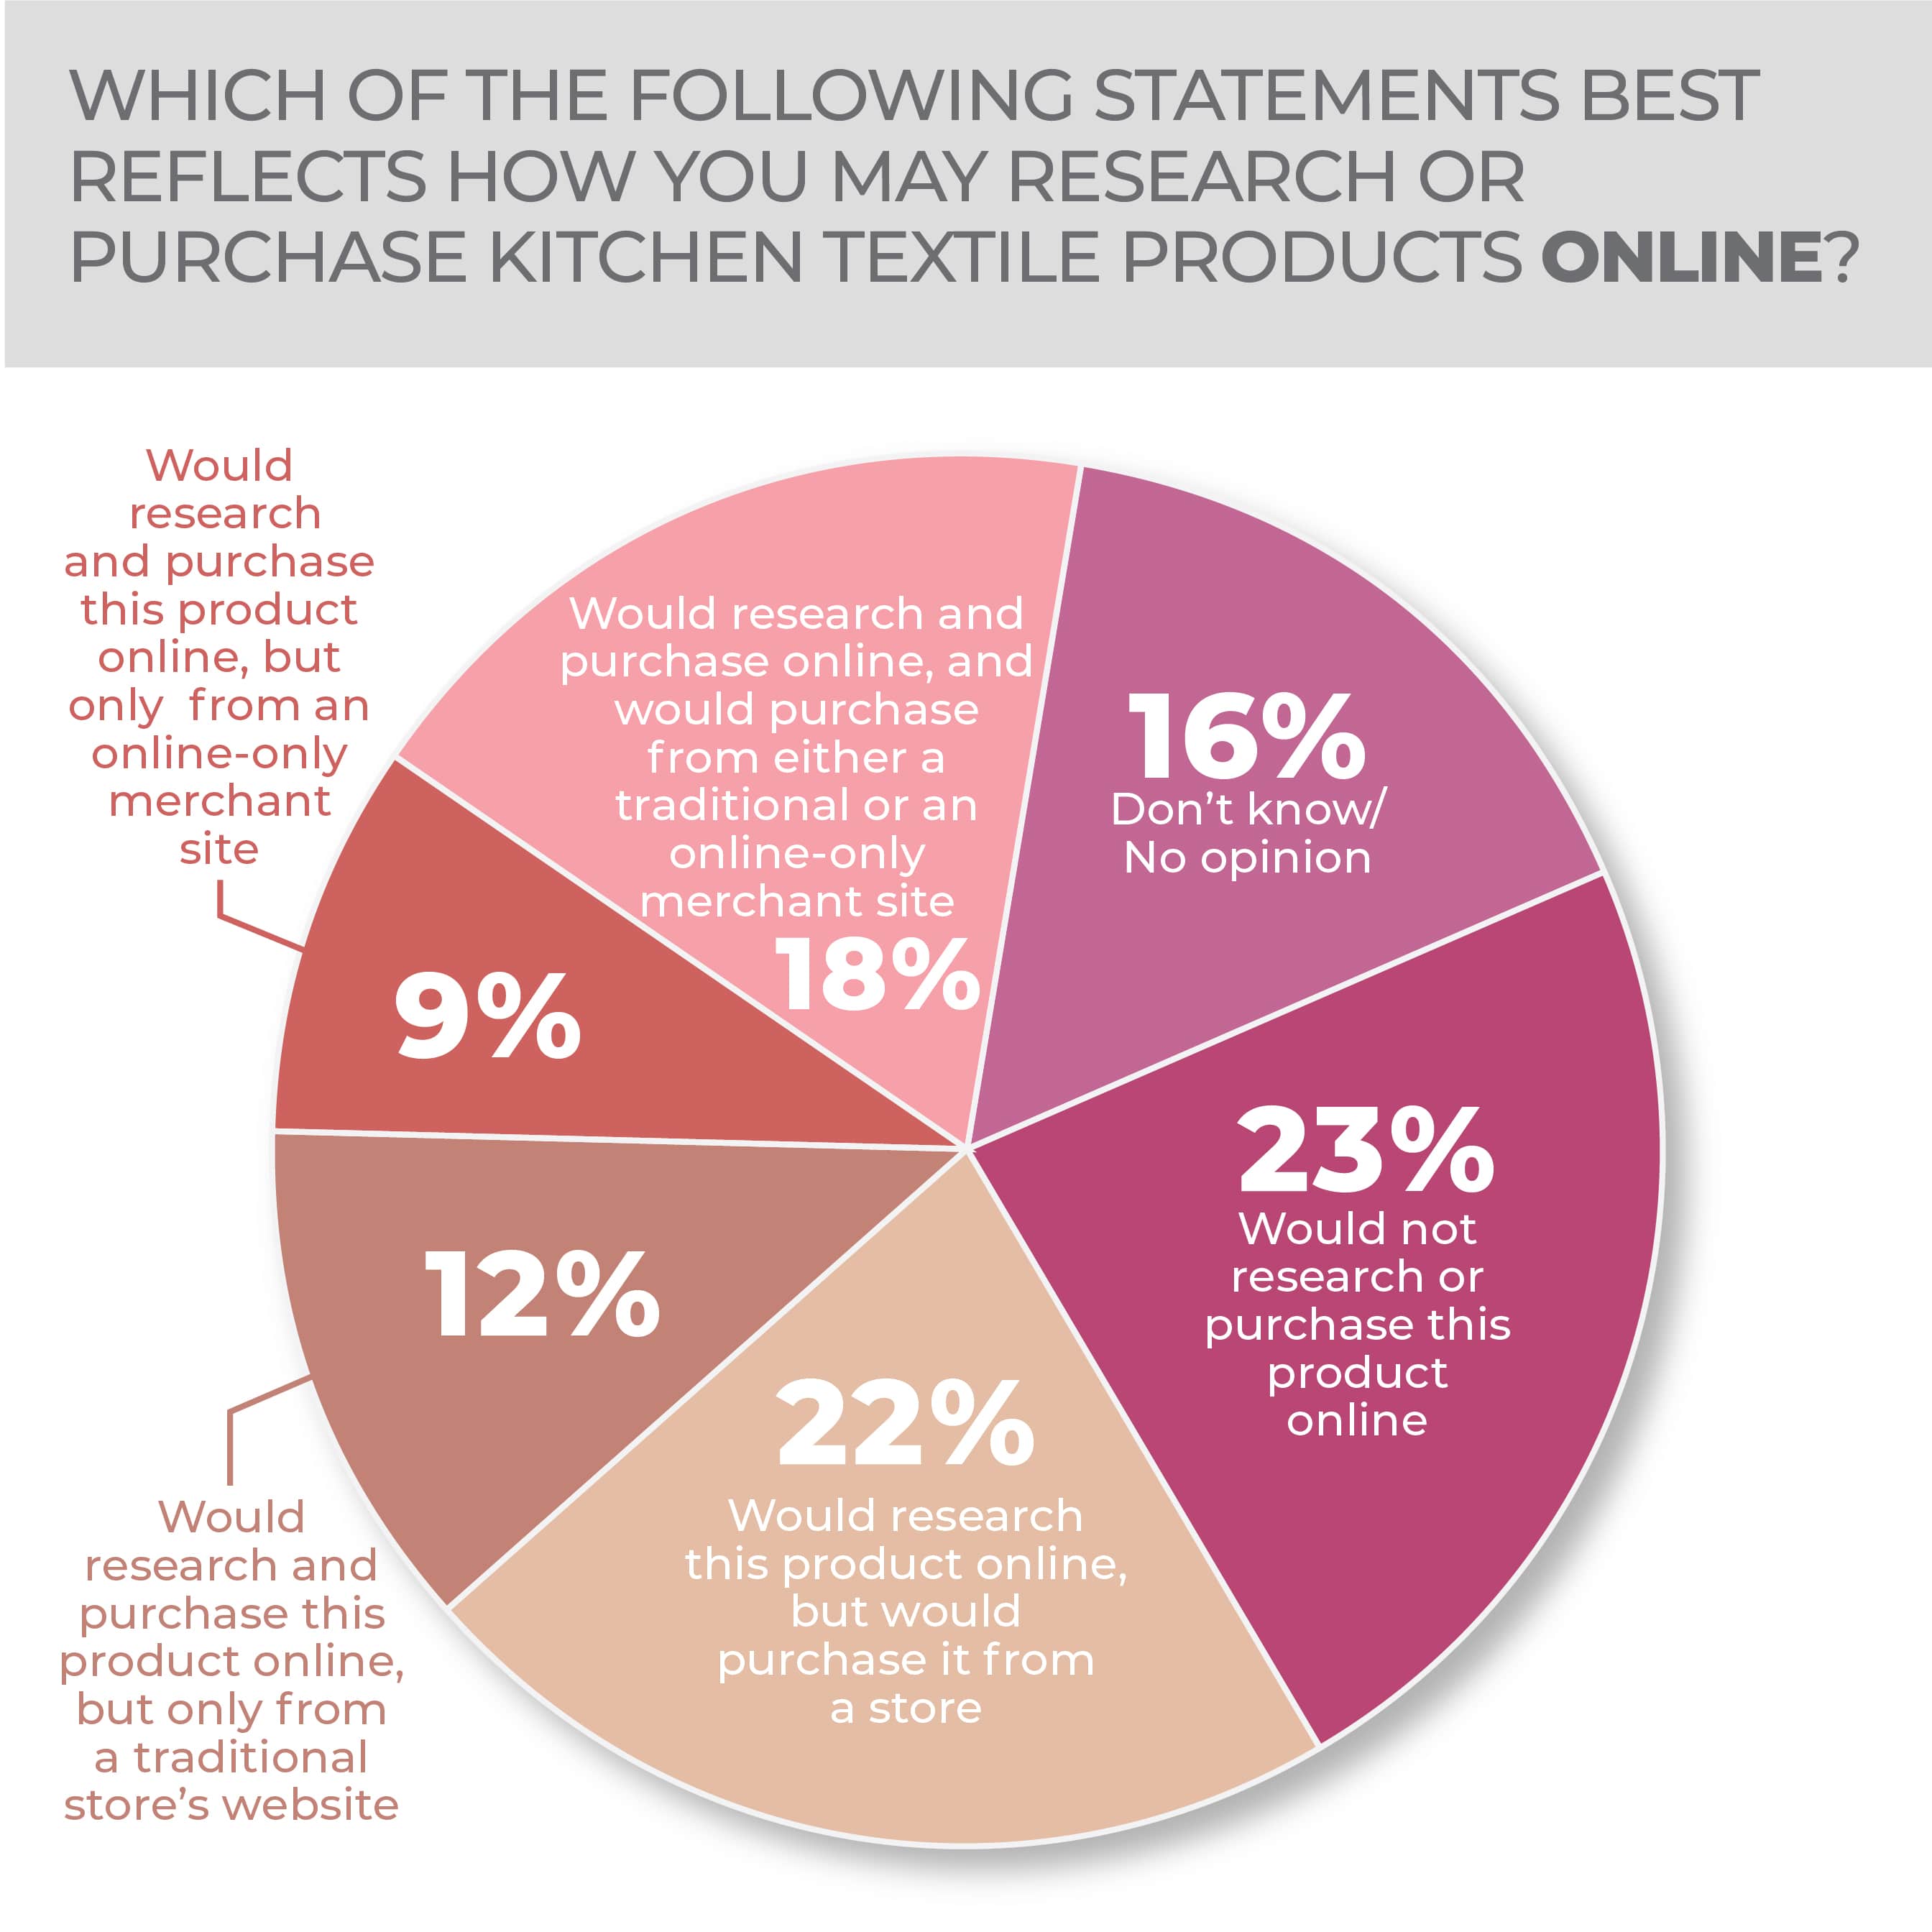
Perhaps due to the impulse nature of the product category and its wide range of availability, 23% of consumers in the latest survey and 25% of consumers in the one last year said they would not research or purchase kitchen textiles online. Would research online but purchase from a store followed at 22% in the latest survey and 21% in the one before, with researching and purchasing the product online from a traditional or an online-only store next at 18% in both years’ surveys. When asked flat out, 50% of respondents to the latest survey said they were most likely to purchase in-store and 33% were equally likely to purchase in-store or online.
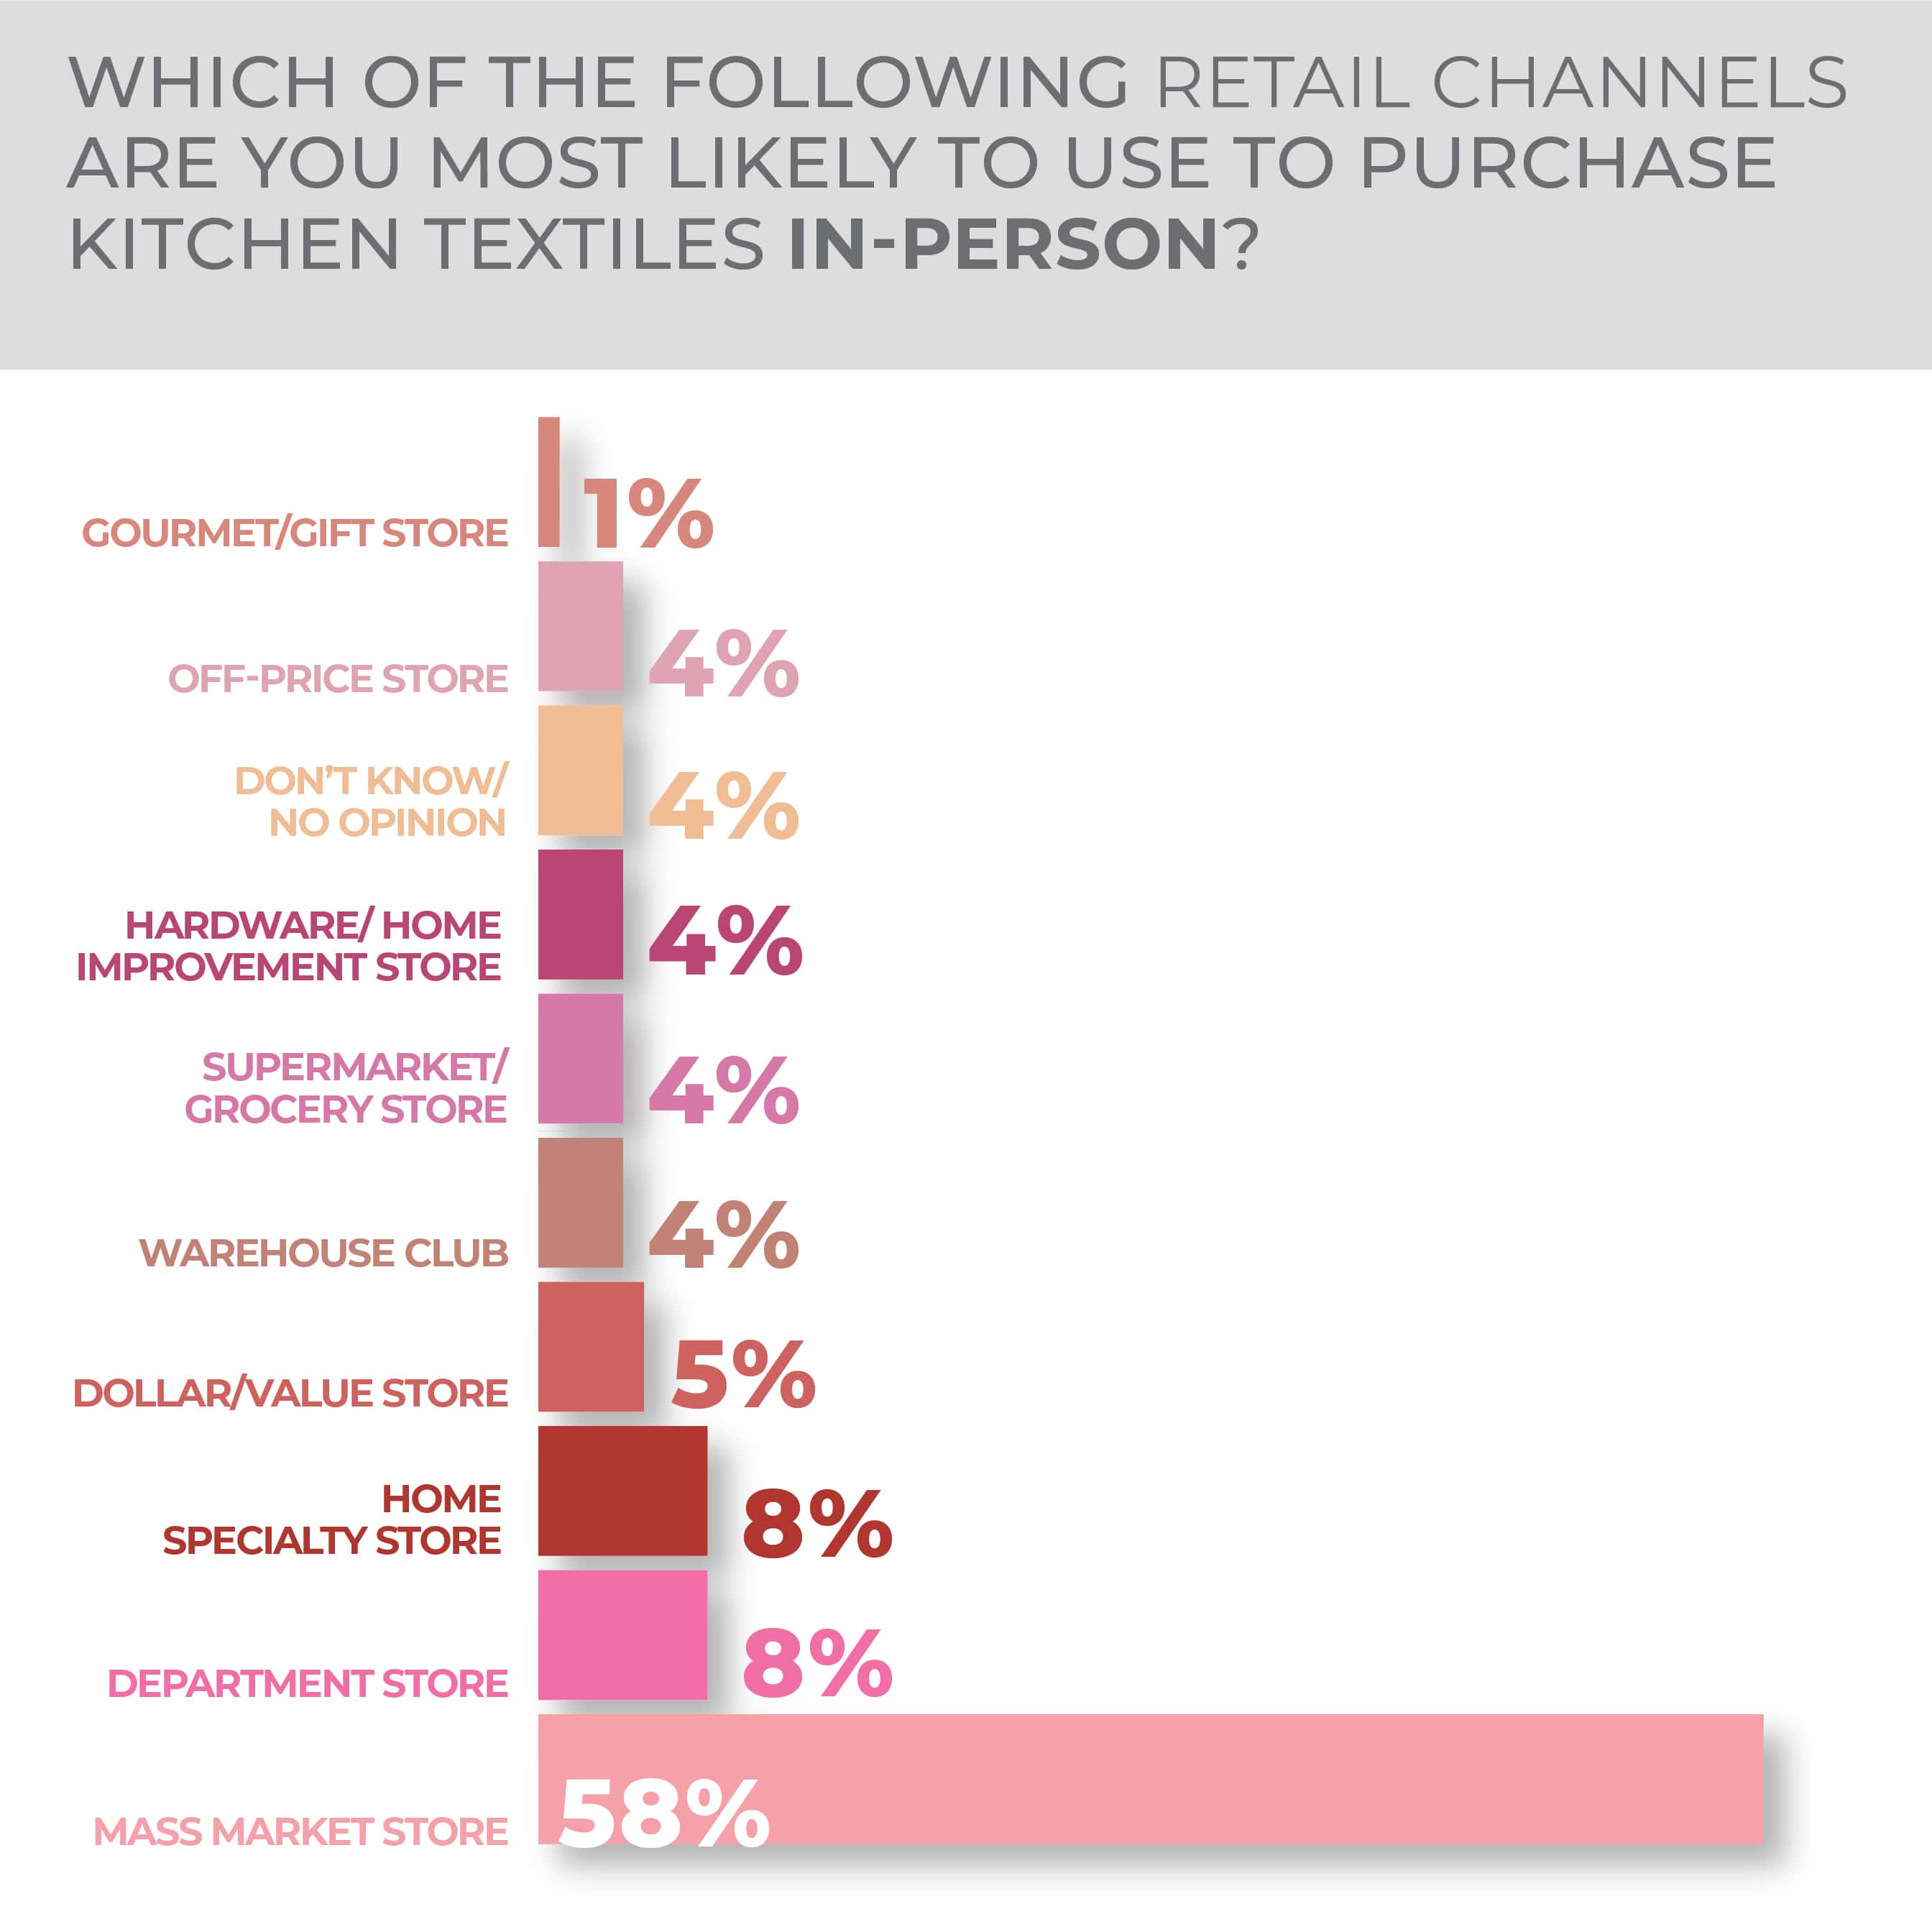
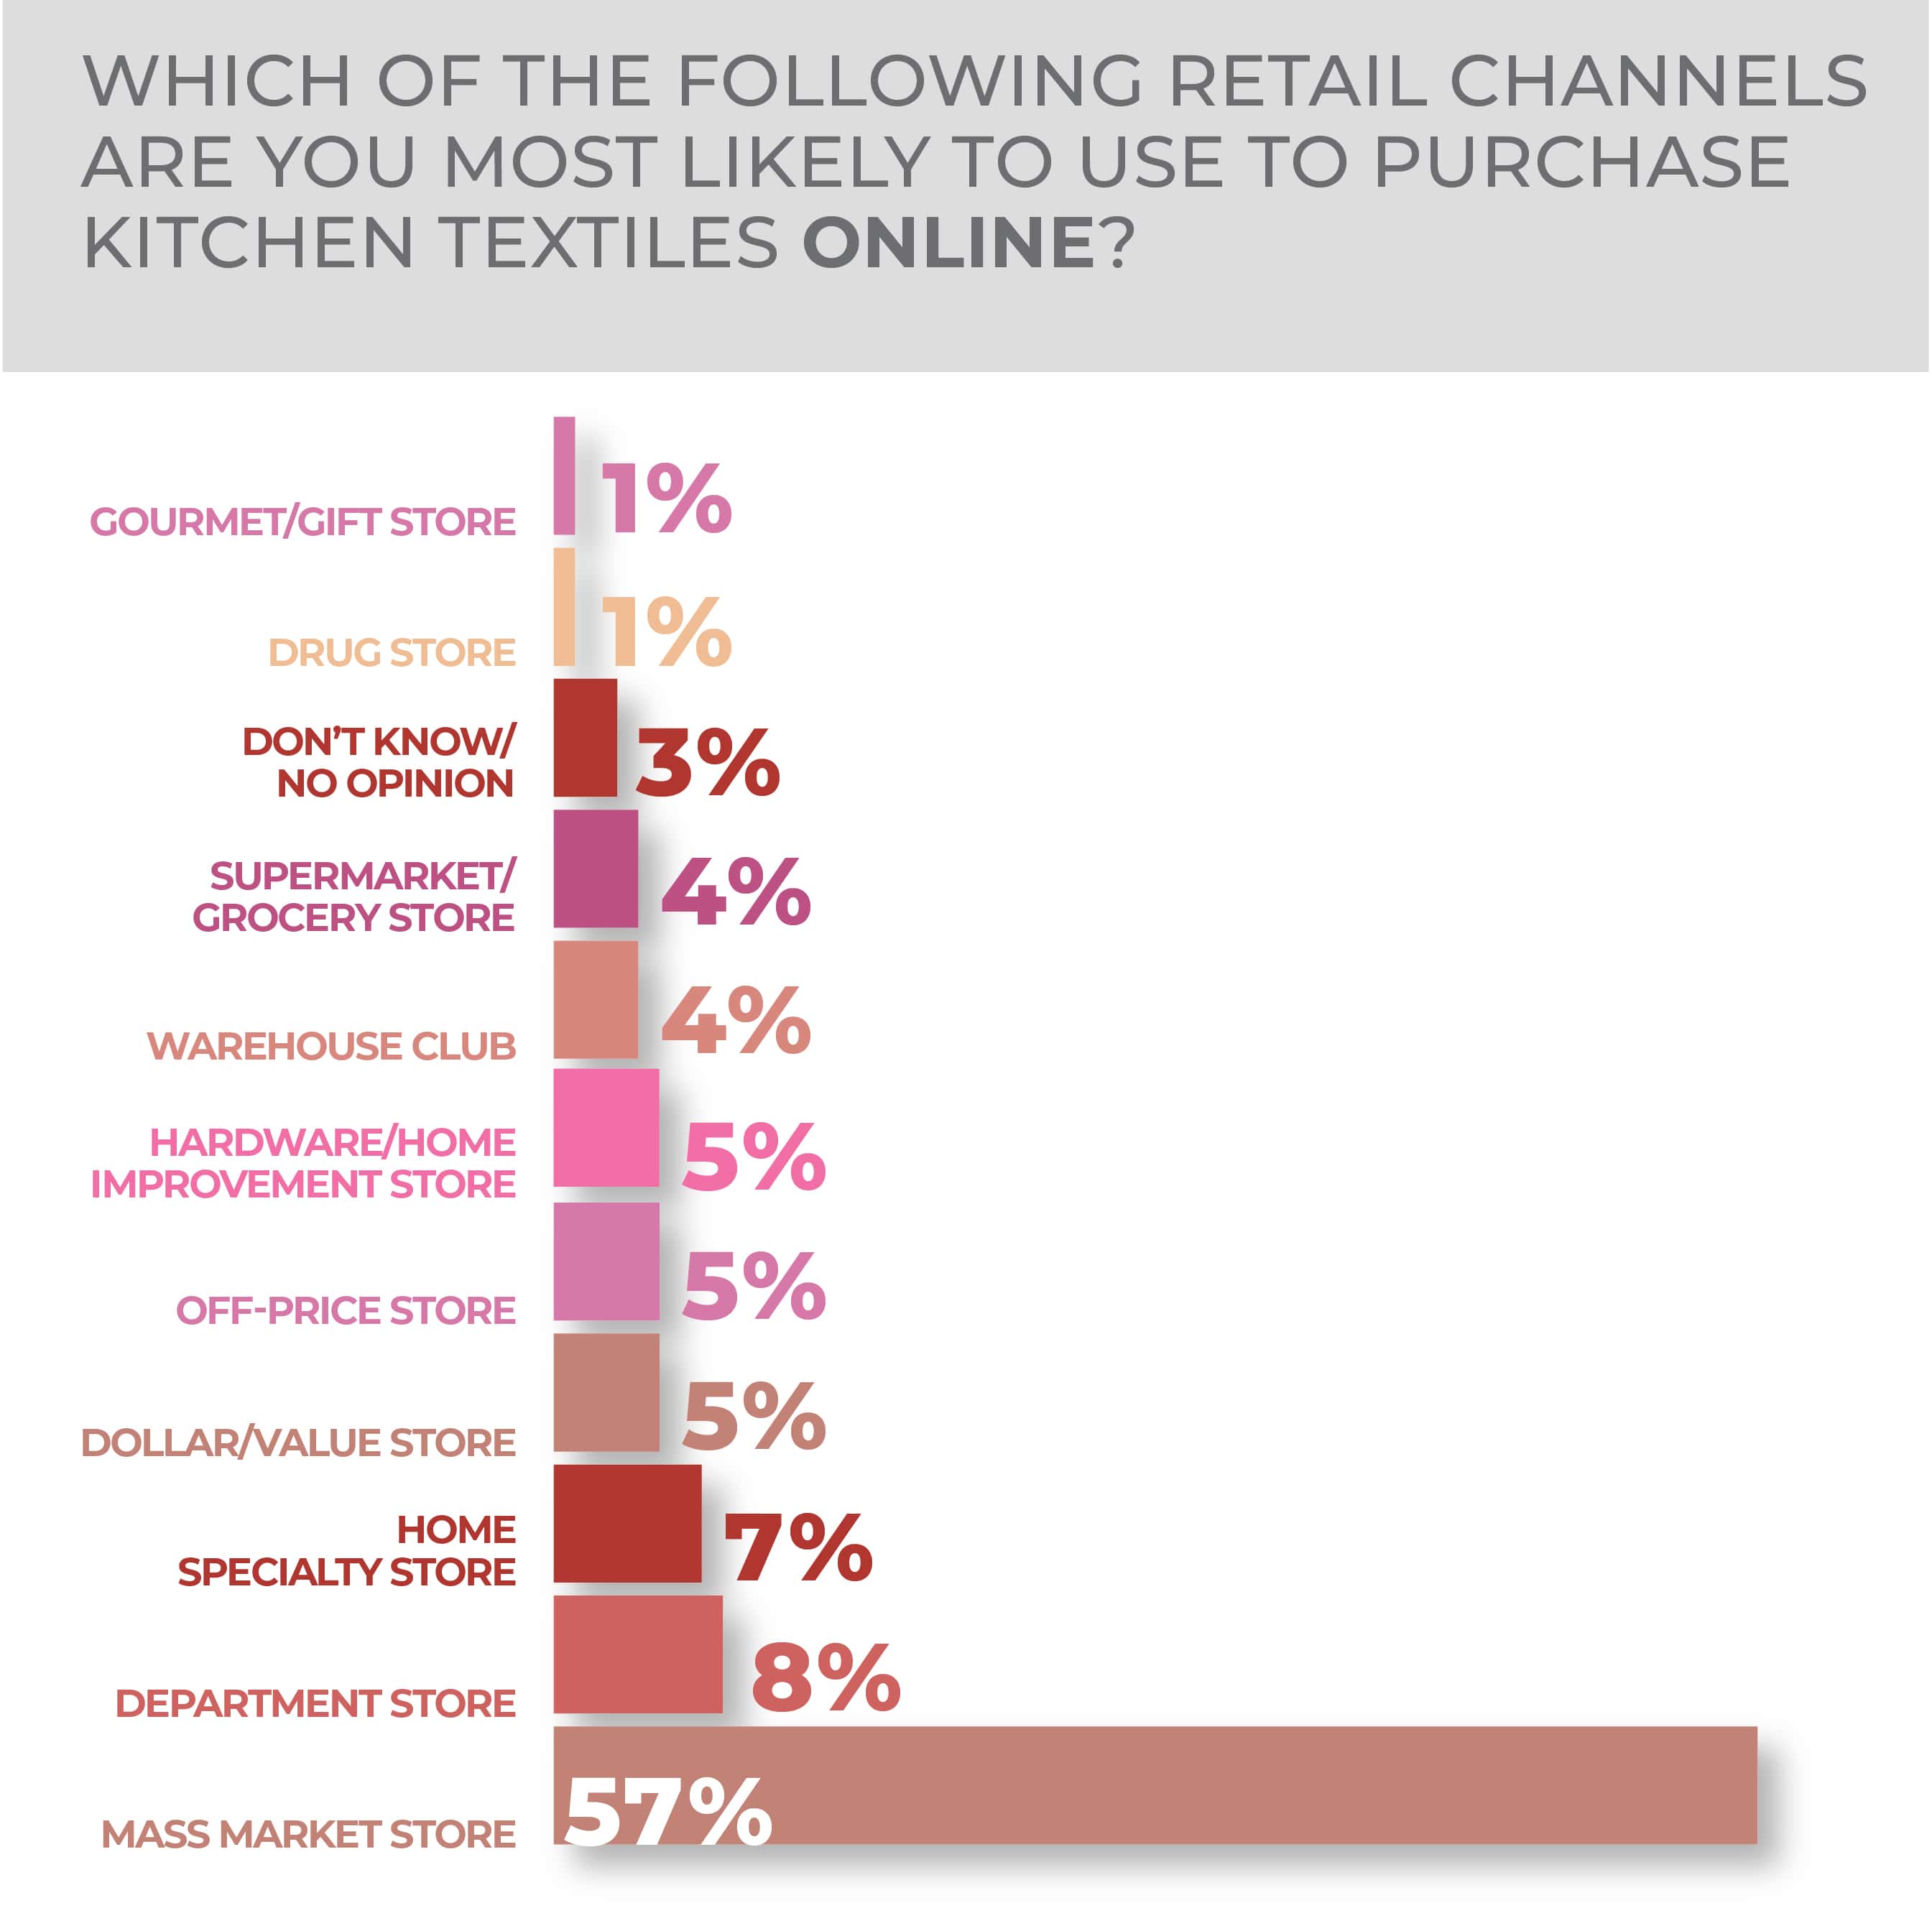
Mass-market retailers were the destination of choice both for in-person purchasing at 58%, and online at 57%. The slide down to the next most popular choice for in-person purchase was steep: 8% for department stores and home specialty stores. Online, the tumble was down to 8% for department stores and 7% for home specialty stores. In both cases, no other retail channel topped 5%.
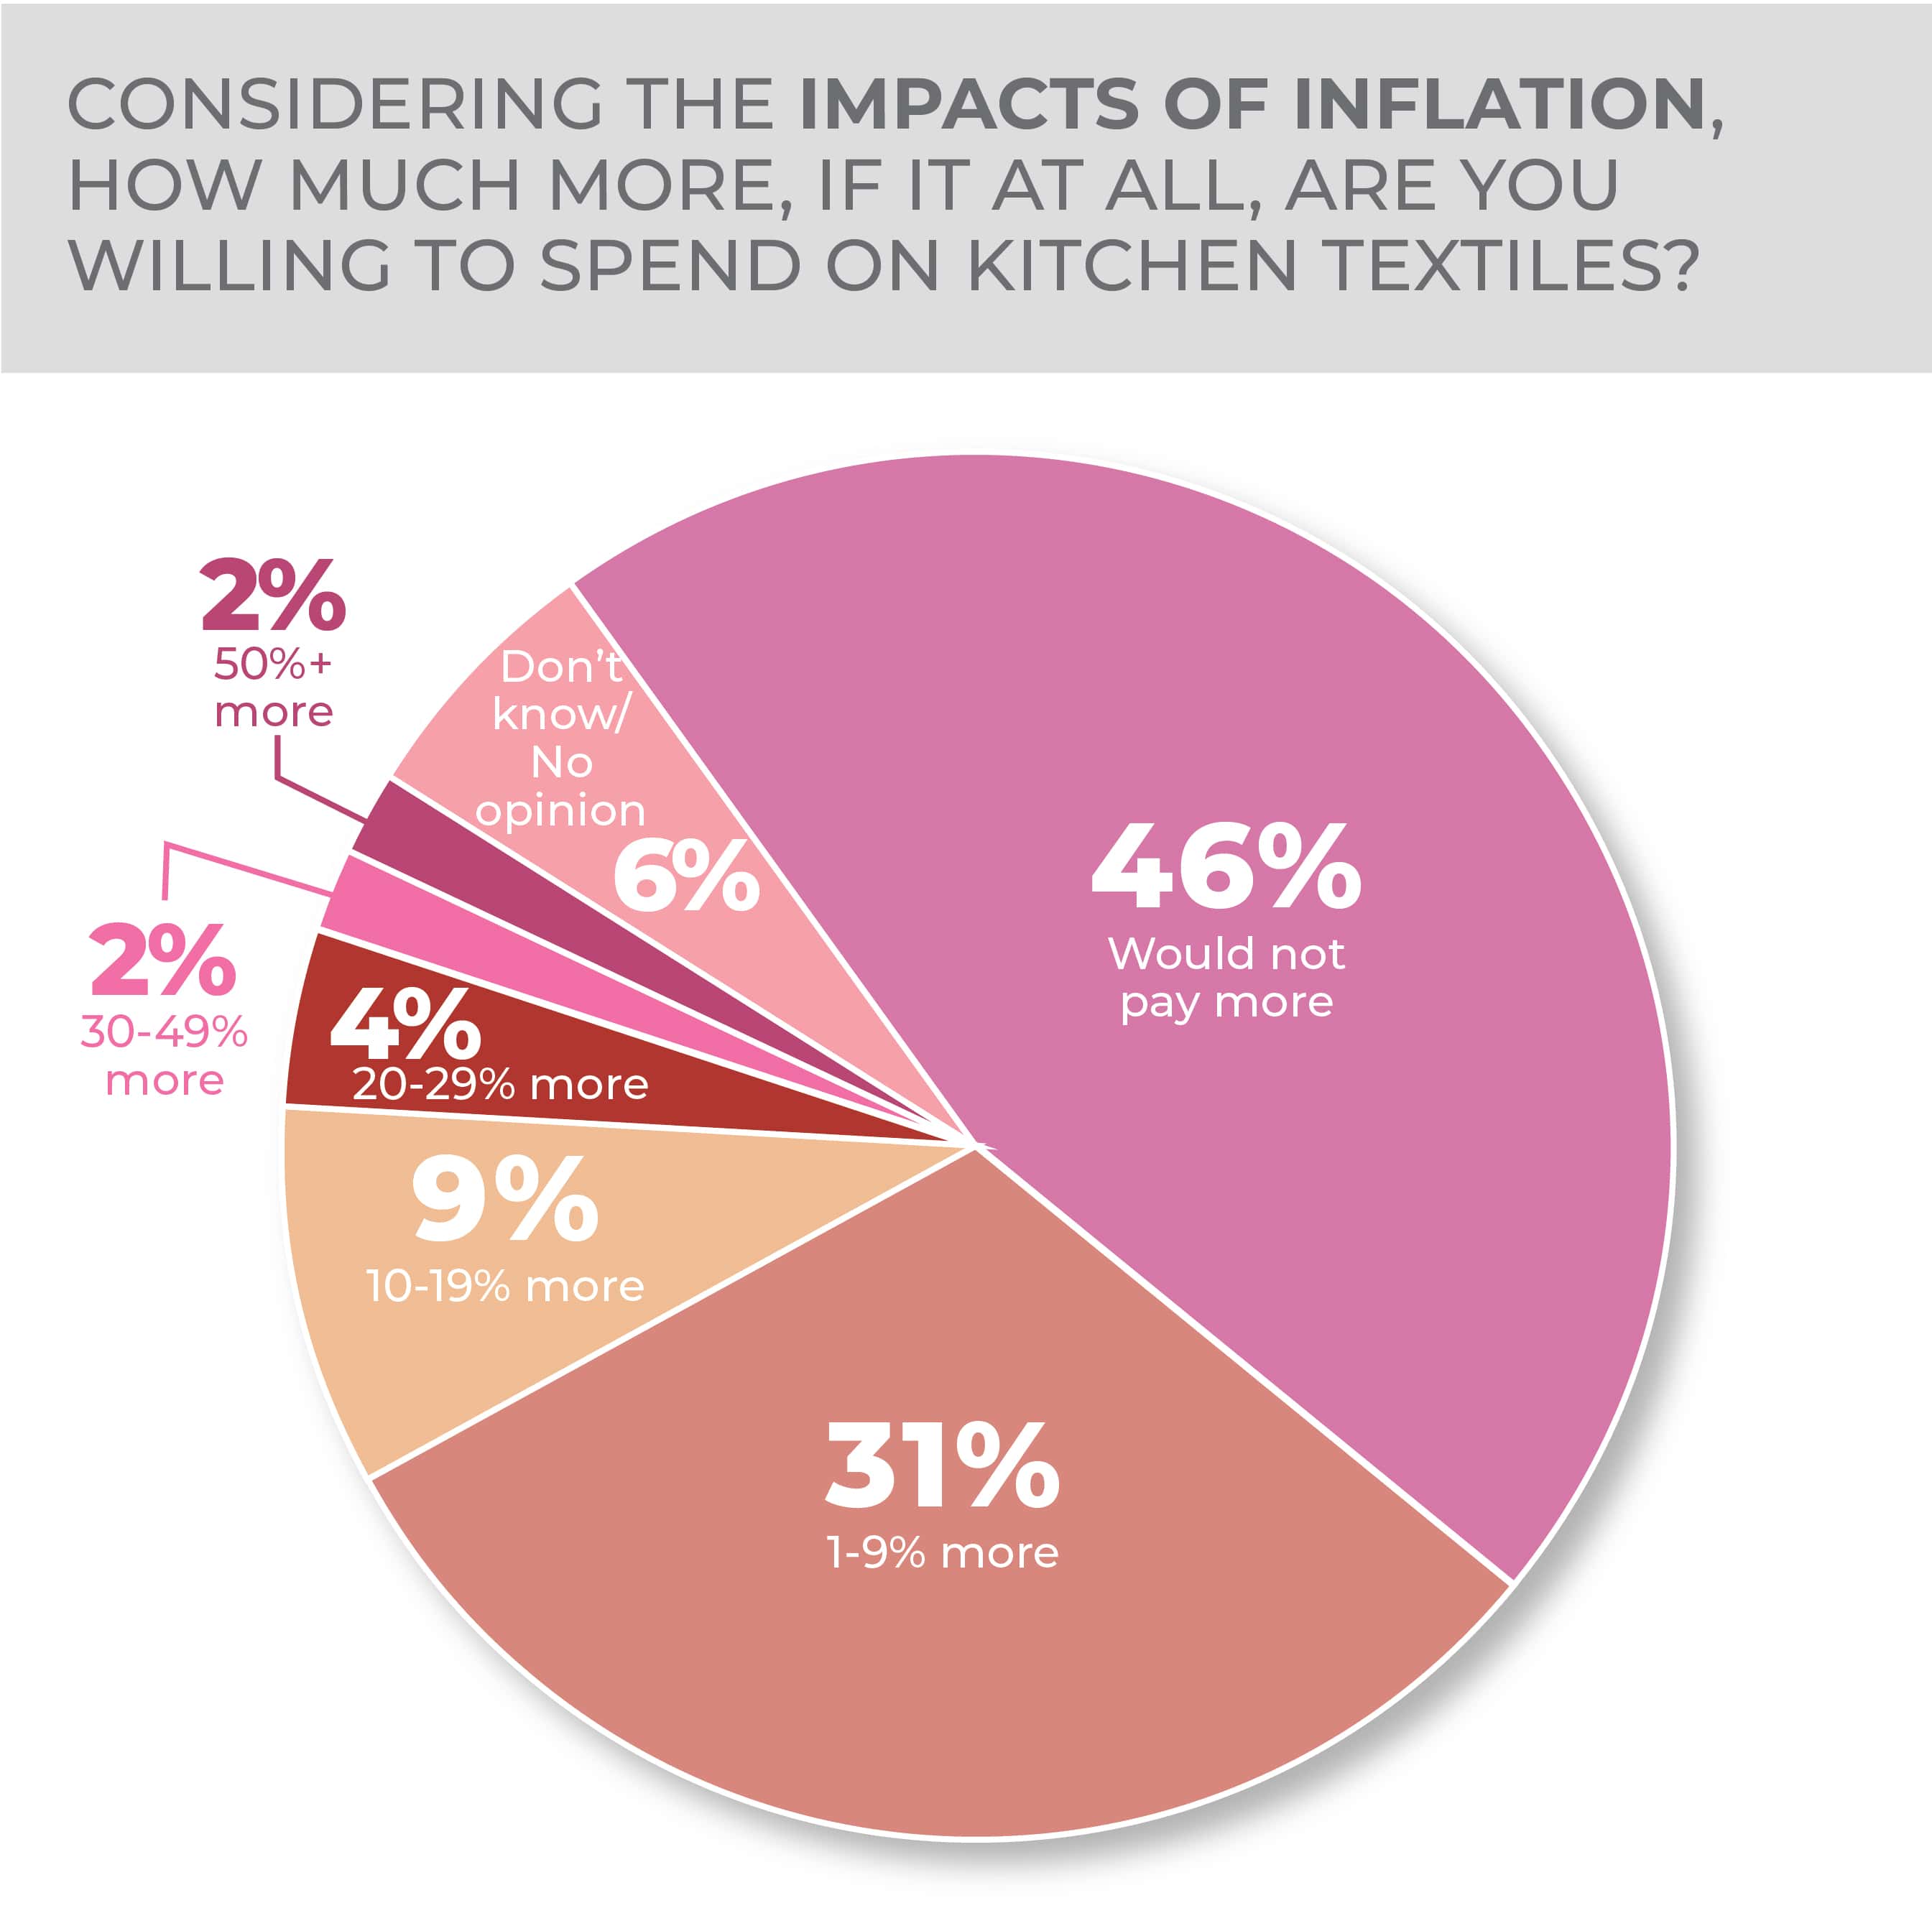
Consumers are reluctant to chip in more for kitchen textiles, no matter what prices do in the market, with 46% of survey respondents saying they wouldn’t pay more and 31% saying they would only pay 1% to 9% more.
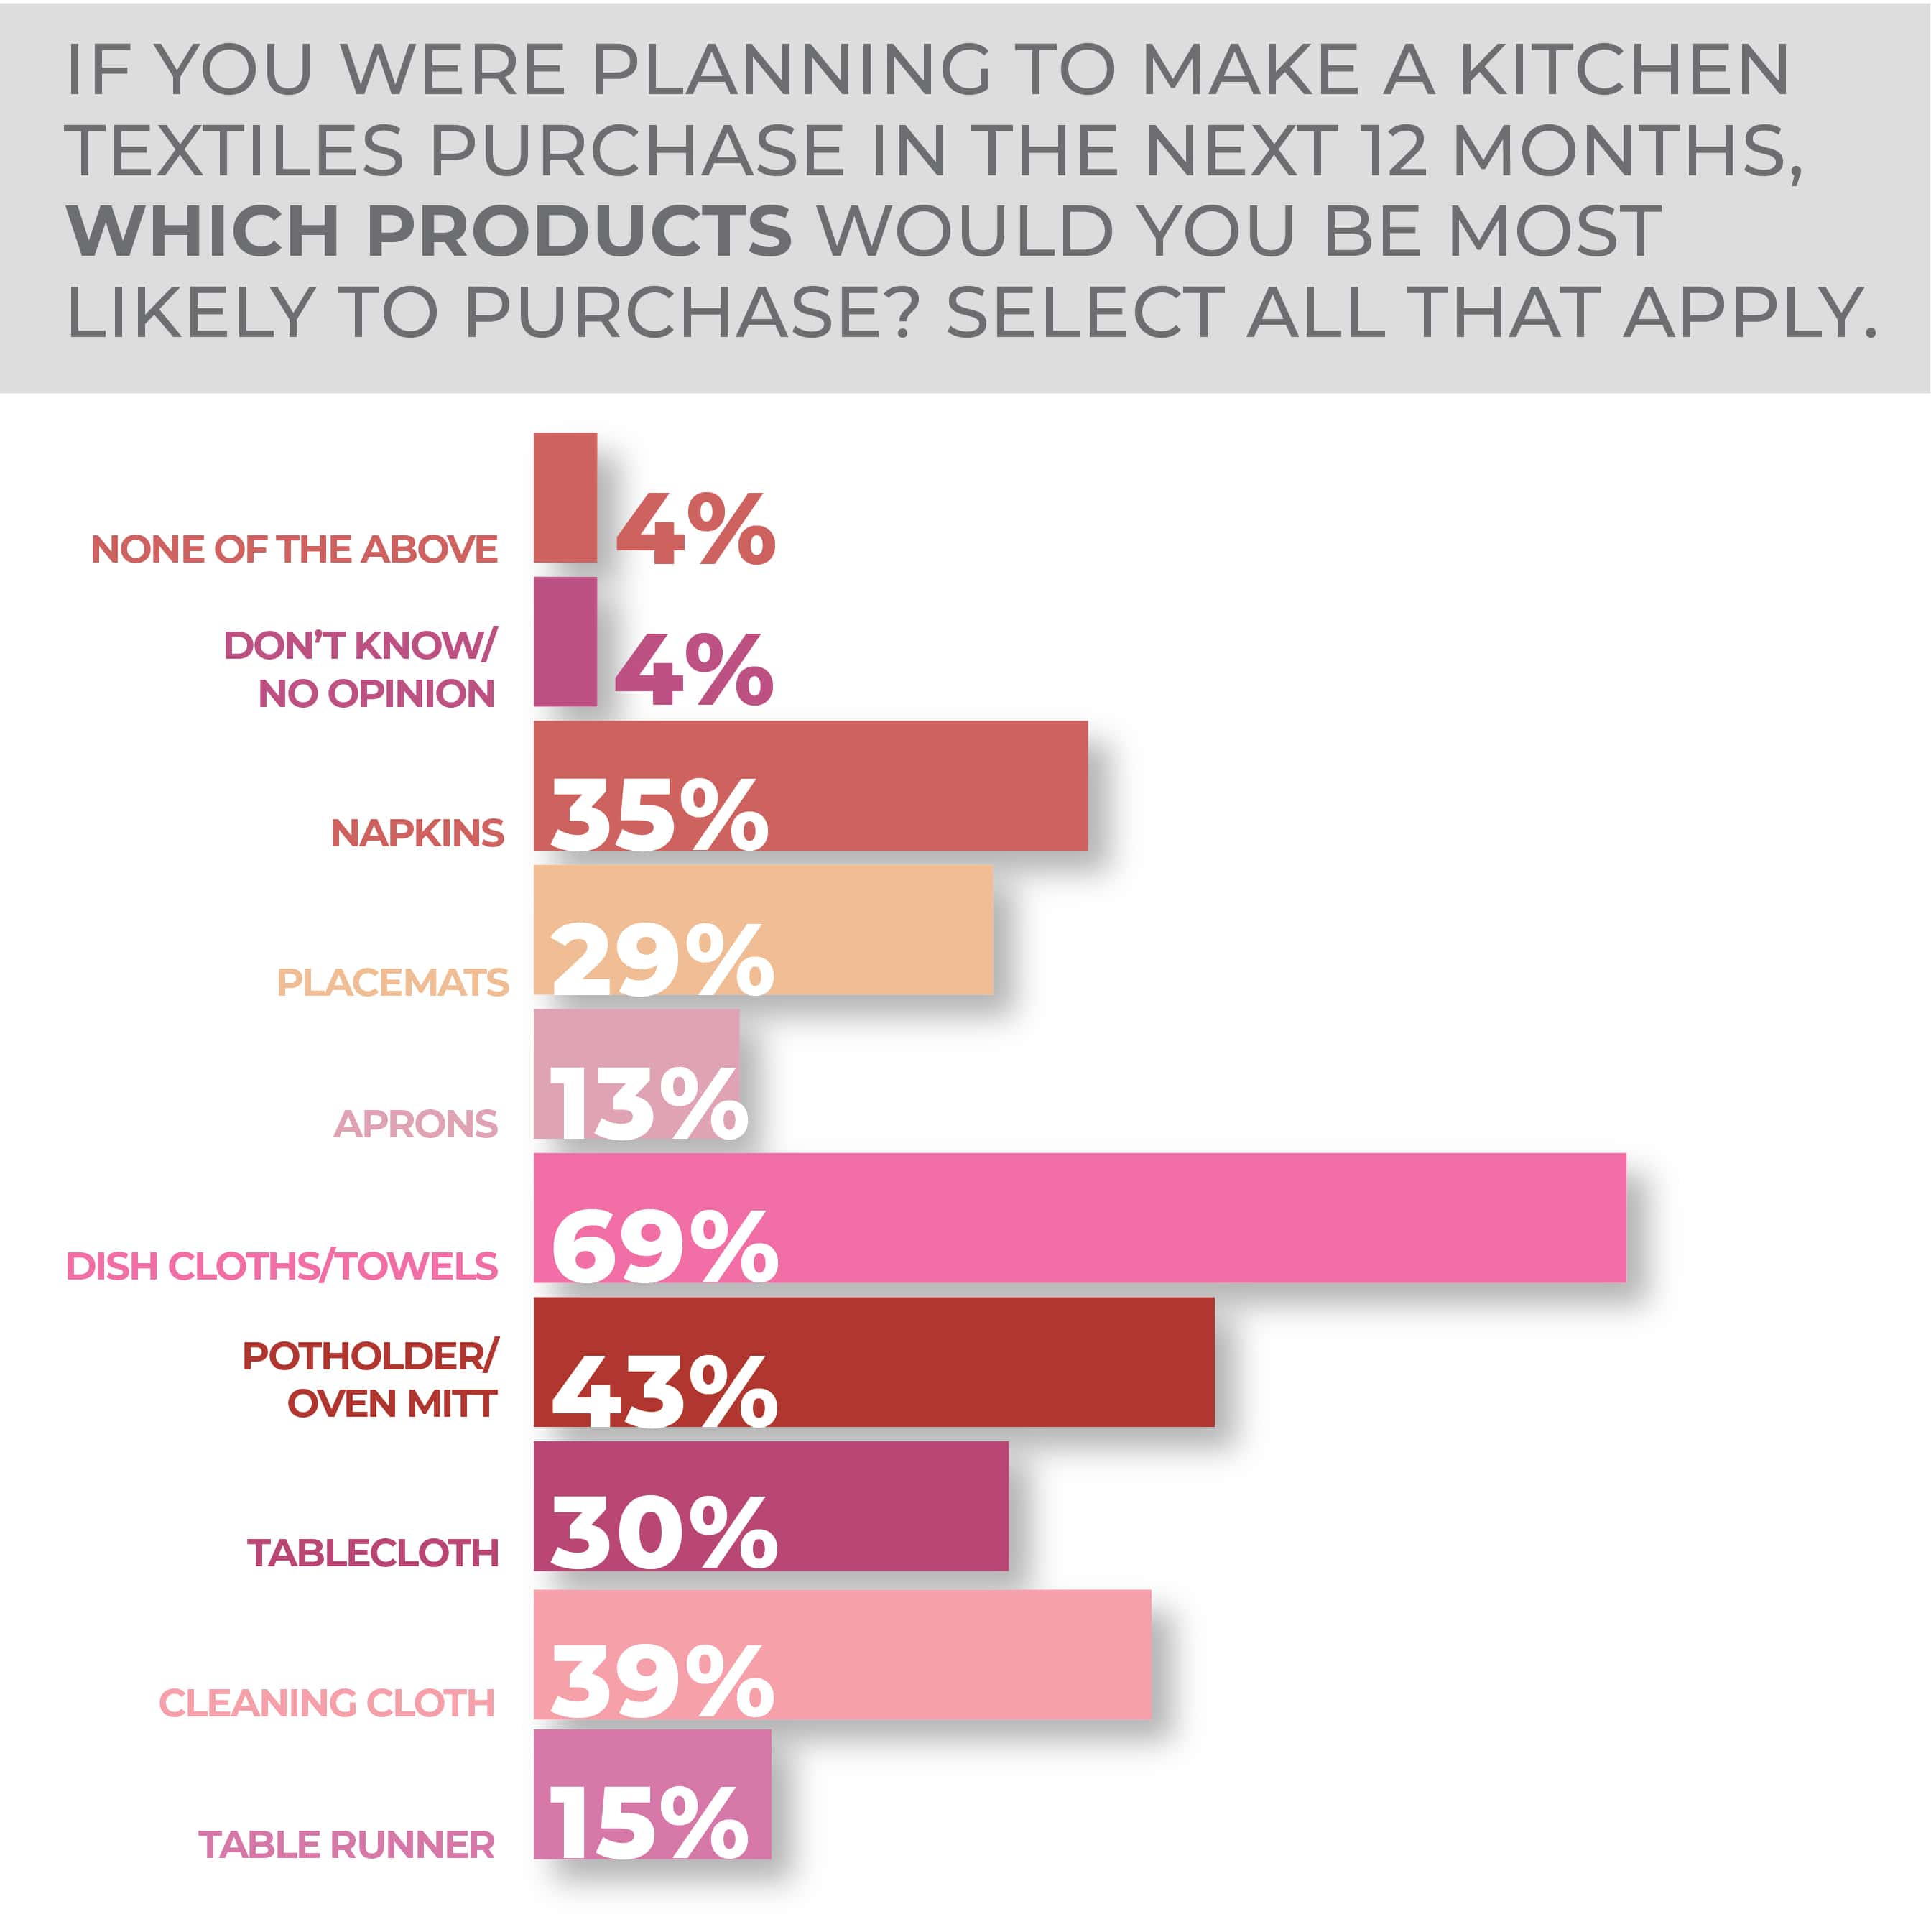
The big potential for purchase over the next year in the kitchen textile category is for dishcloths at 69% followed at some distance by potholders/oven mitts at 43%, followed by cleaning cloths, napkins, tablecloths, placemats, table runners and lastly, aprons at 13%, bringing up the rear. Little changed year over year.
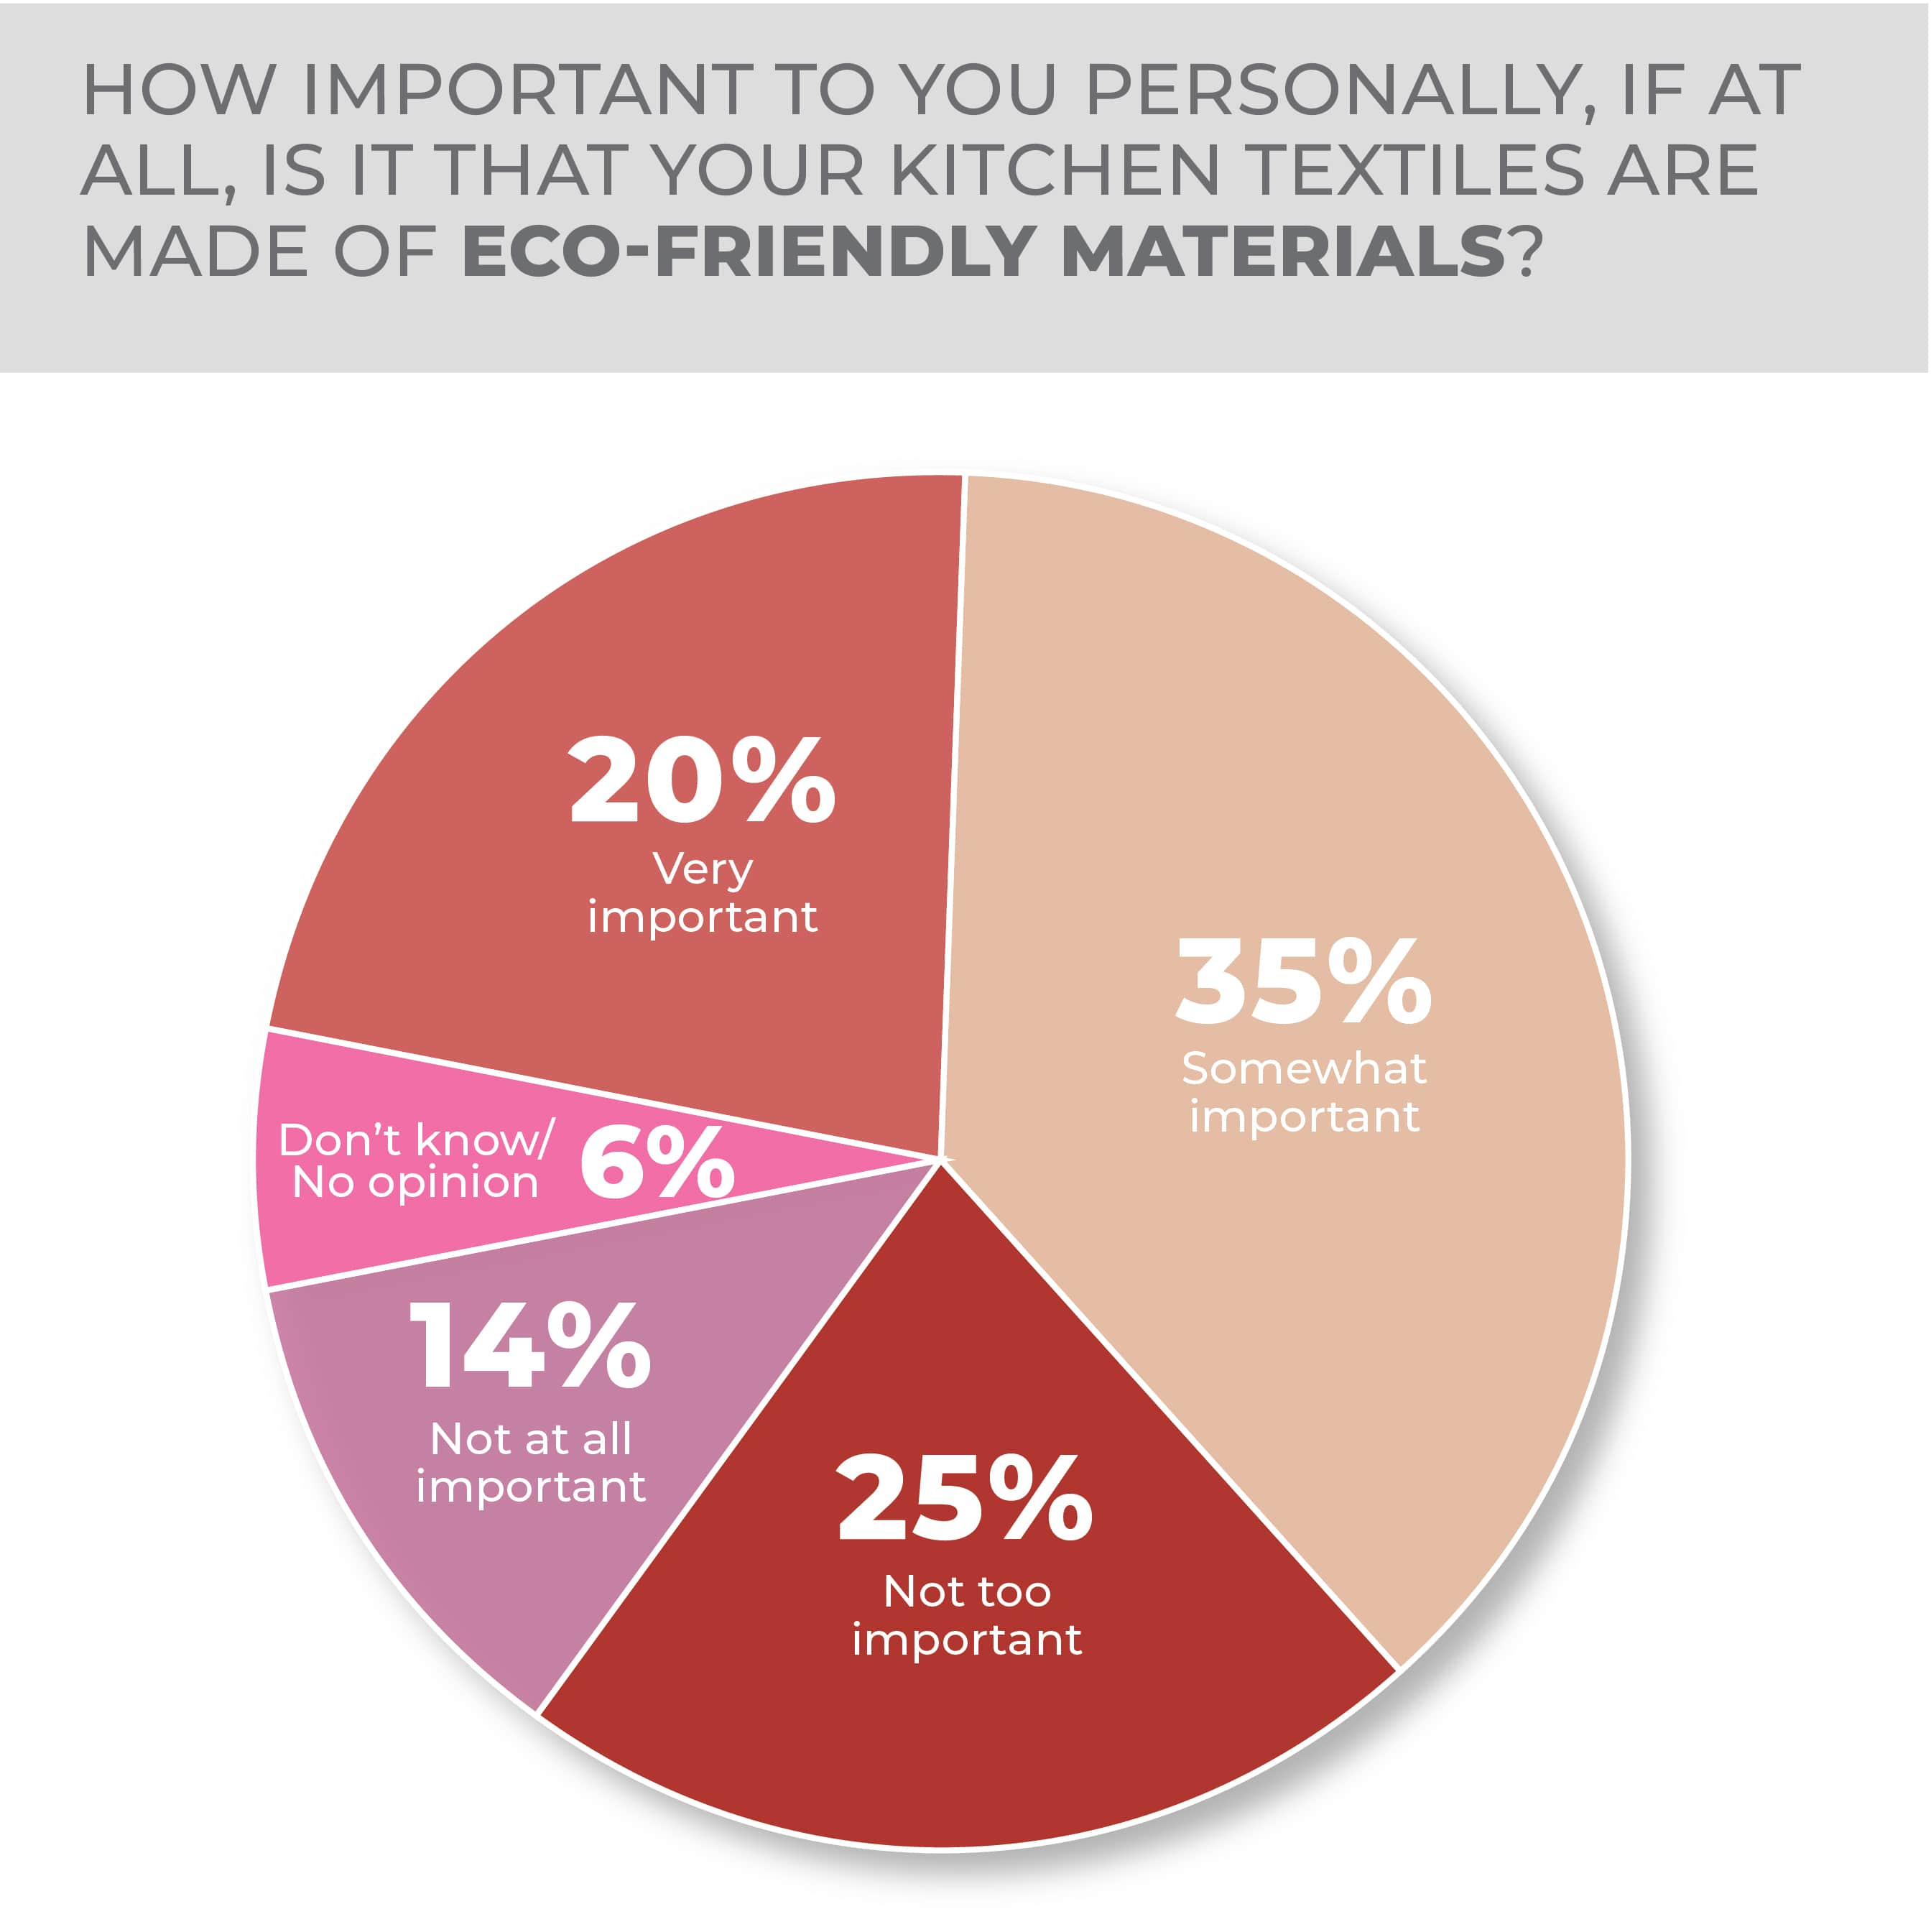
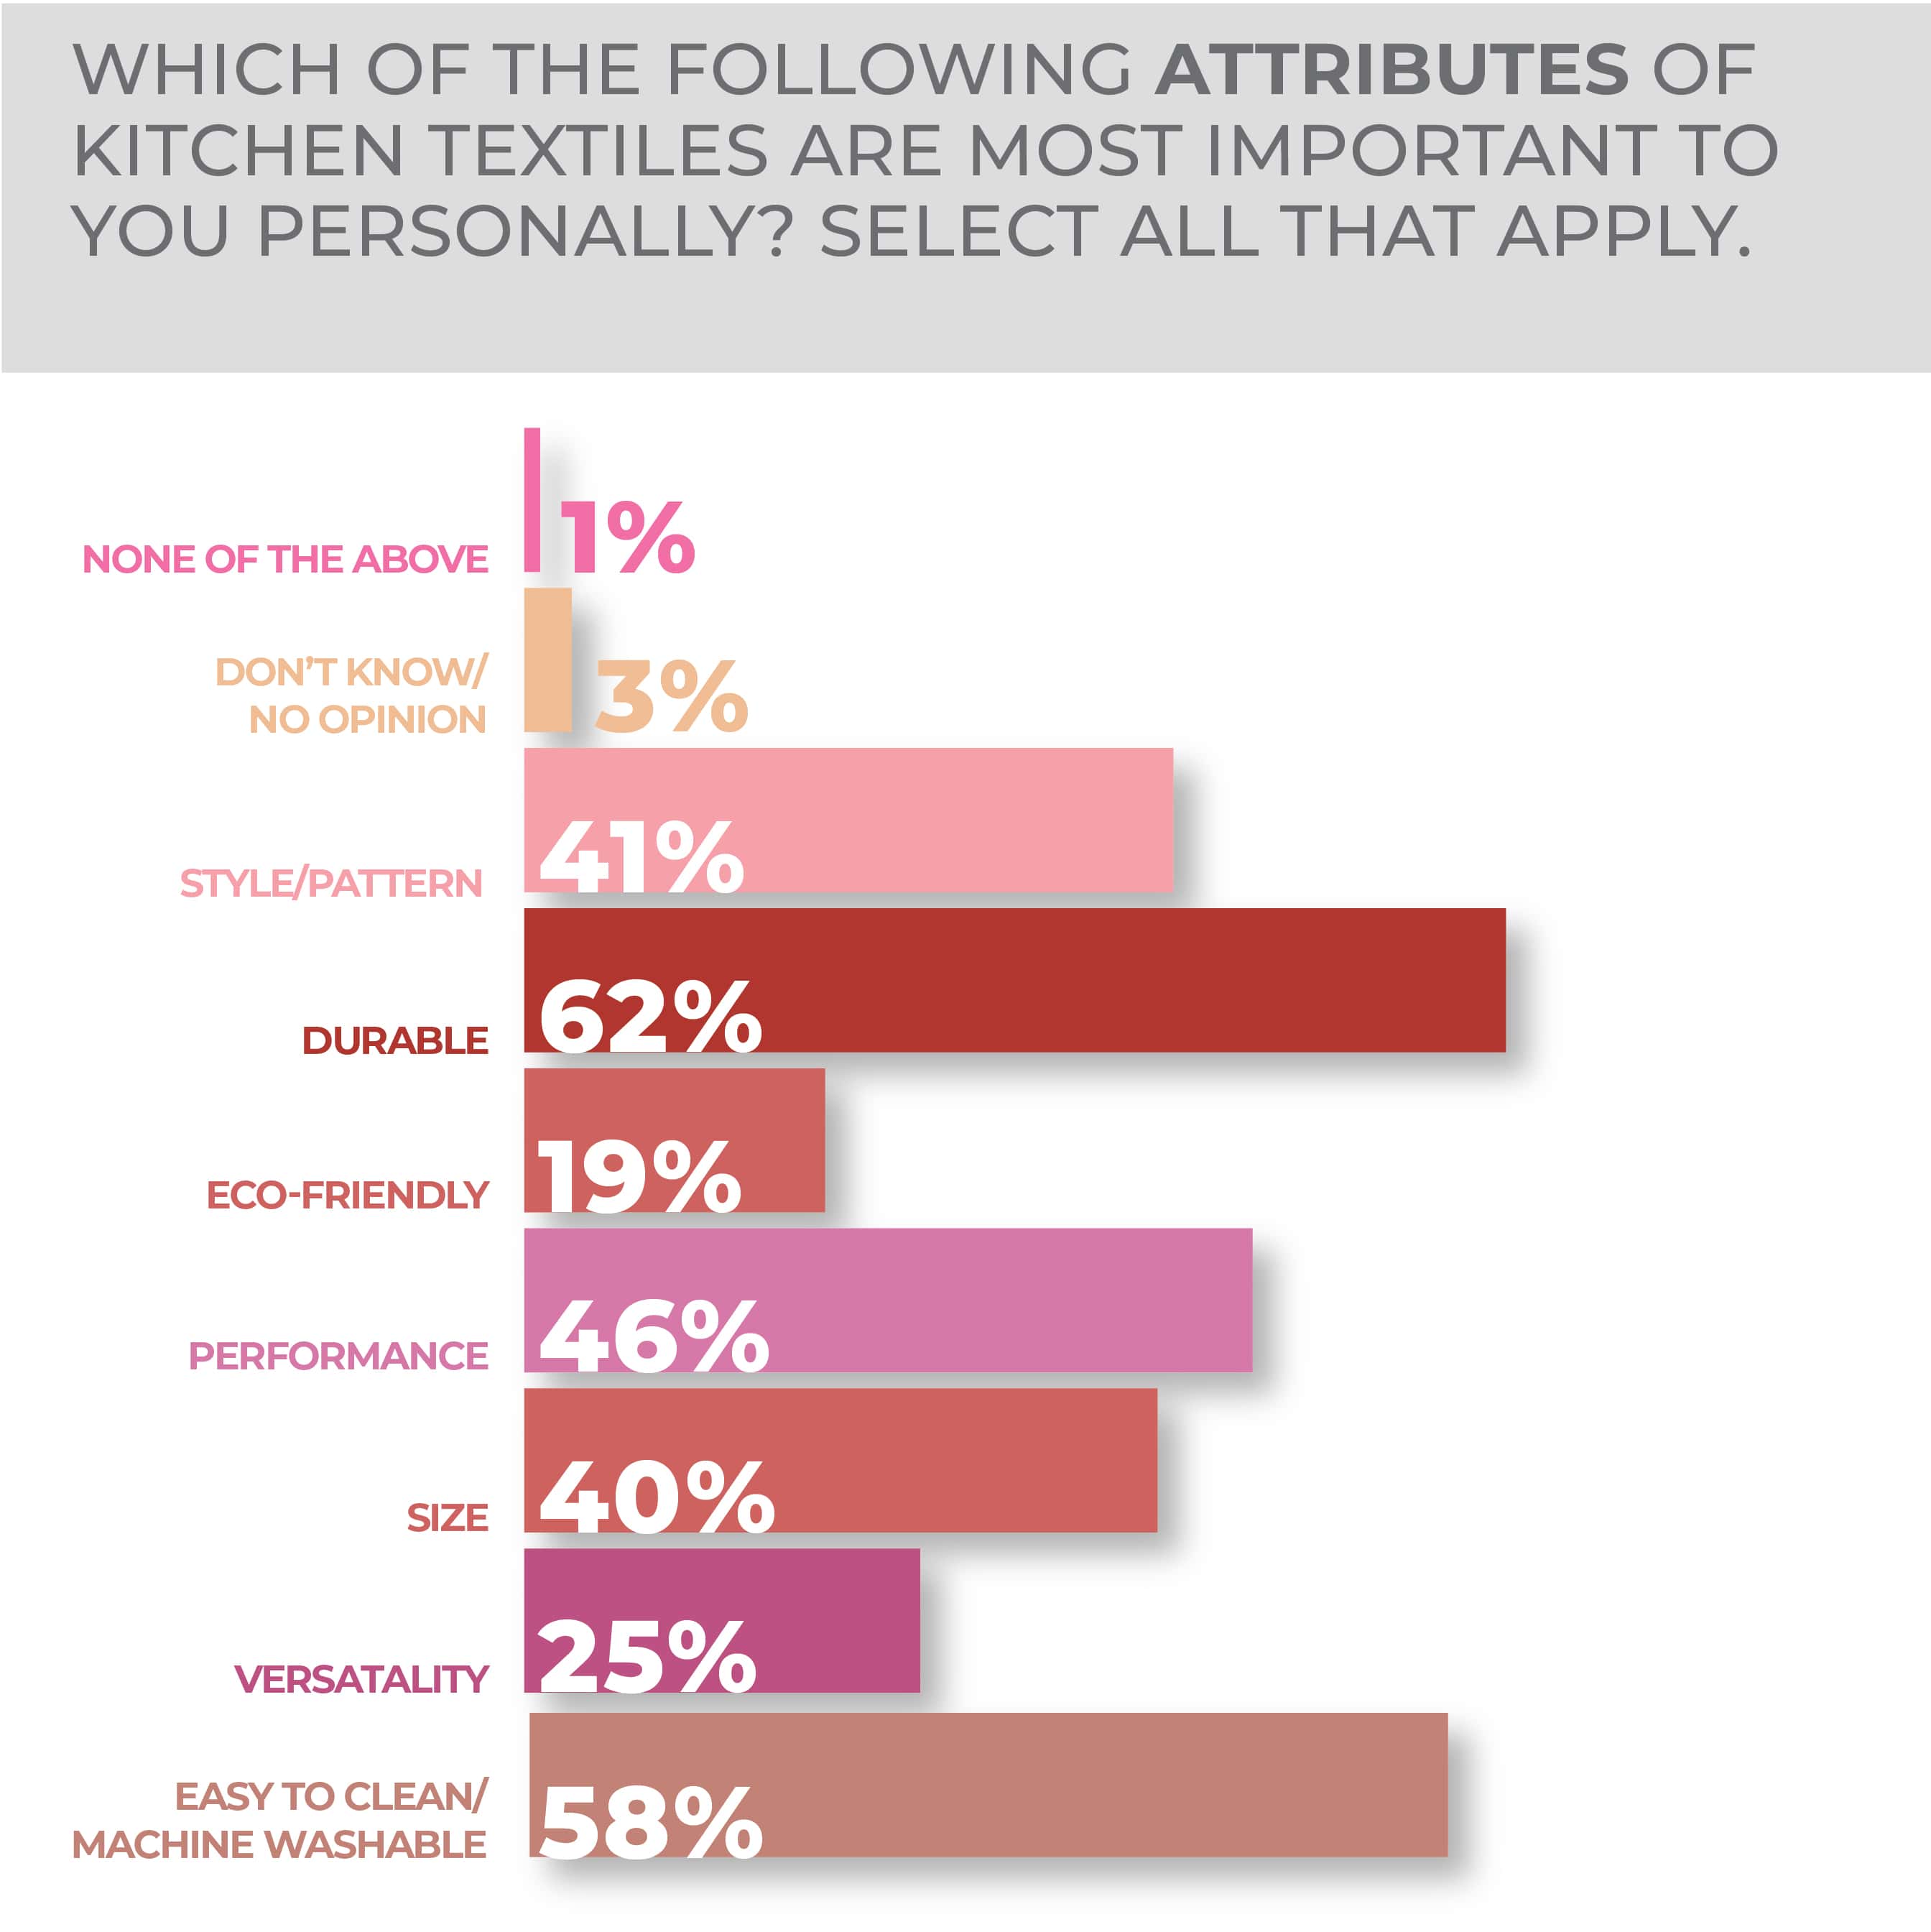
Consumers ask a lot of their kitchen textiles. 62% want them to be durable, 58% want them to be easy to clean/machine washable, 46% want them to perform when it comes to cleaning, absorbance and heat protection, 41% want them to have an enticing pattern and 40% want them to be sized to their preference. Then, 32% want kitchen textiles to be easy to hang/store, 25% want them to be versatile and 19% want them to be eco-friendly. When asked directly about sustainability, 20% of survey respondents said it was very important that kitchen textiles be made of eco-friendly materials and 35% said it was somewhat important.
Although women were more interested in purchasing kitchen textiles, men were not that far behind with women at 25% very and 36% somewhat likely versus men at 18% very likely and 36% somewhat likely. Older Millennials 35-44 years old were the most likely by age category at 27% very likely and 41% somewhat likely. Younger consumers 18-34 were close behind at 26% and 35% and those 45-64 were next at 21% and 35%, respectively.
More Kitchen Textiles Findings:
Kitchen Tools & Gadgets
Kitchen tools and gadgets continue to be among the most in-demand products in the wake of a period during which consumers expanded their in-home cooking and dining activity, which sparked a surge of interest in new and specialized tools.
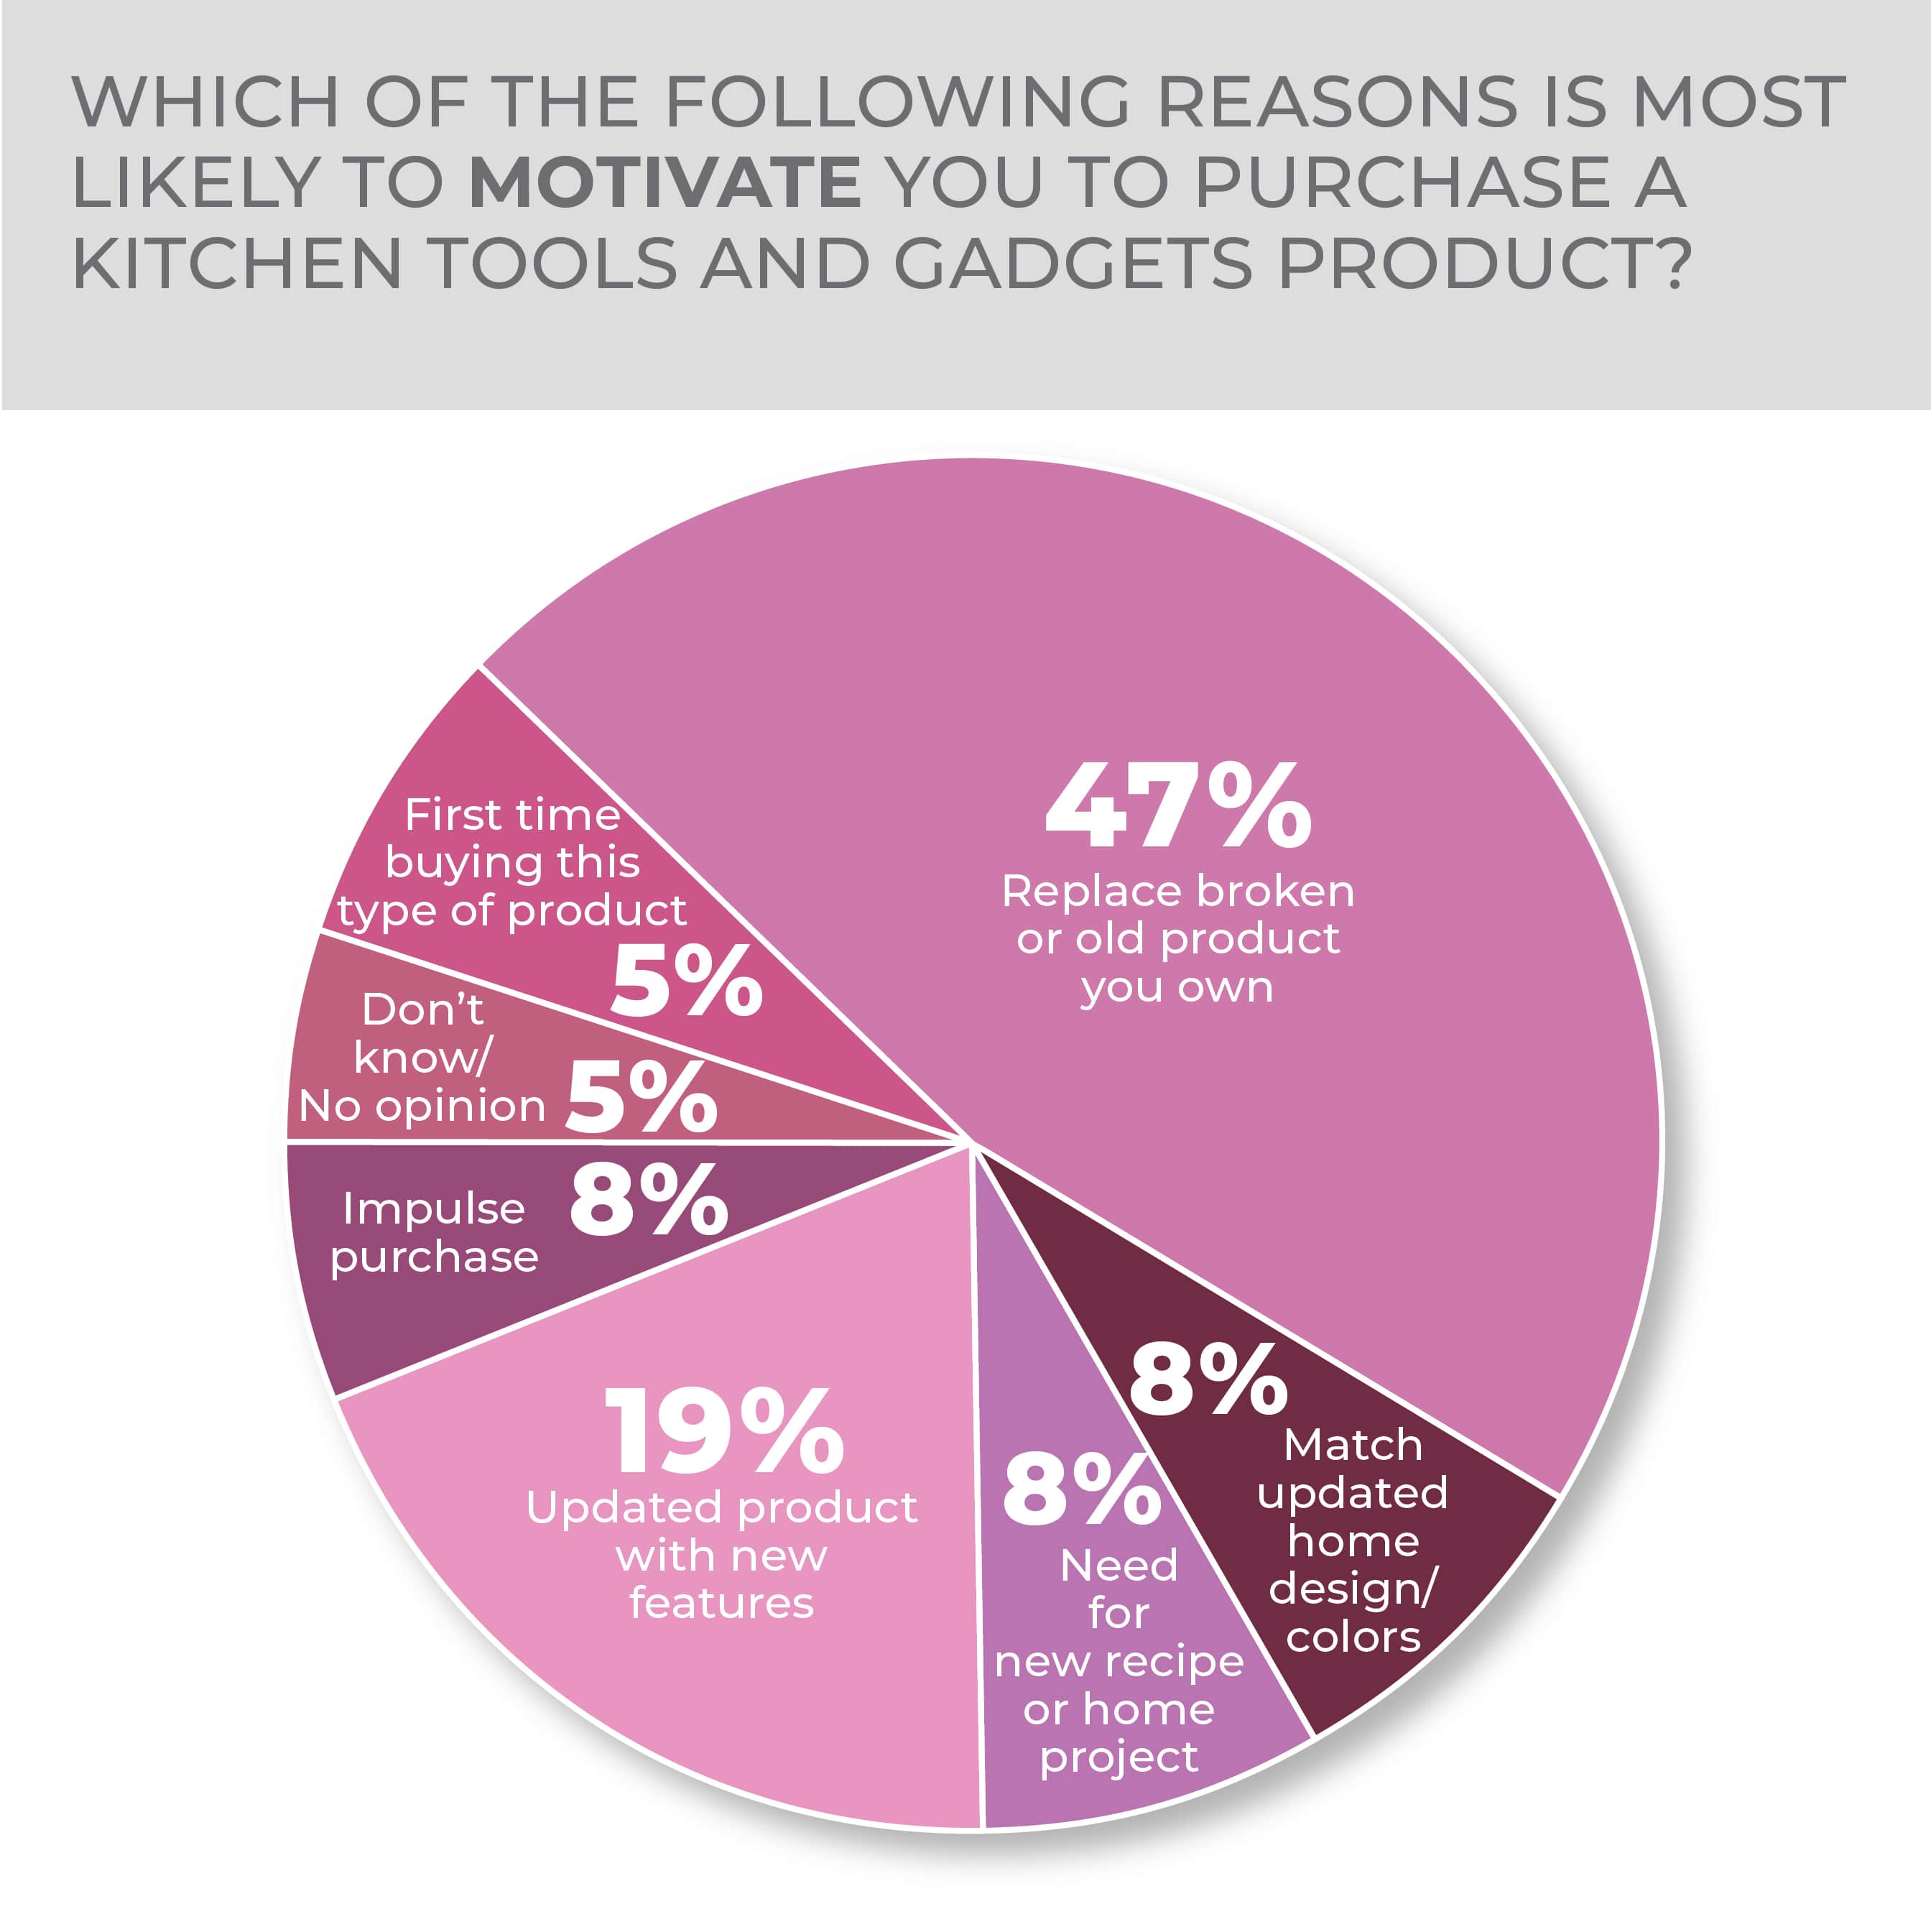
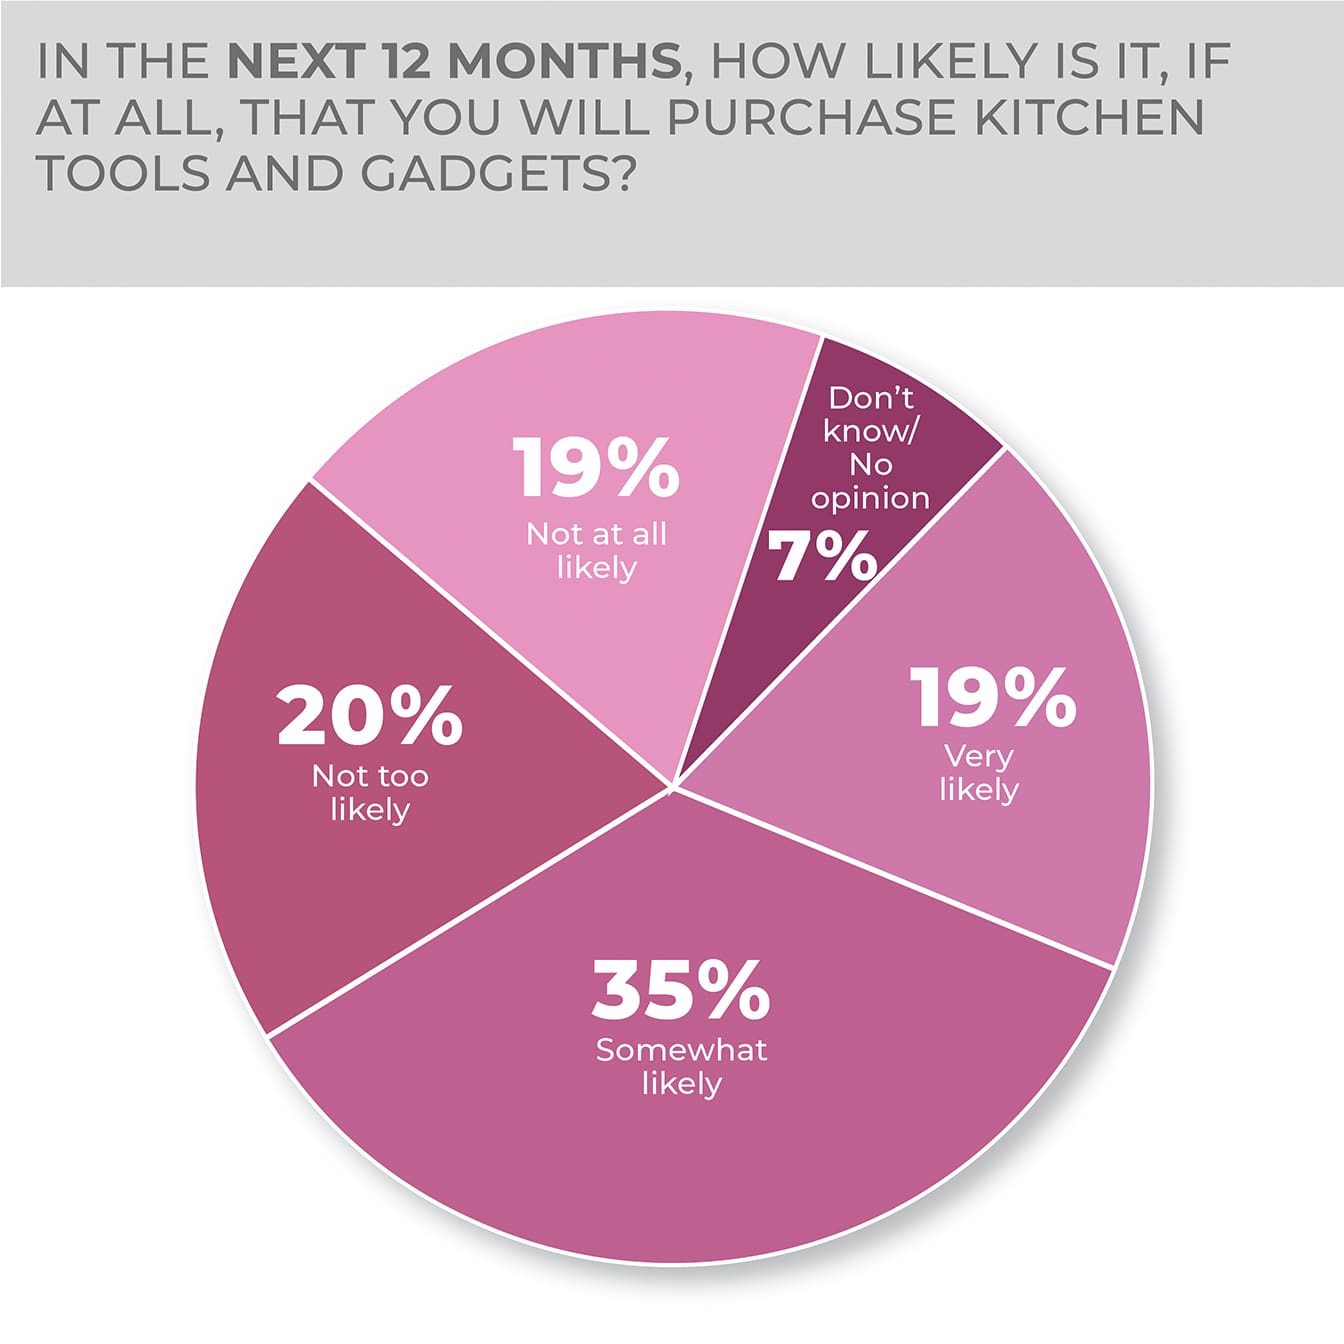
According to data from the HomePage News 2023 Consumer Outlook Survey, 55% of respondents stated they were somewhat likely or very likely to make a kitchen tool and/or gadget purchase in the next 12 months. Replacing old or broken kitchen tools (selected by 47%) remains a primary purchase motivator, followed by updated tools with new features (19%).
It is noteworthy that the purchase intent for kitchen tools and gadgets, like many basic housewares, reduces with respondent age, an indicator that a prime market lies in younger consumers on their own or starting households for the first time. Some 64% of consumers 18 to 34 and 63% of consumers 35 to 40 plan to buy kitchen tools and gadgets in the next year, compared to 41% in the 65-and-older group.
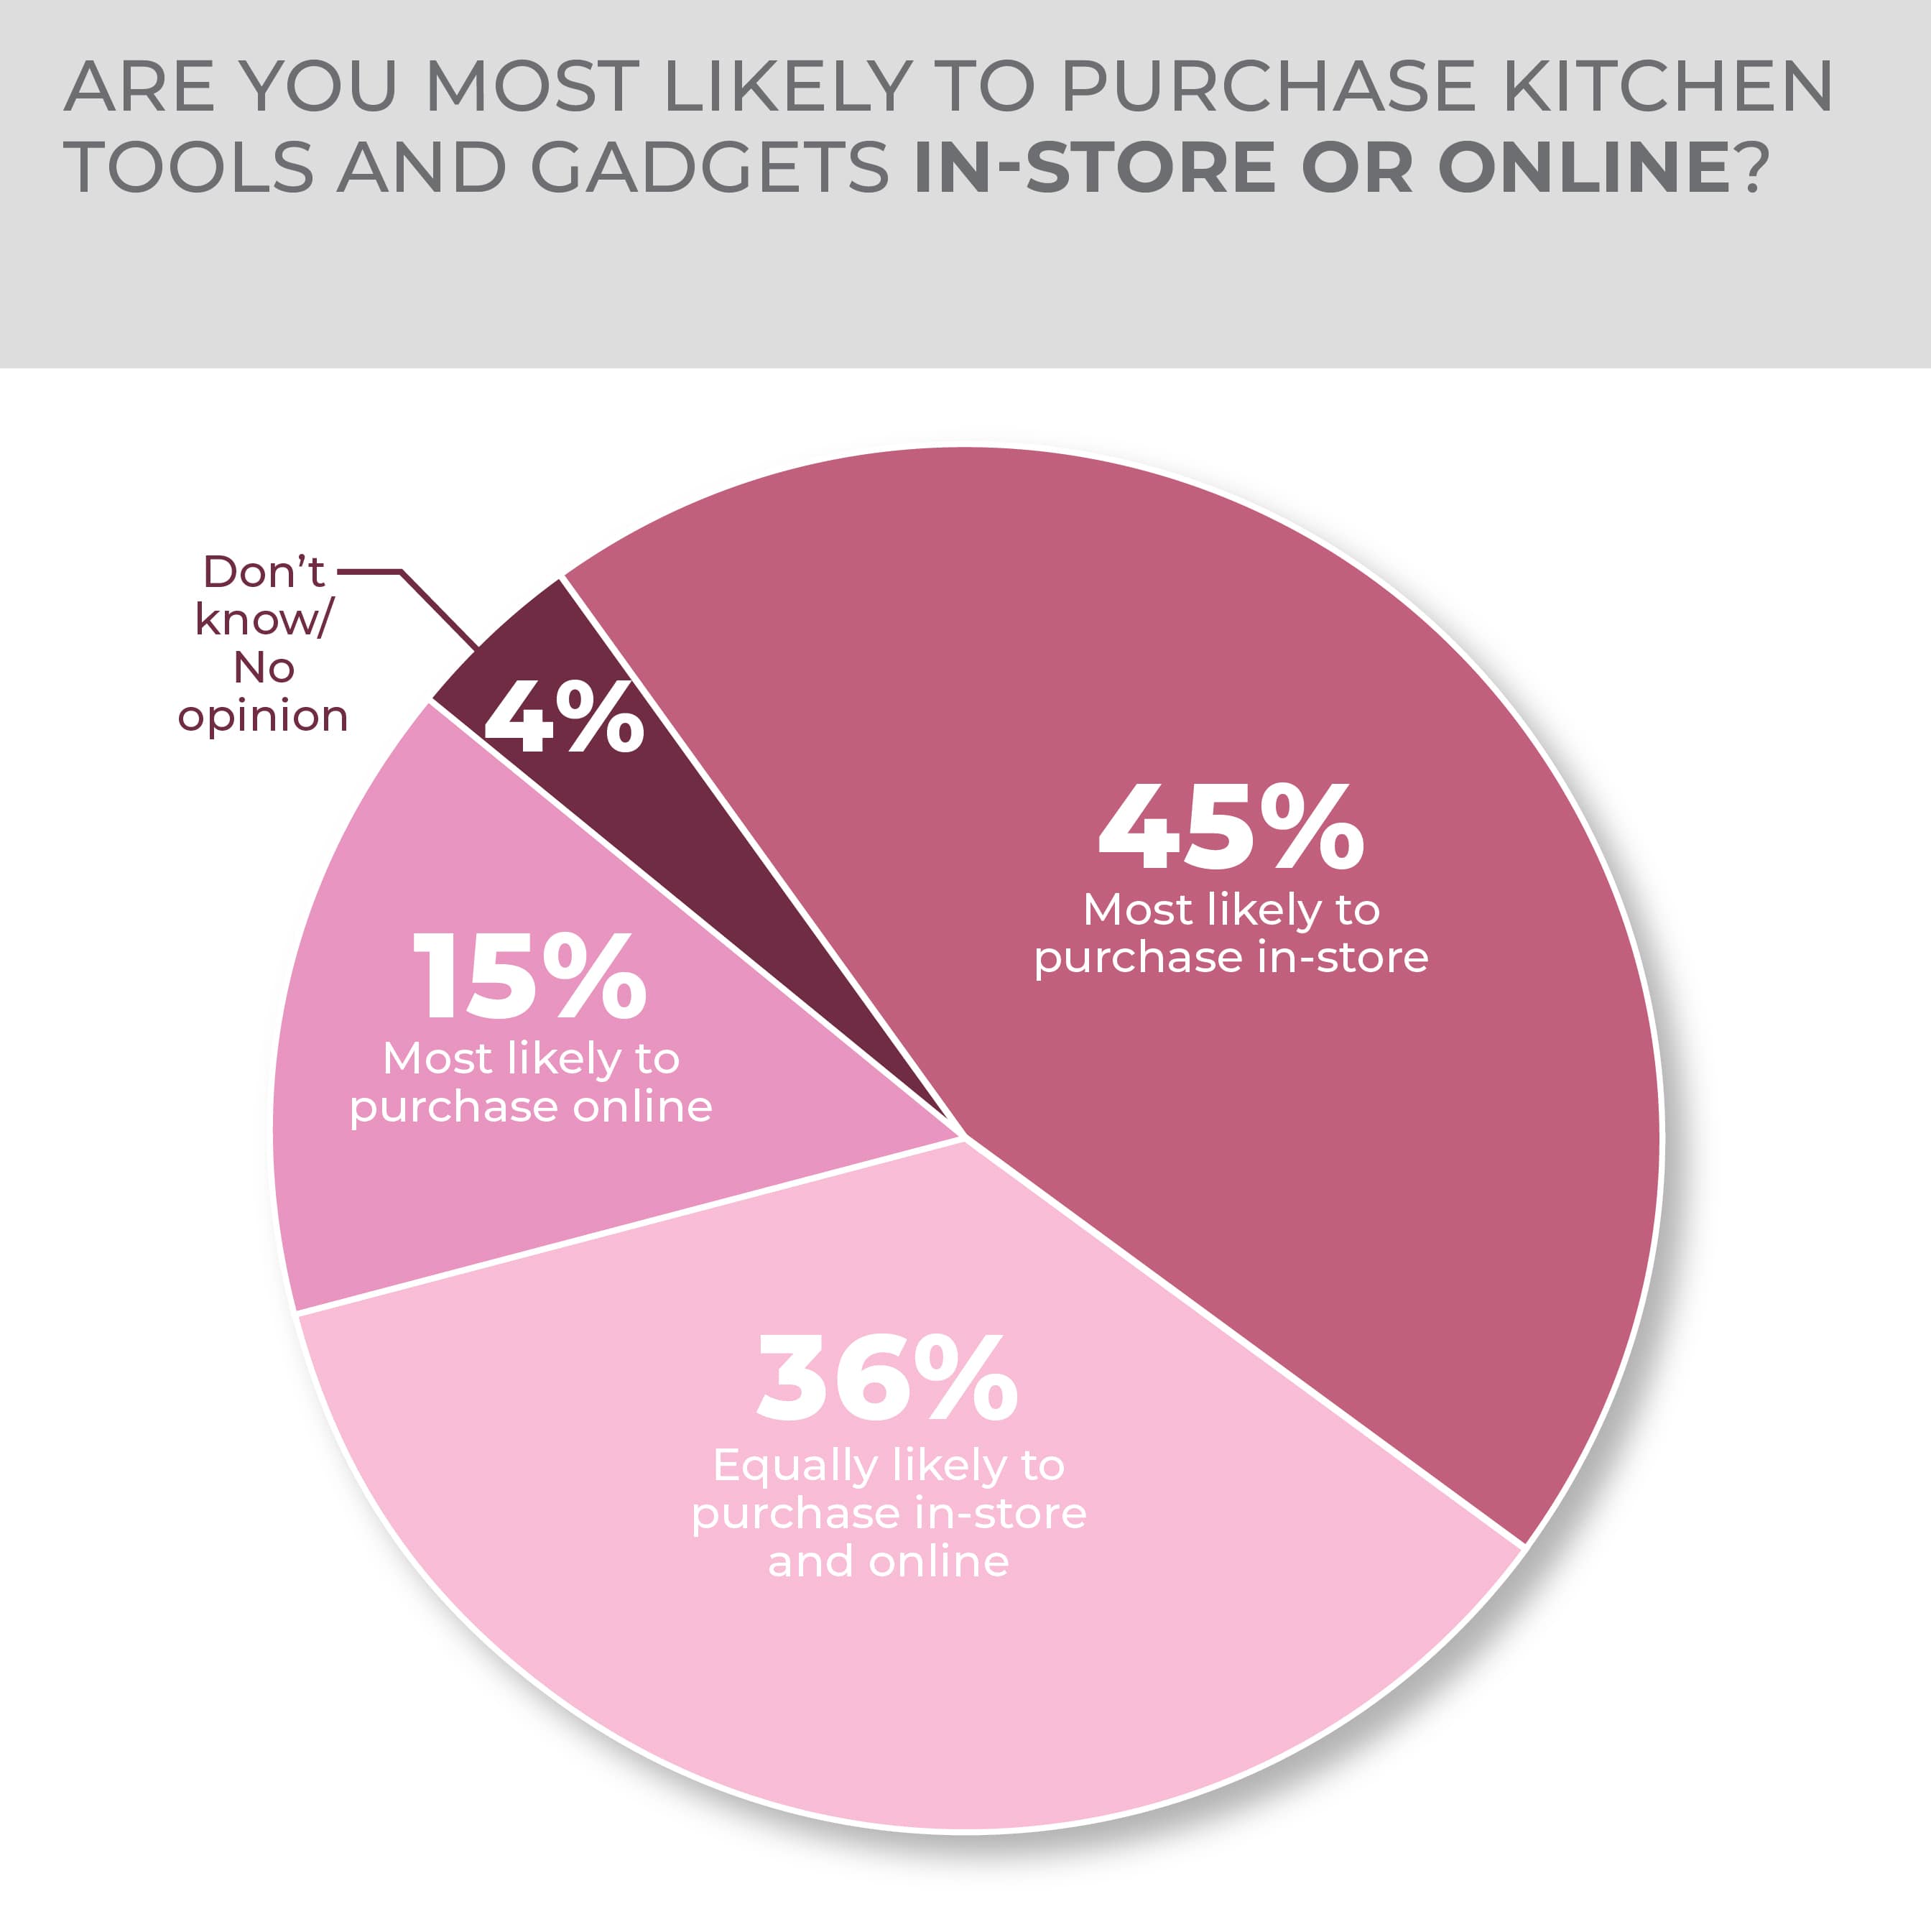
Kitchen tools and gadgets remain hands-on products with a strong likelihood of in-store purchases (45% of respondents) versus online purchases, also perhaps an indicator that relatively lower price points and the impulse potential of such products make them better suited to in-store purchasing. Generational differences on this front are evident in the higher in-store purchase likelihood by consumers 65 and older (57%).
-
- The purchase intent for kitchen tools and gadgets, like many basic housewares, reduces with respondent age, an indicator that a prime market lies in younger consumers.
- Consistent from year to year, top choices for kitchen tools and gadgets include can openers, tongs, coffee/tea accessories and measuring cups/spoons.
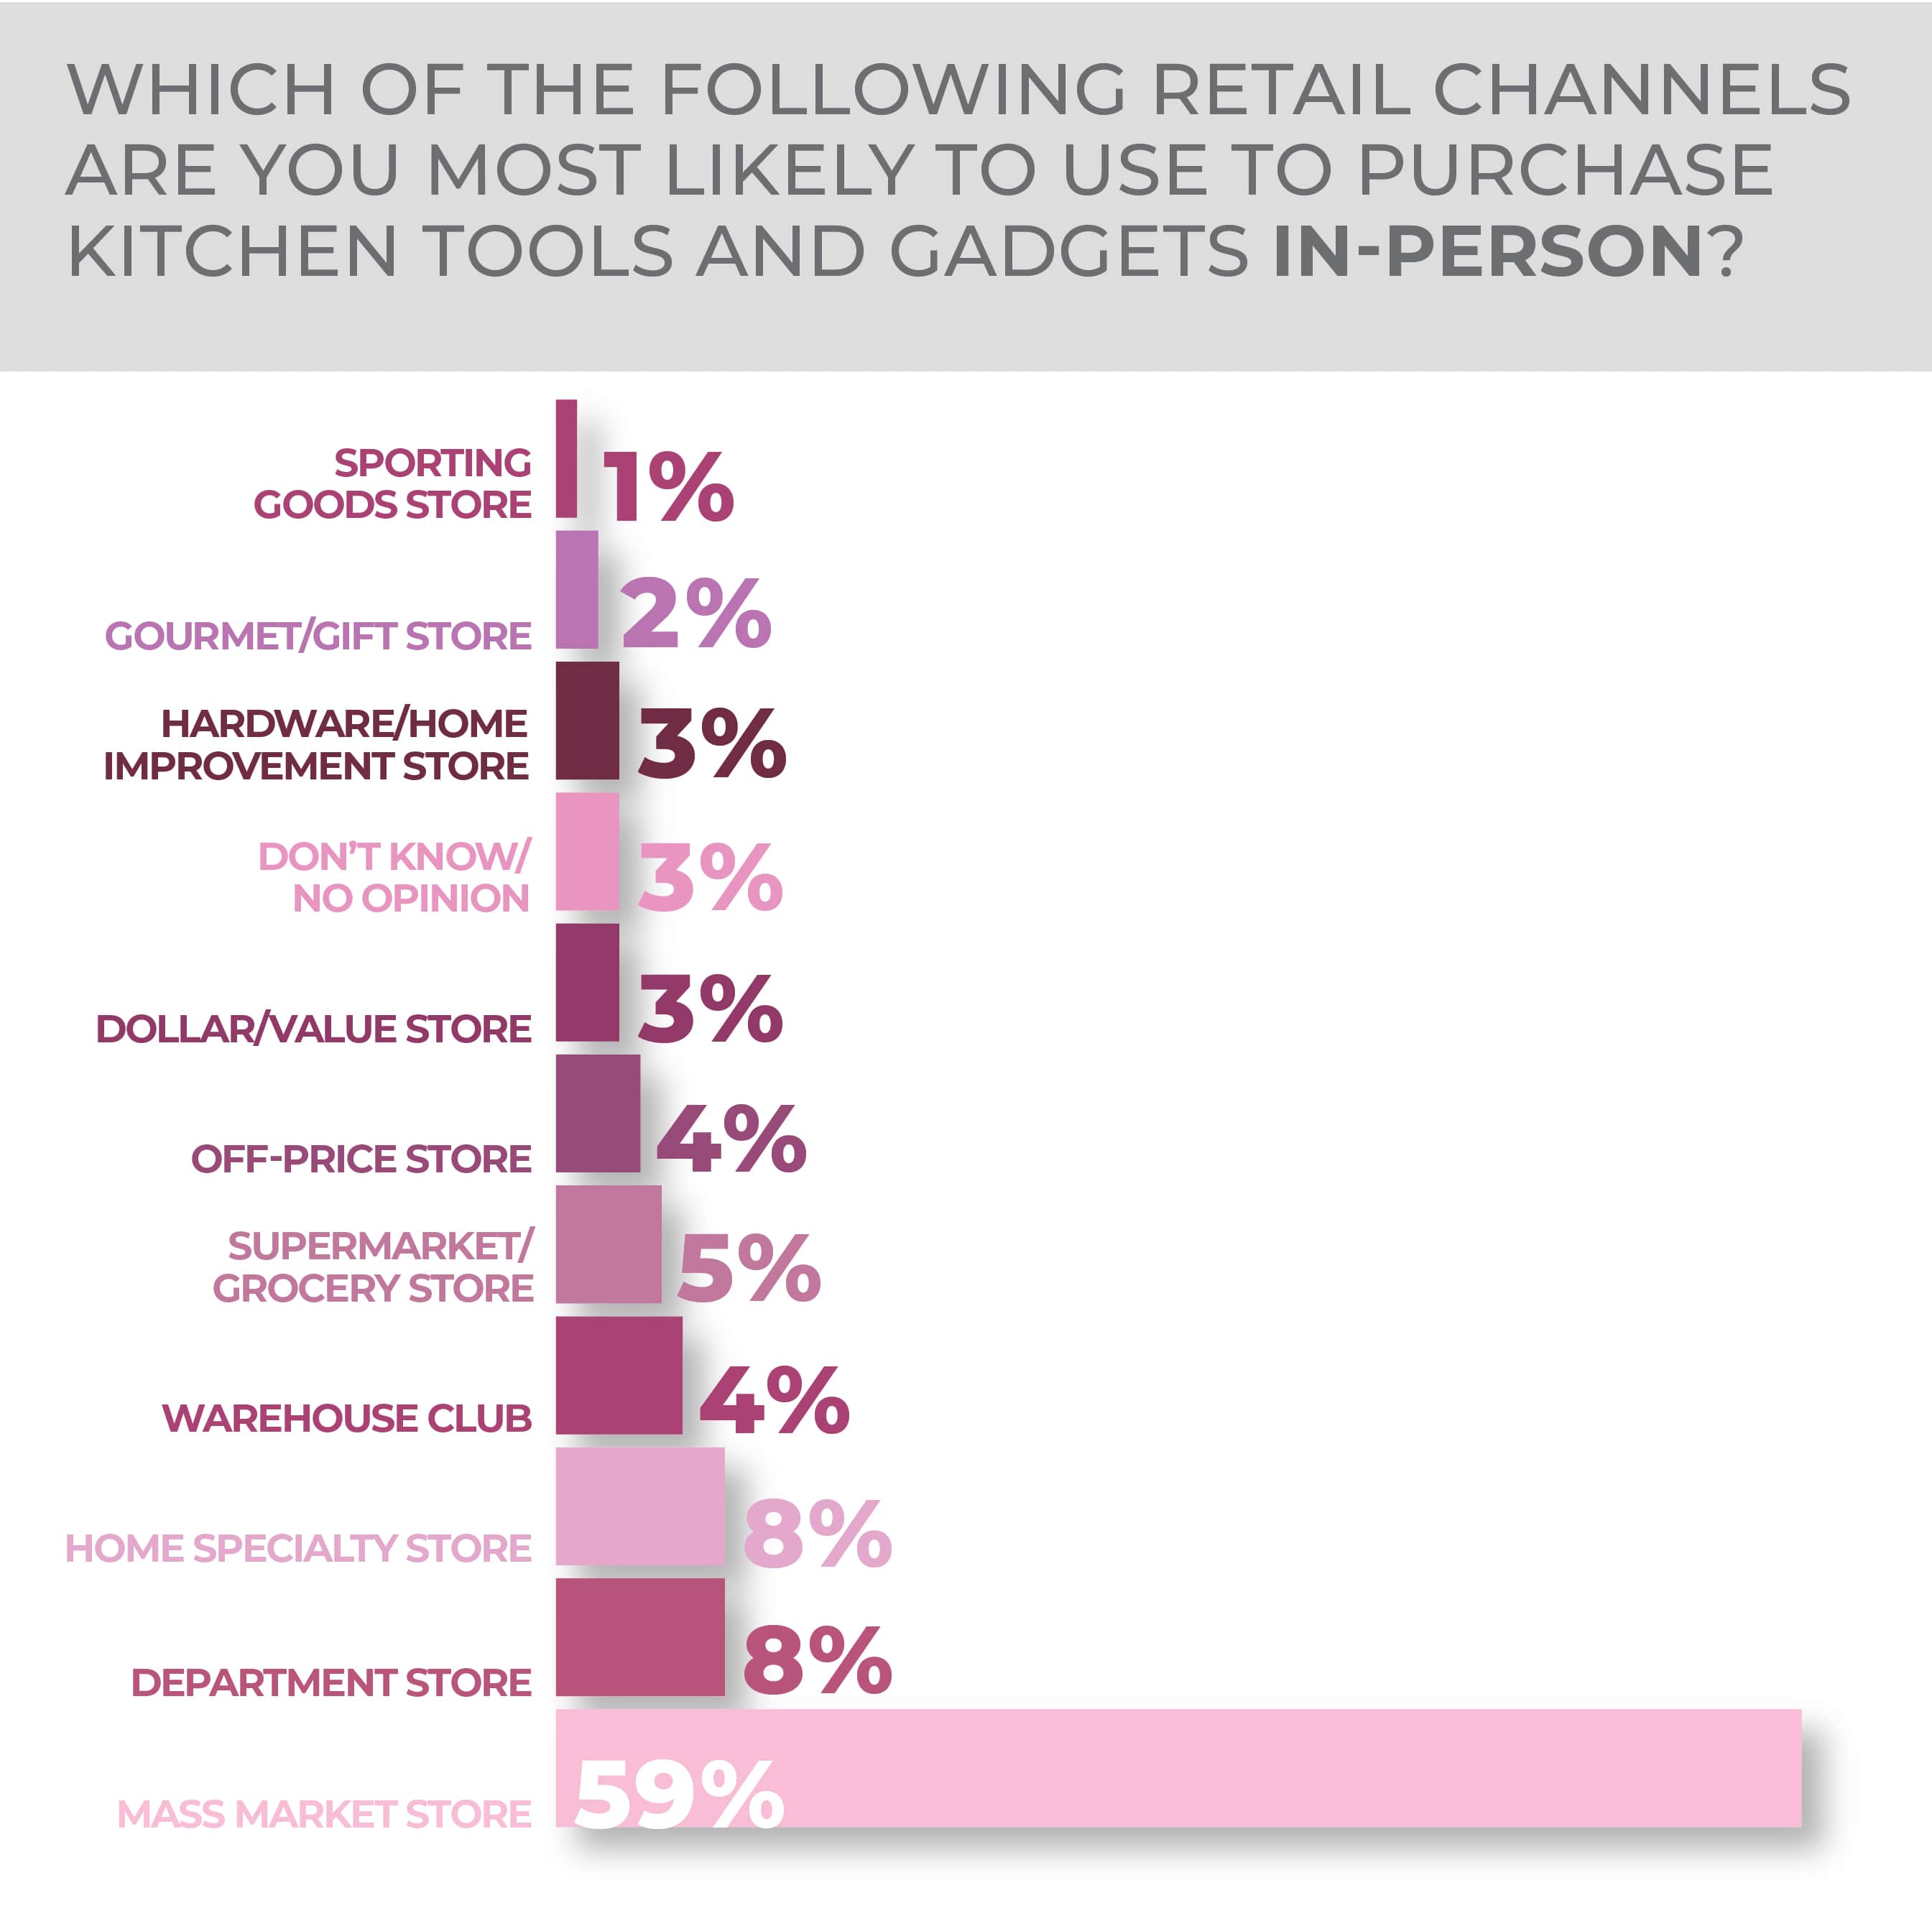
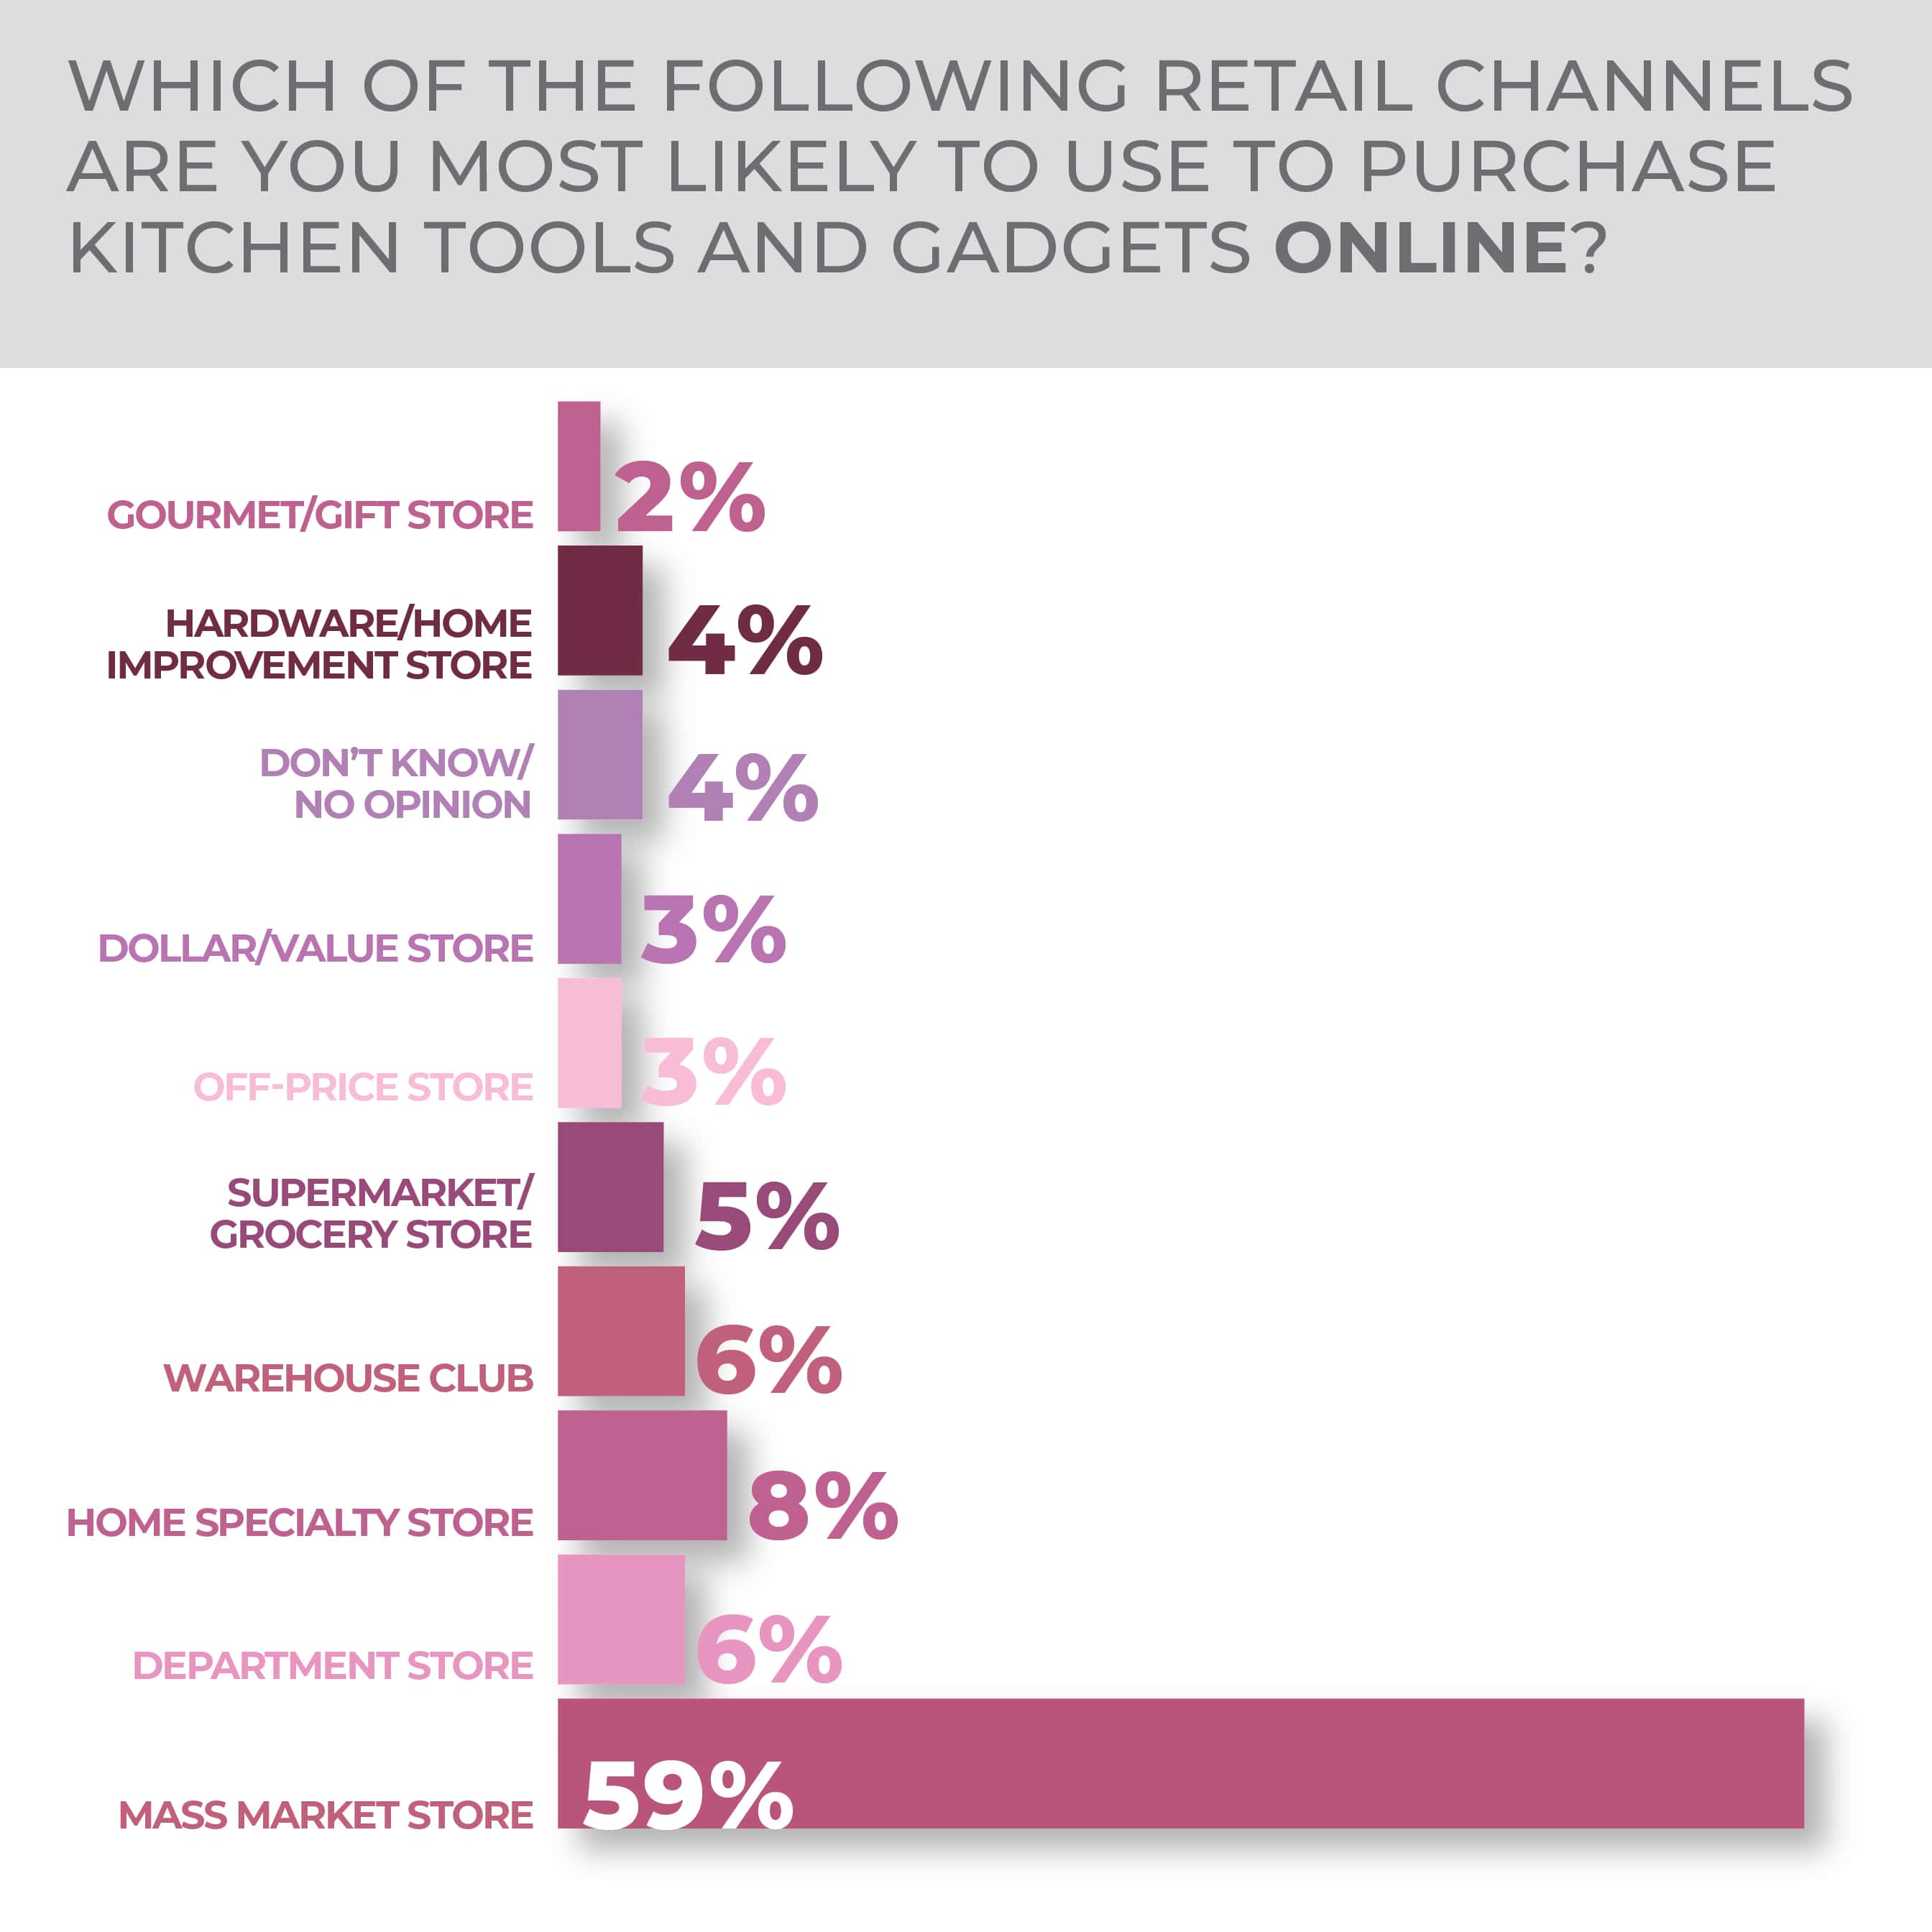
Mass market physical stores and websites are the dominant channel choices for kitchen tools and gadgets, each selected by 59% of respondents. Physical department stores and home specialty stores each were picked as the preferred channels by respondents.
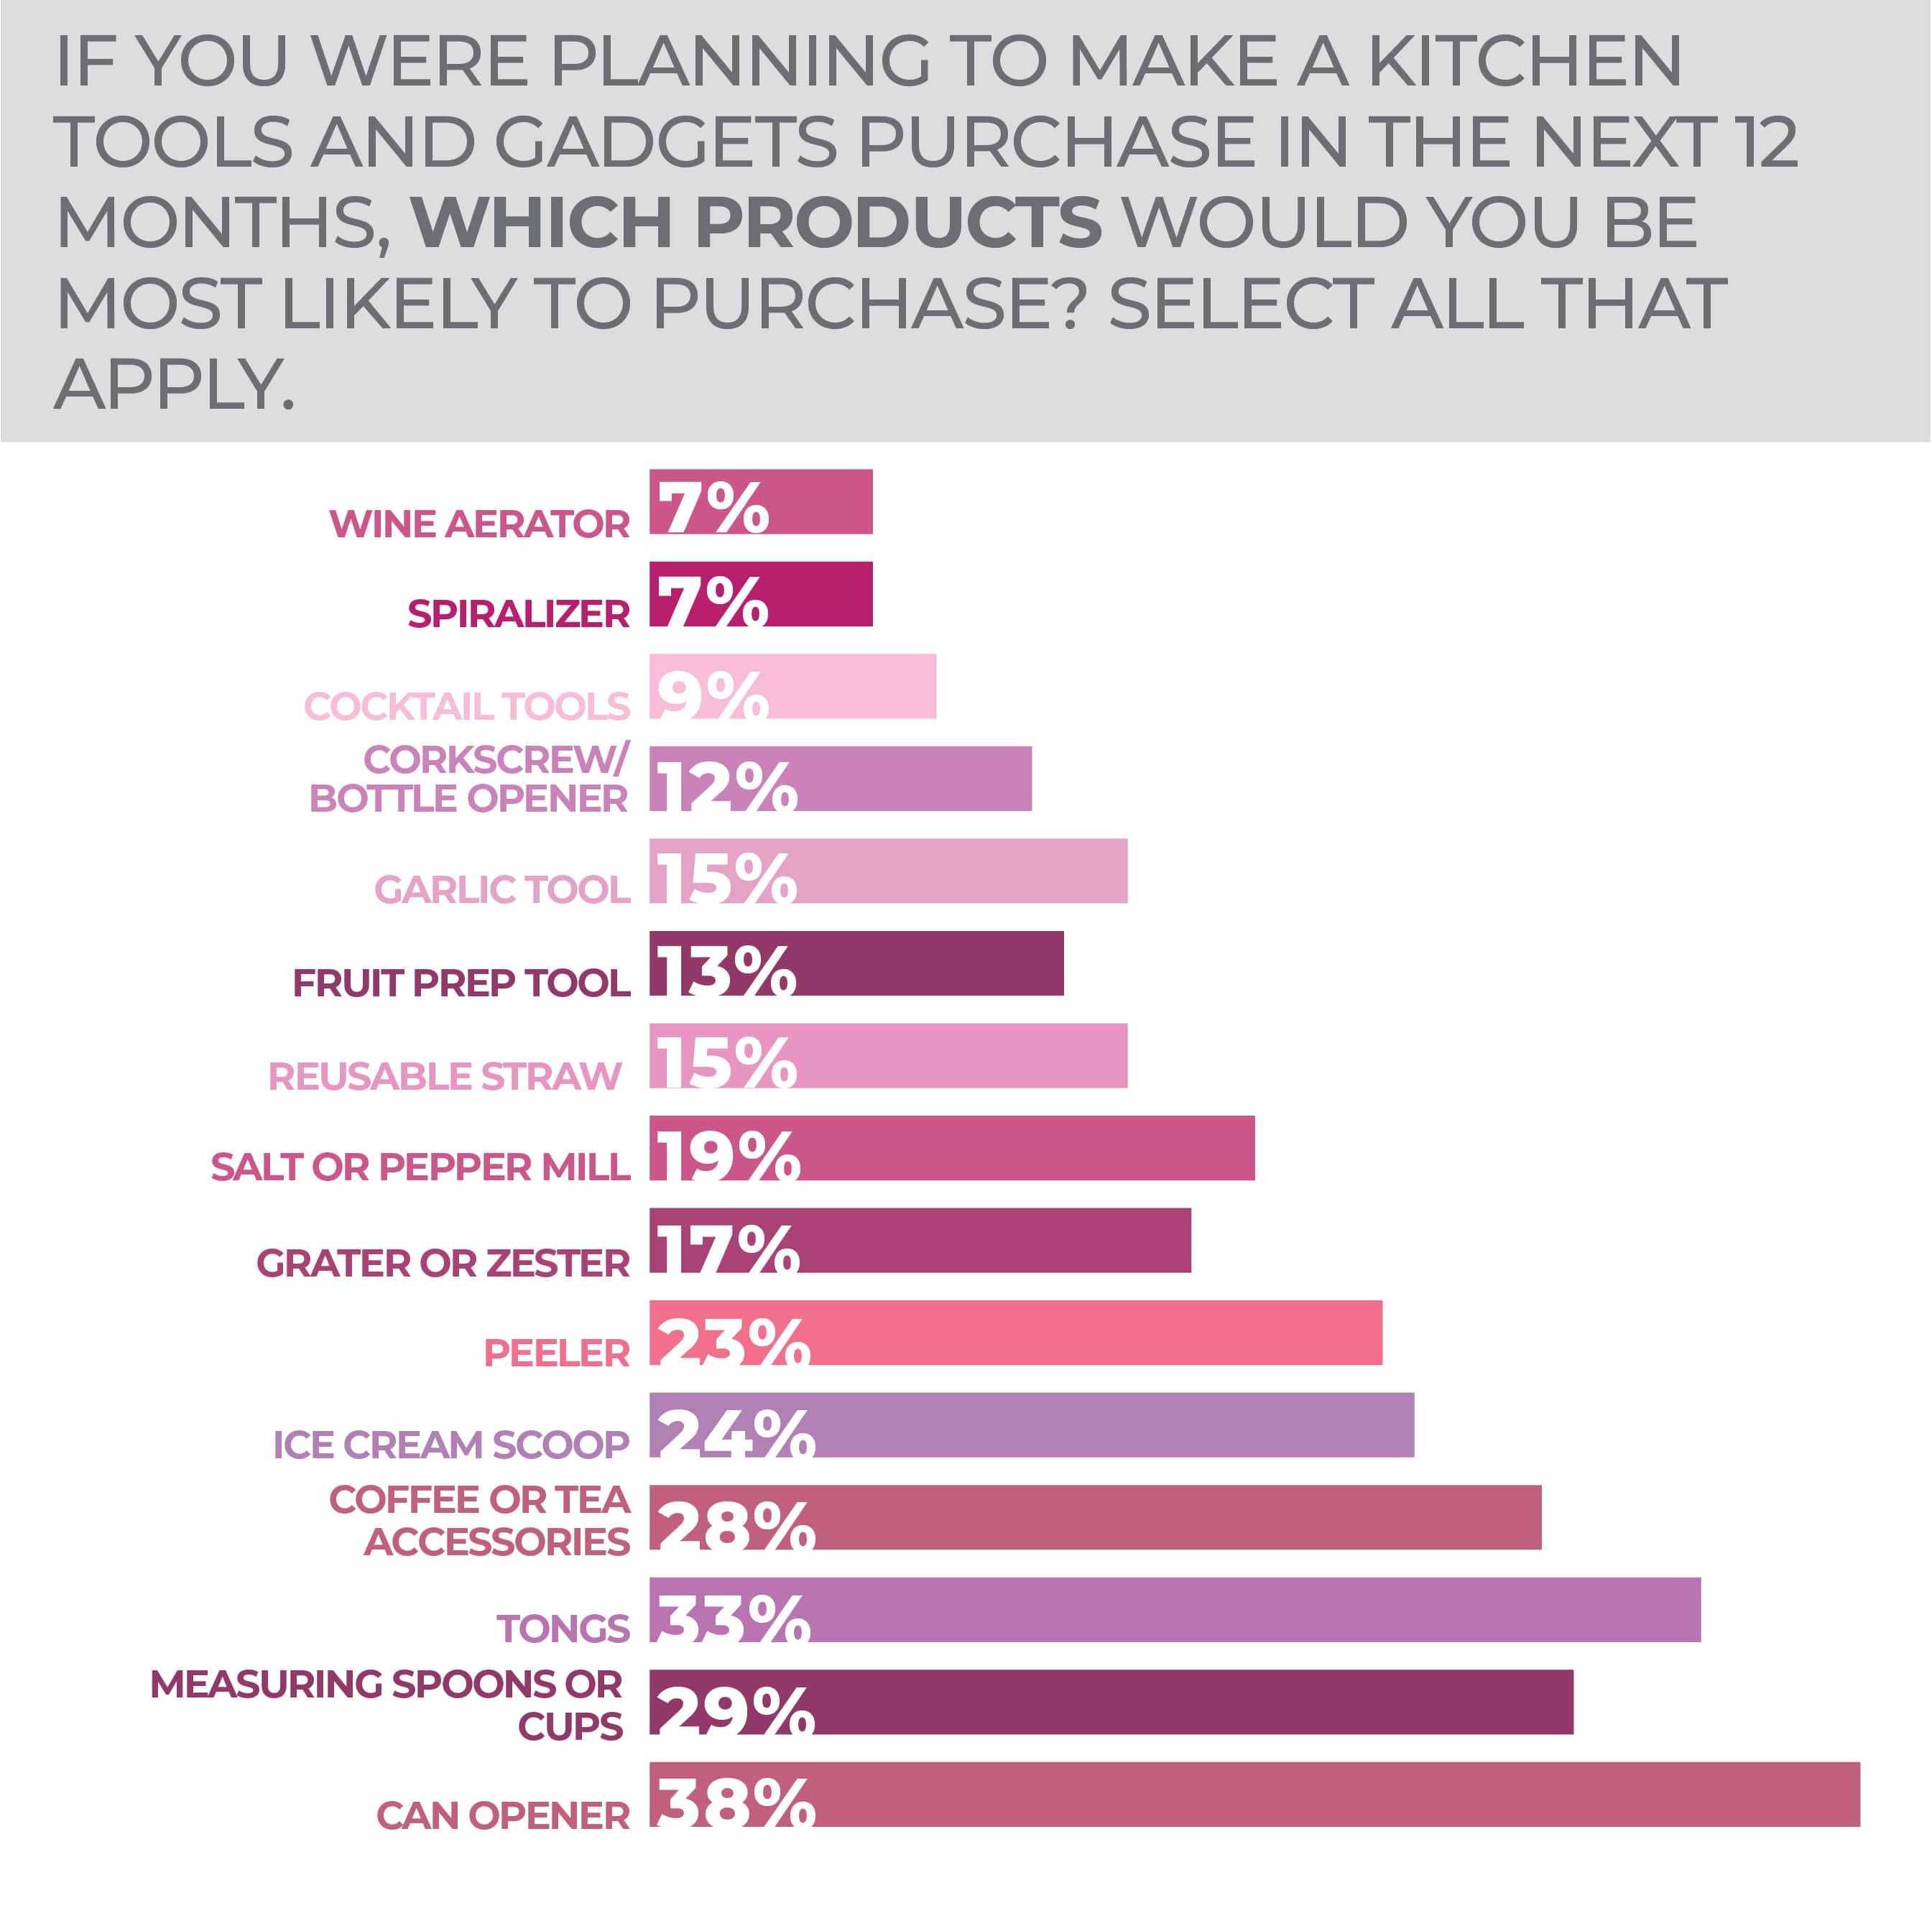
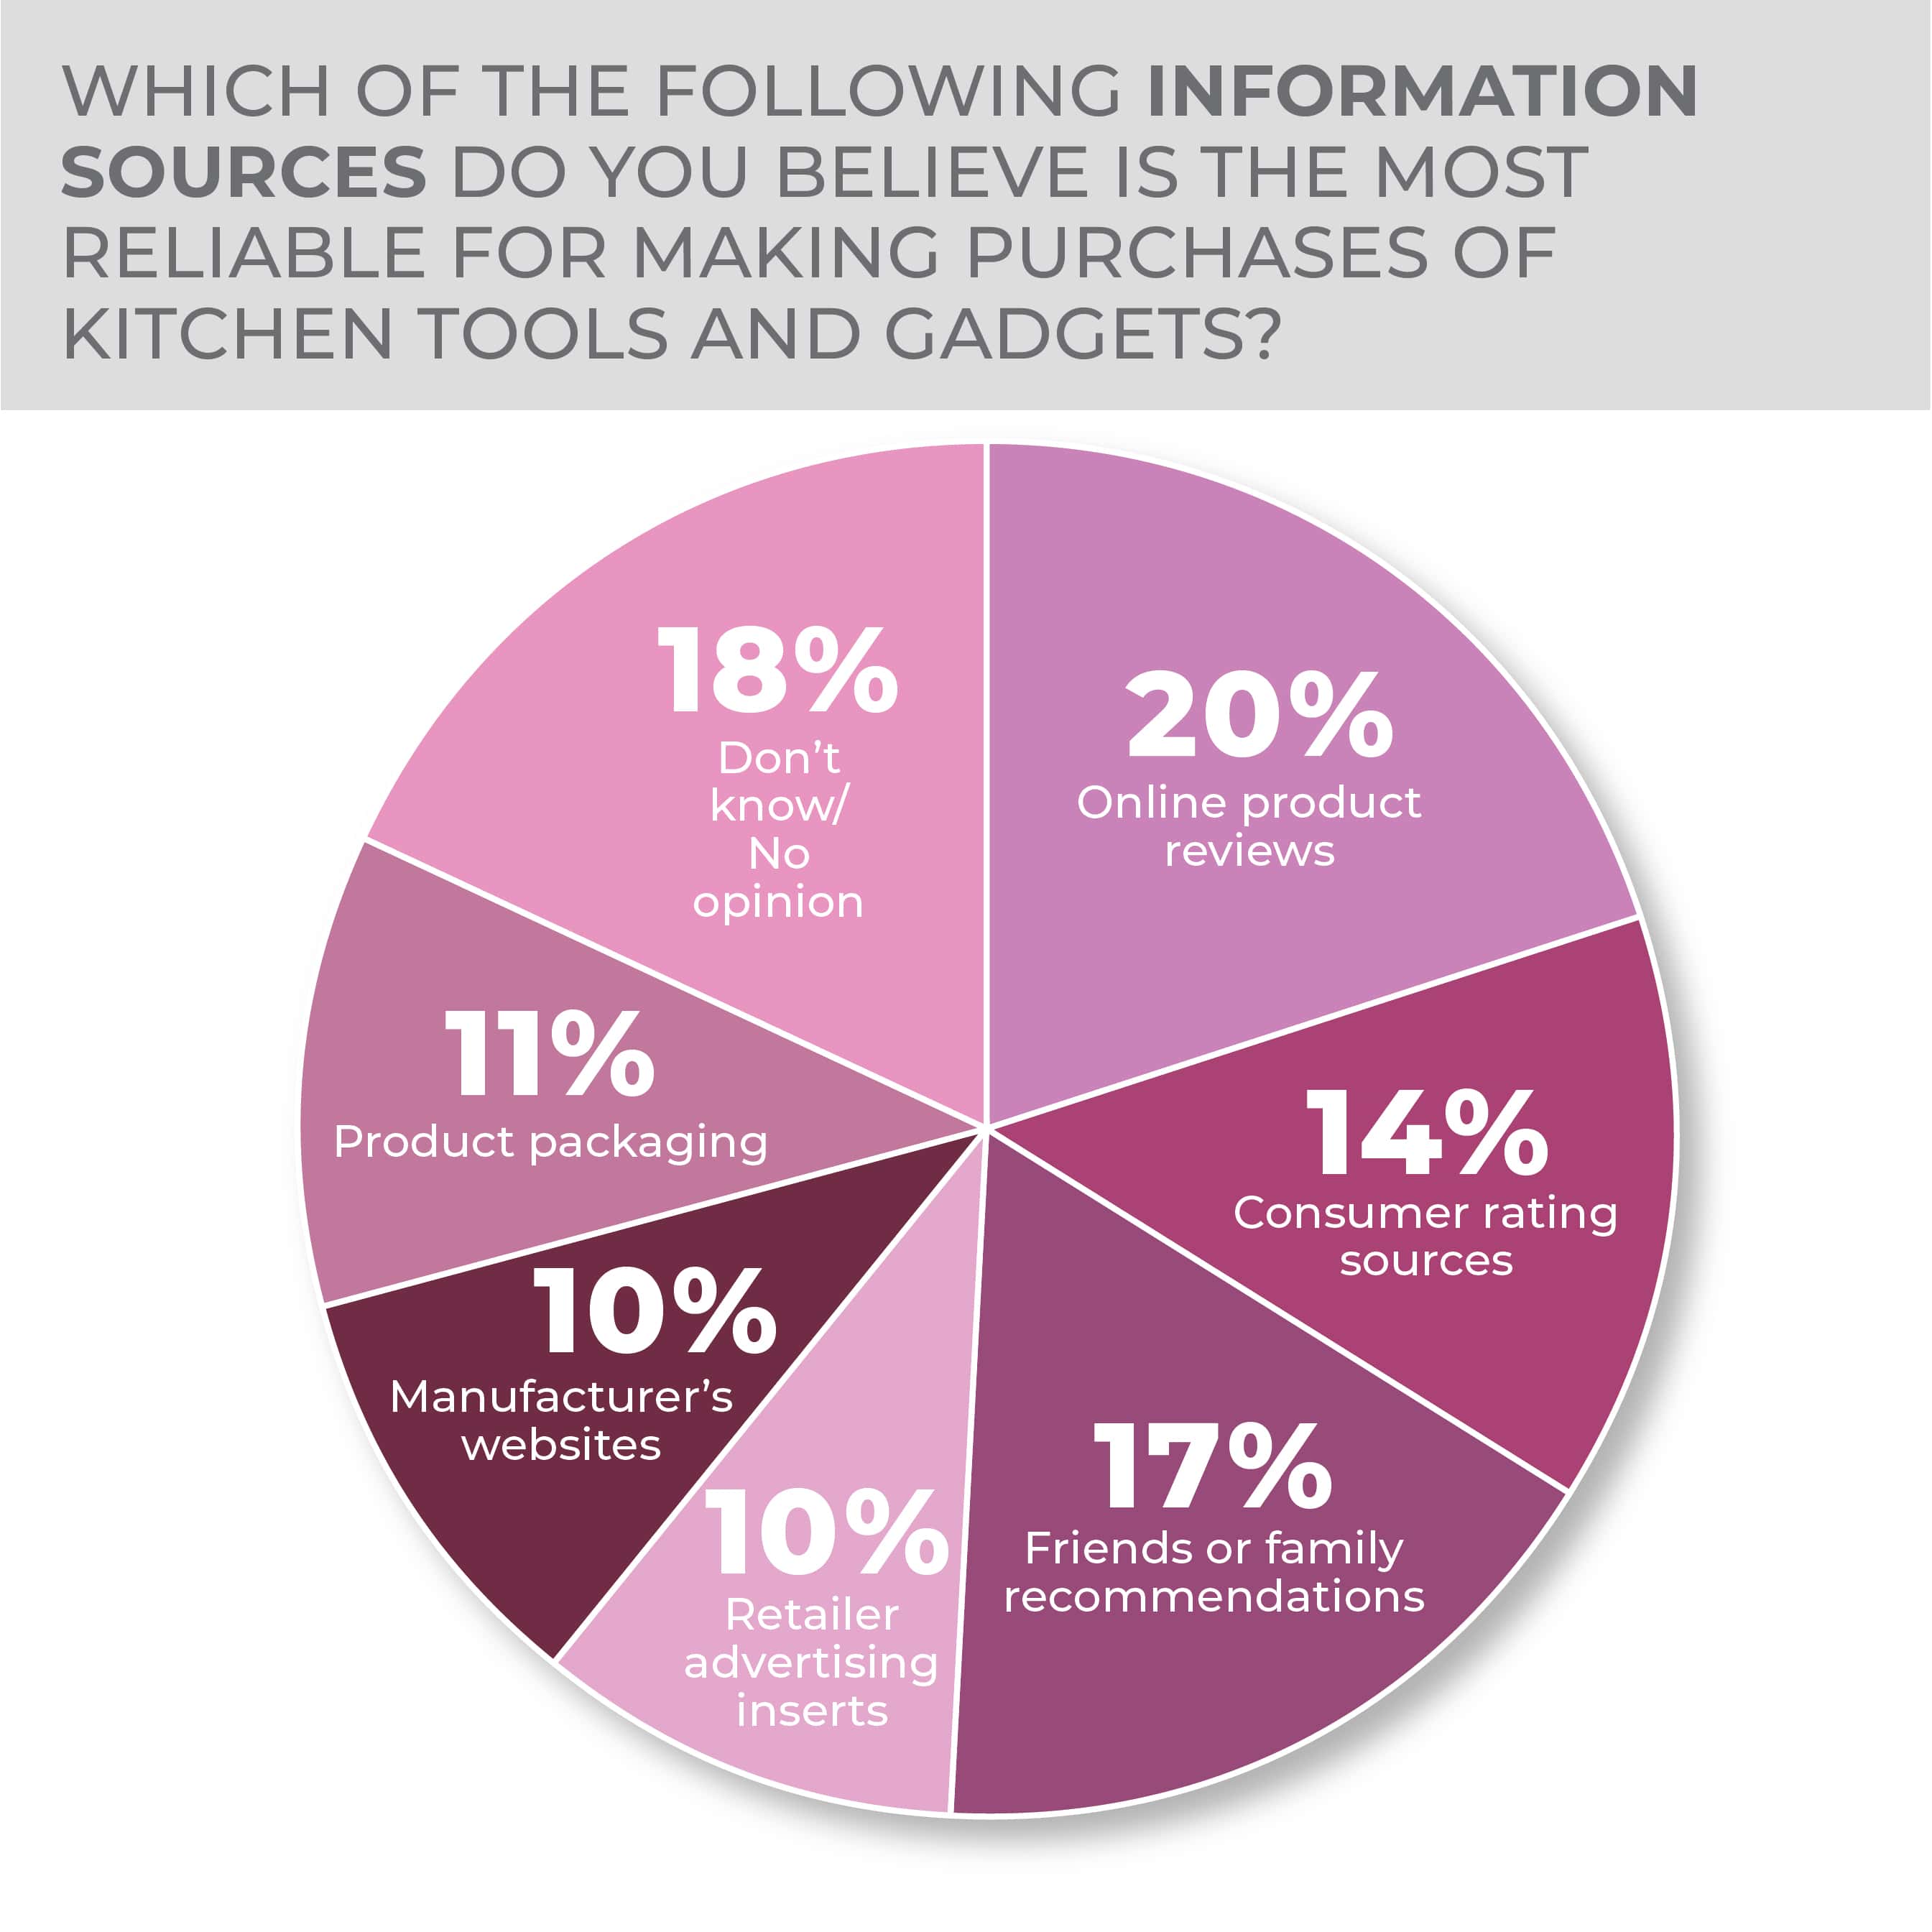
Demands for kitchen tools and gadgets are widespread across a diverse range of specific products. Consistent from year to year, top choices include can openers (38%), tongs (33%), coffee/tea accessories (28%) and measuring cups/spoons (29%). These selections underscore strong trends that have surged in recent years, such as craft coffee prep and baking, with unyielding demand for tools for everyday basic kitchen prep and serving needs.
Some notable generational contrasts were revealed. For example, reusable straws, with their eco-friendly overtones, were picked by 23% of consumers in the 18-34 age group, compared to 13% in the 45-64 group and 8% in the 65-plus group. Younger consumers also seem ripe for new cocktail tools as they ramp up their home entertaining activity: 17% of Gen Zers selected such tools, compared to 3% of Boomers.
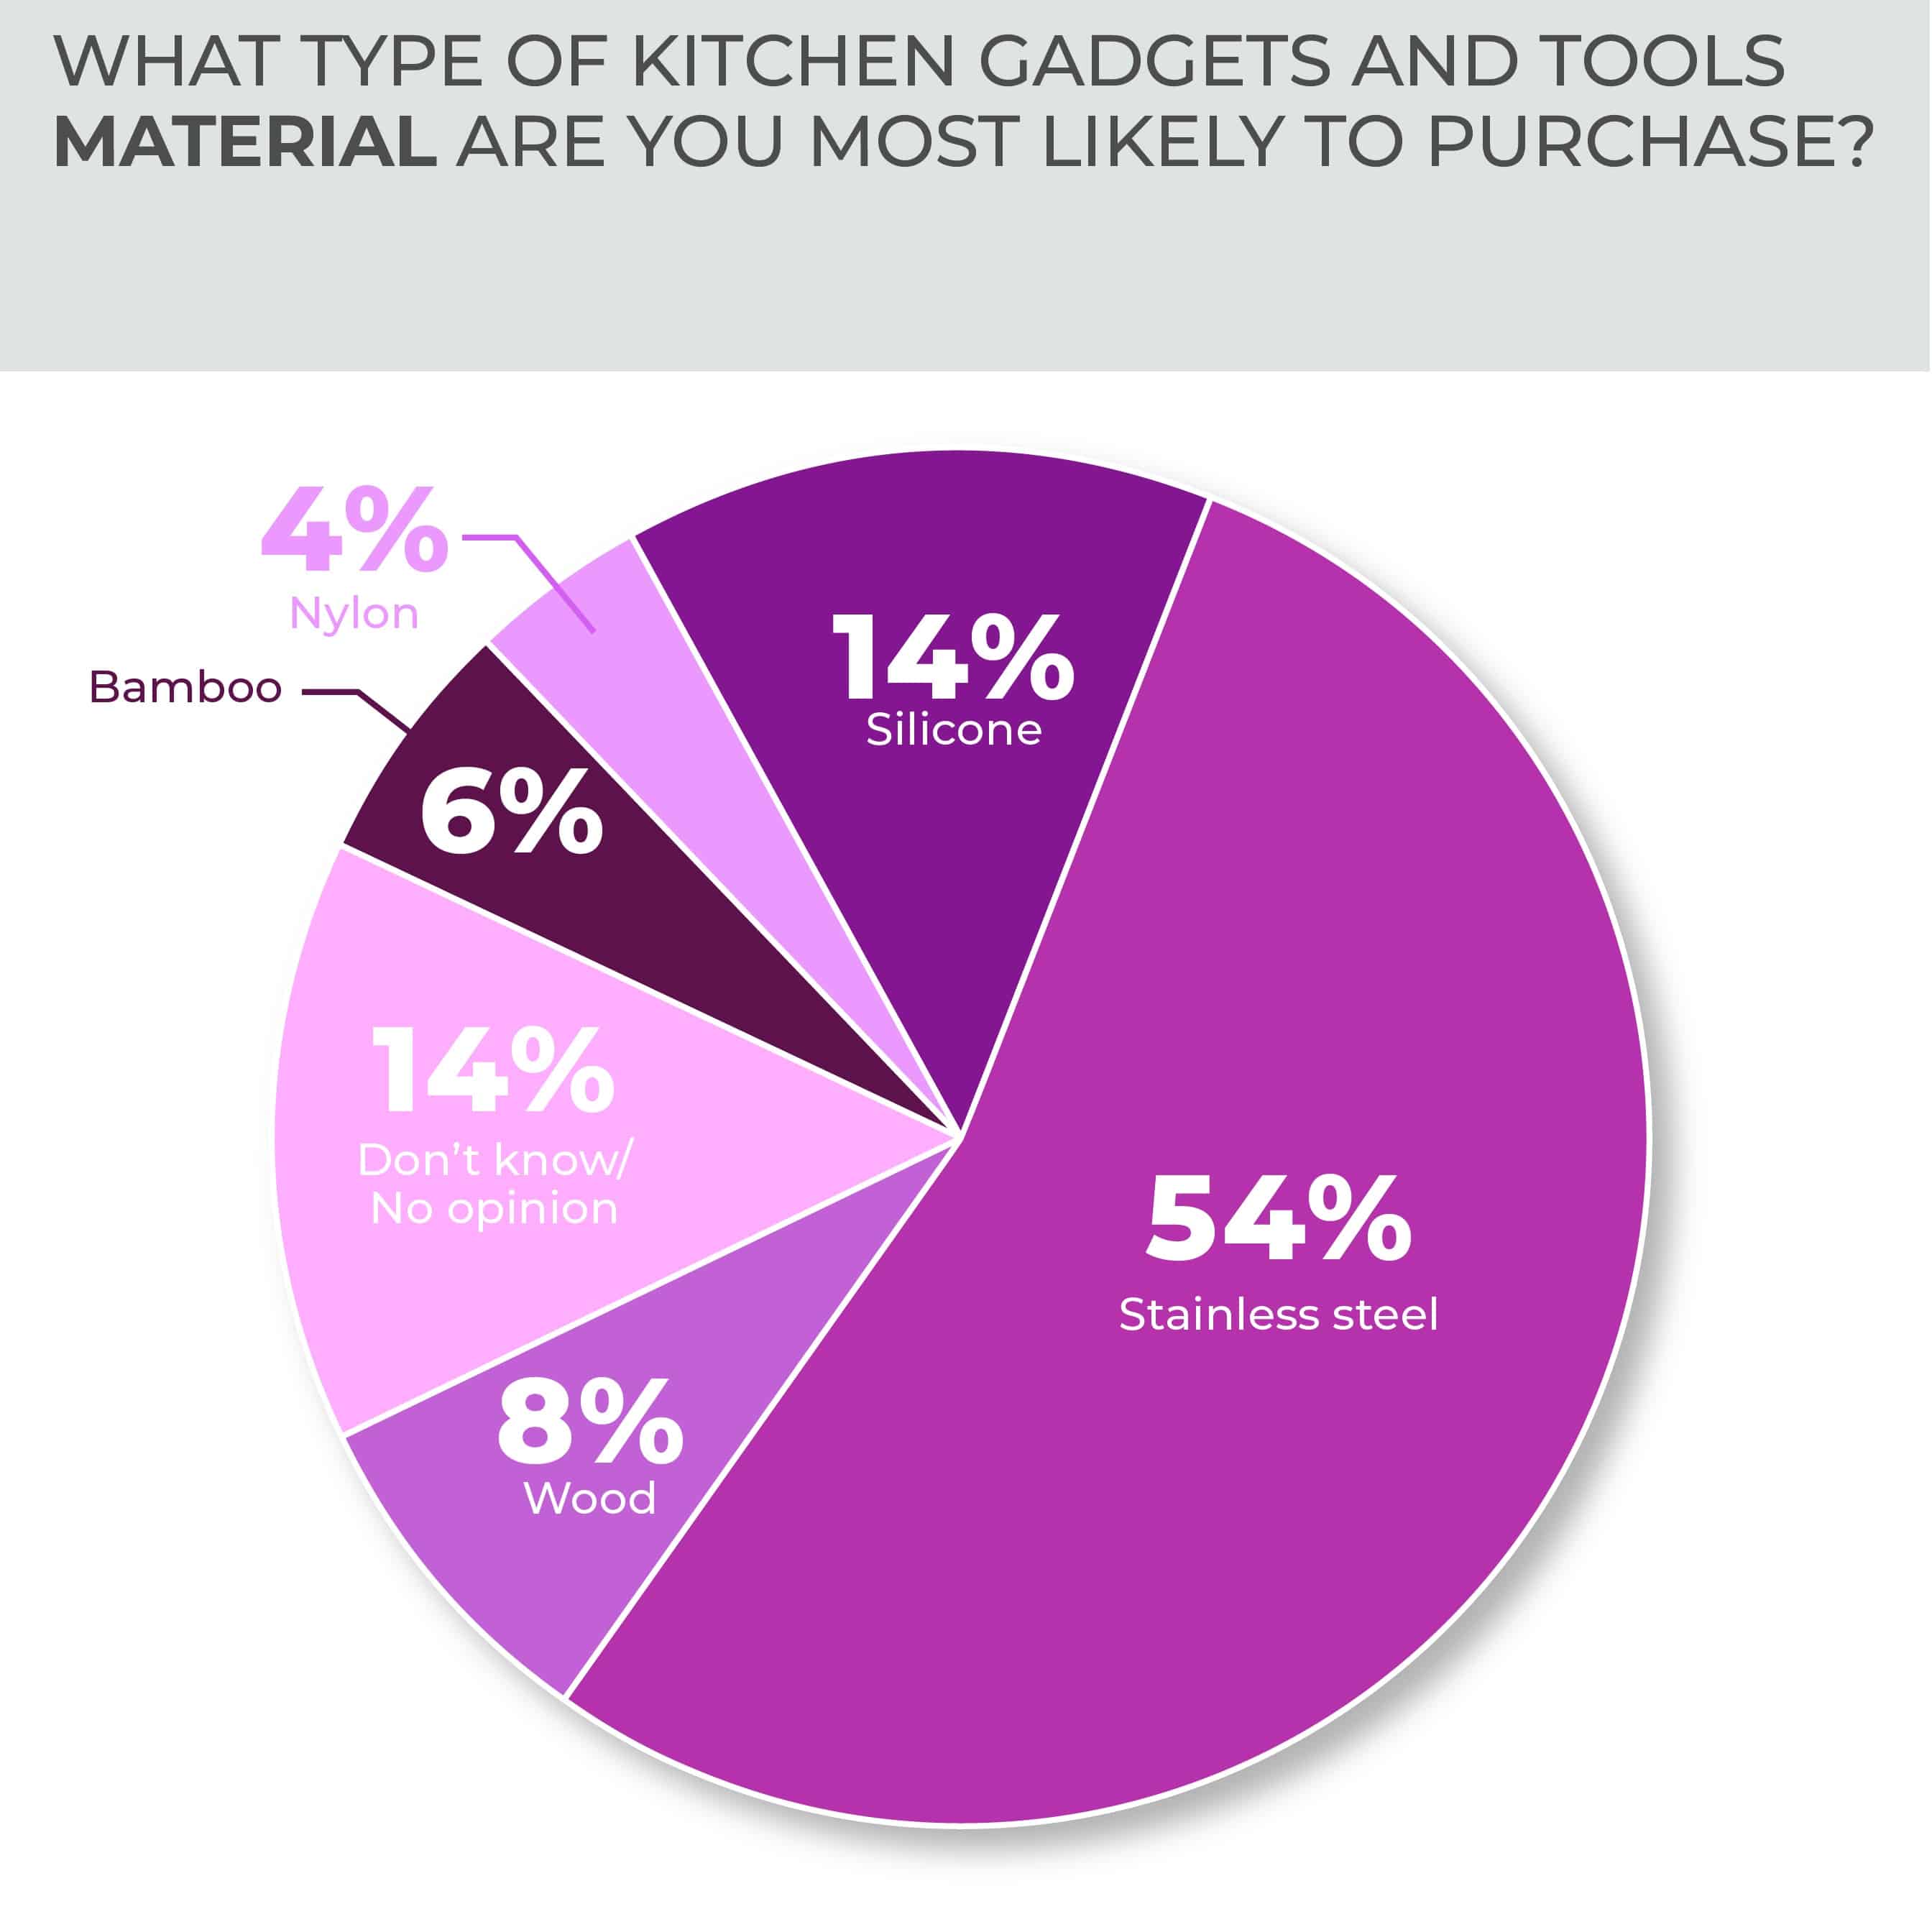
It is also revealing that stainless steel construction (perhaps seen as more durable and easier to clean) is by far the dominant preference (54%) over silicone (14%), despite the latter’s colorful and specialized expansion among retail.
More Kitchen Tools & Gadgets Findings:
Personal Care & Wellness
Wellness is a much-discussed issue today and while it has a strong health care component, the idea has taken on broader dimensions including bolstering how people feel about themselves. Personal care figures in too and the evolution into self-care suggests a melding into the wellness context.
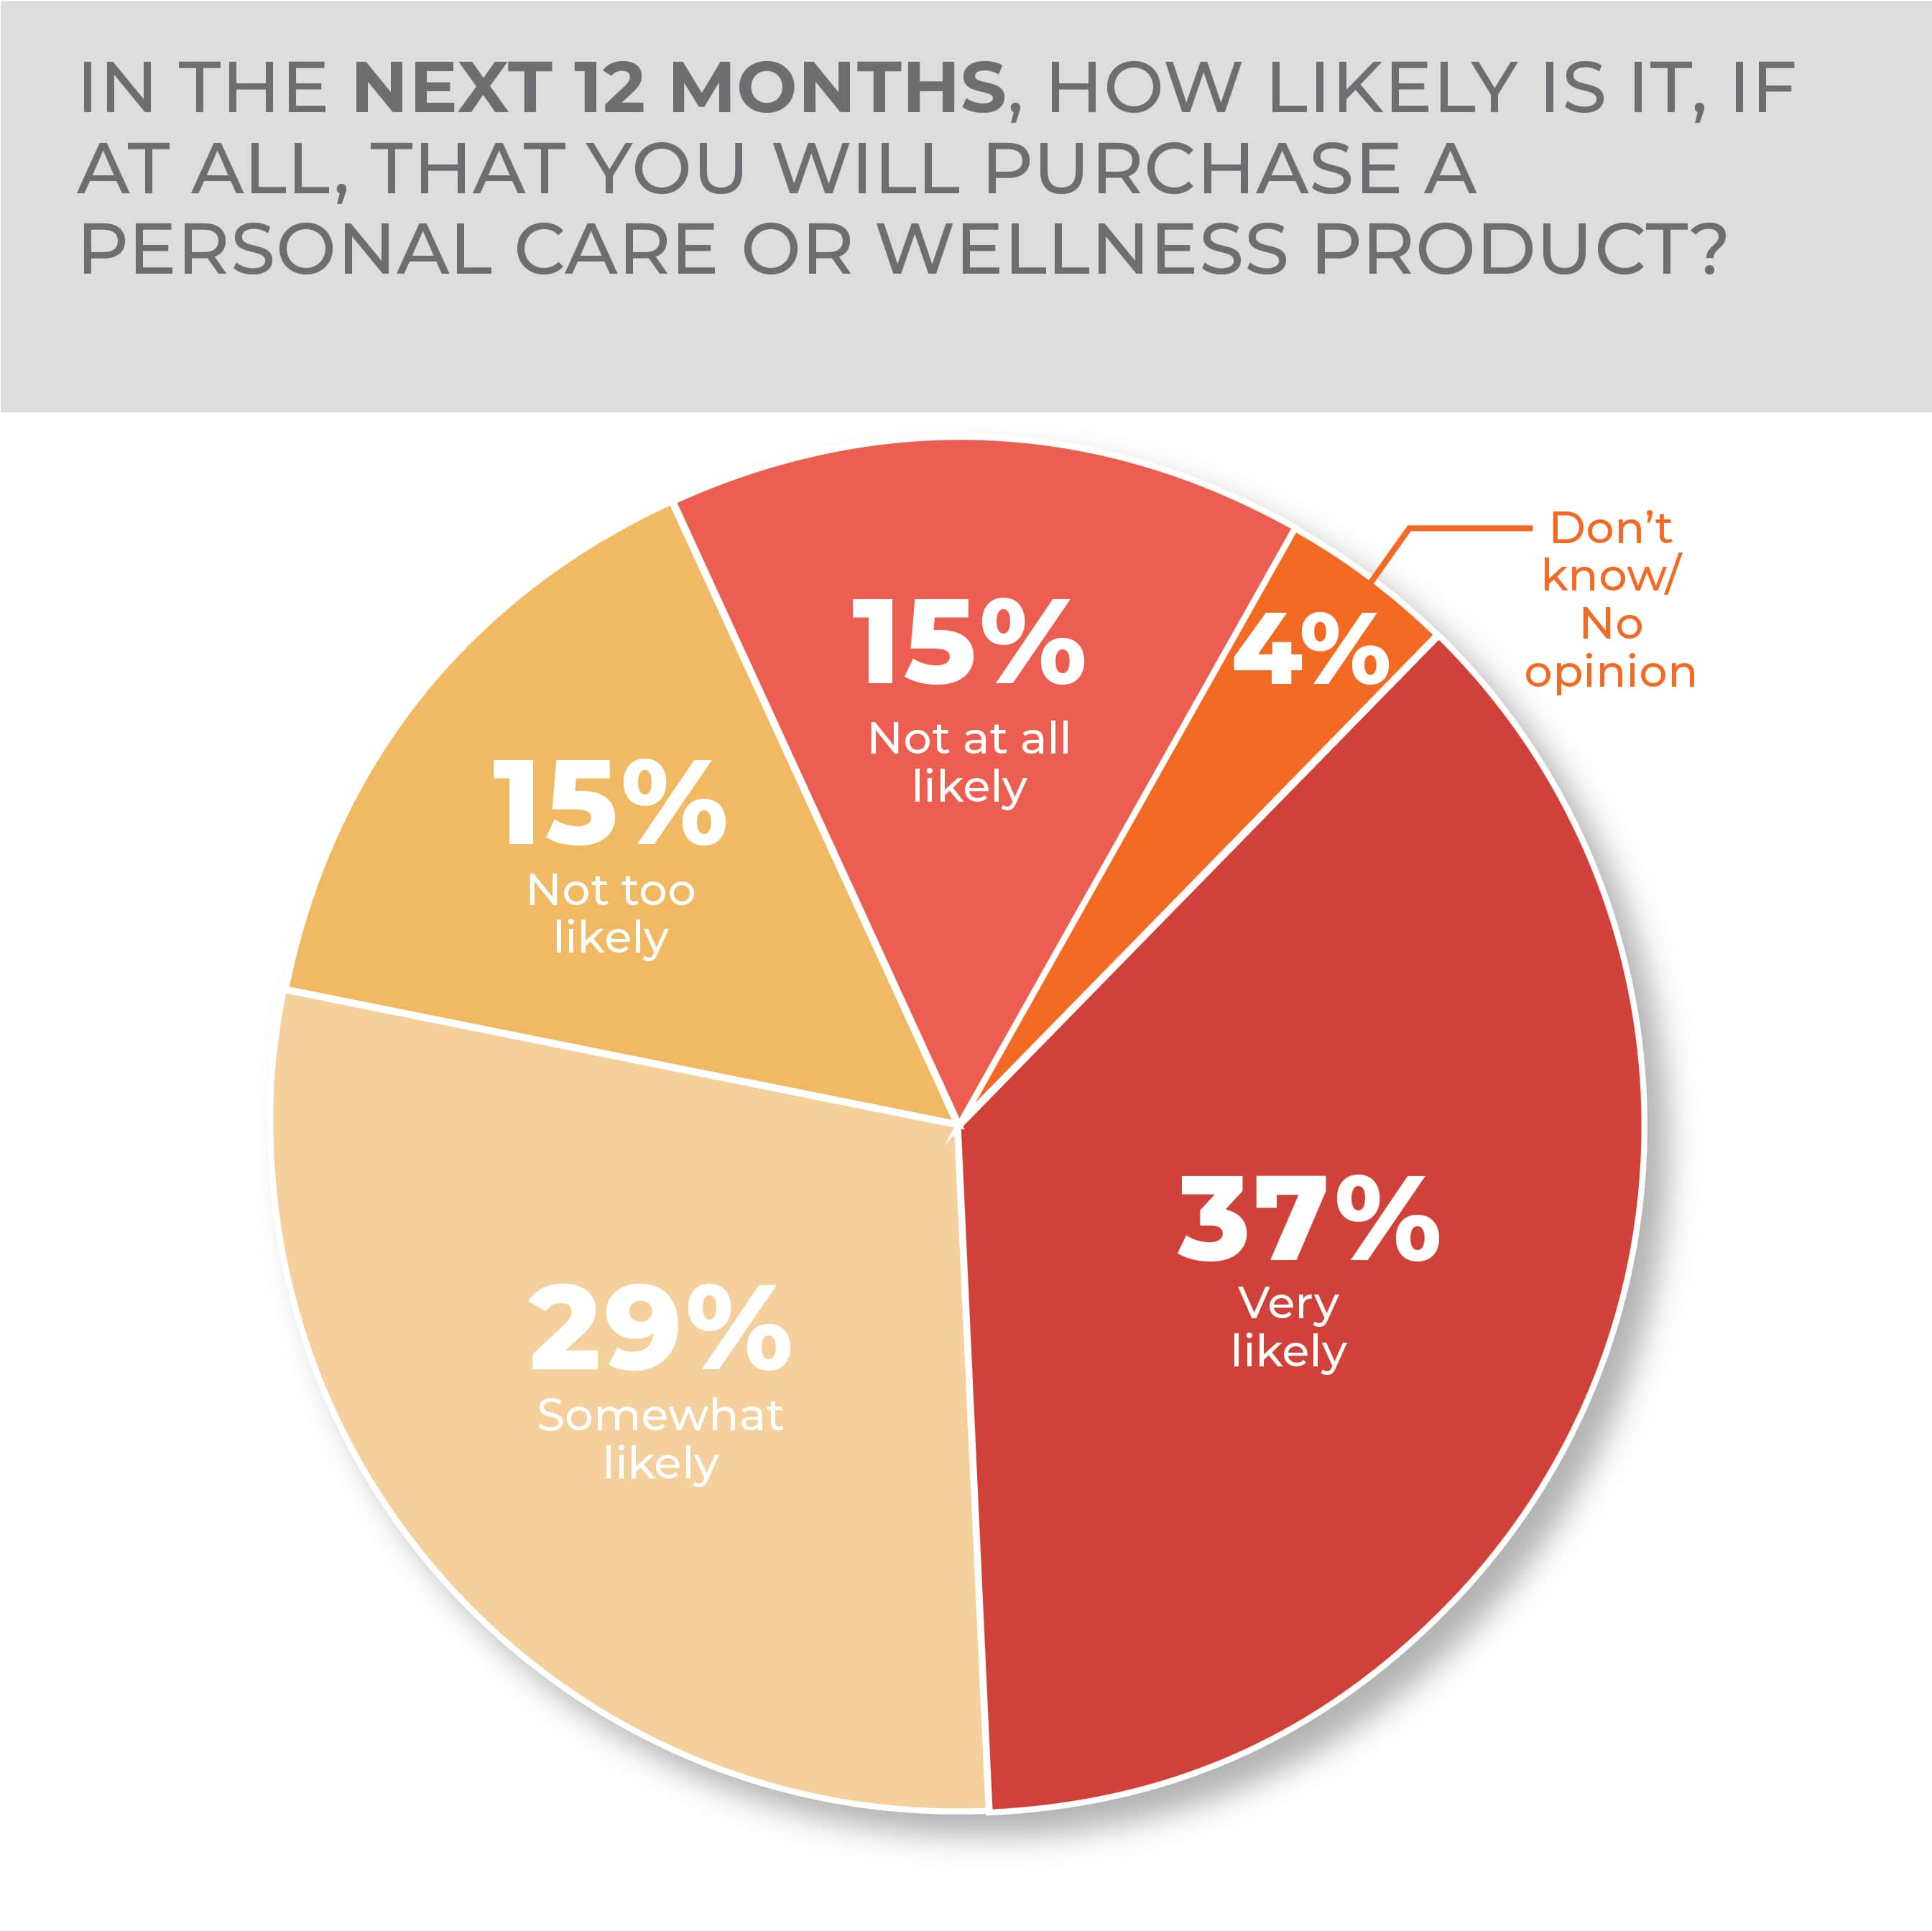
With that social backdrop, it’s hardly surprising that the personal care category has among the highest purchase intentions in the HomePage News 2023 Consumer Outlook Survey. Of survey respondents, 37% said they were very likely to purchase personal care products ranging from bath scales to hair styling tools, and 29% said they were somewhat likely to do so. Those numbers are consistent with the survey in 2022, demonstrating an ongoing consumer interest in personal care given that about two-thirds of respondents considered a purchase two years in a row.
-
- A third of consumers would buy a personal care item to update an already owned product or on impulse in the year ahead.
- An electric toothbrush/plaque remover became the most popular potential health care purchase.
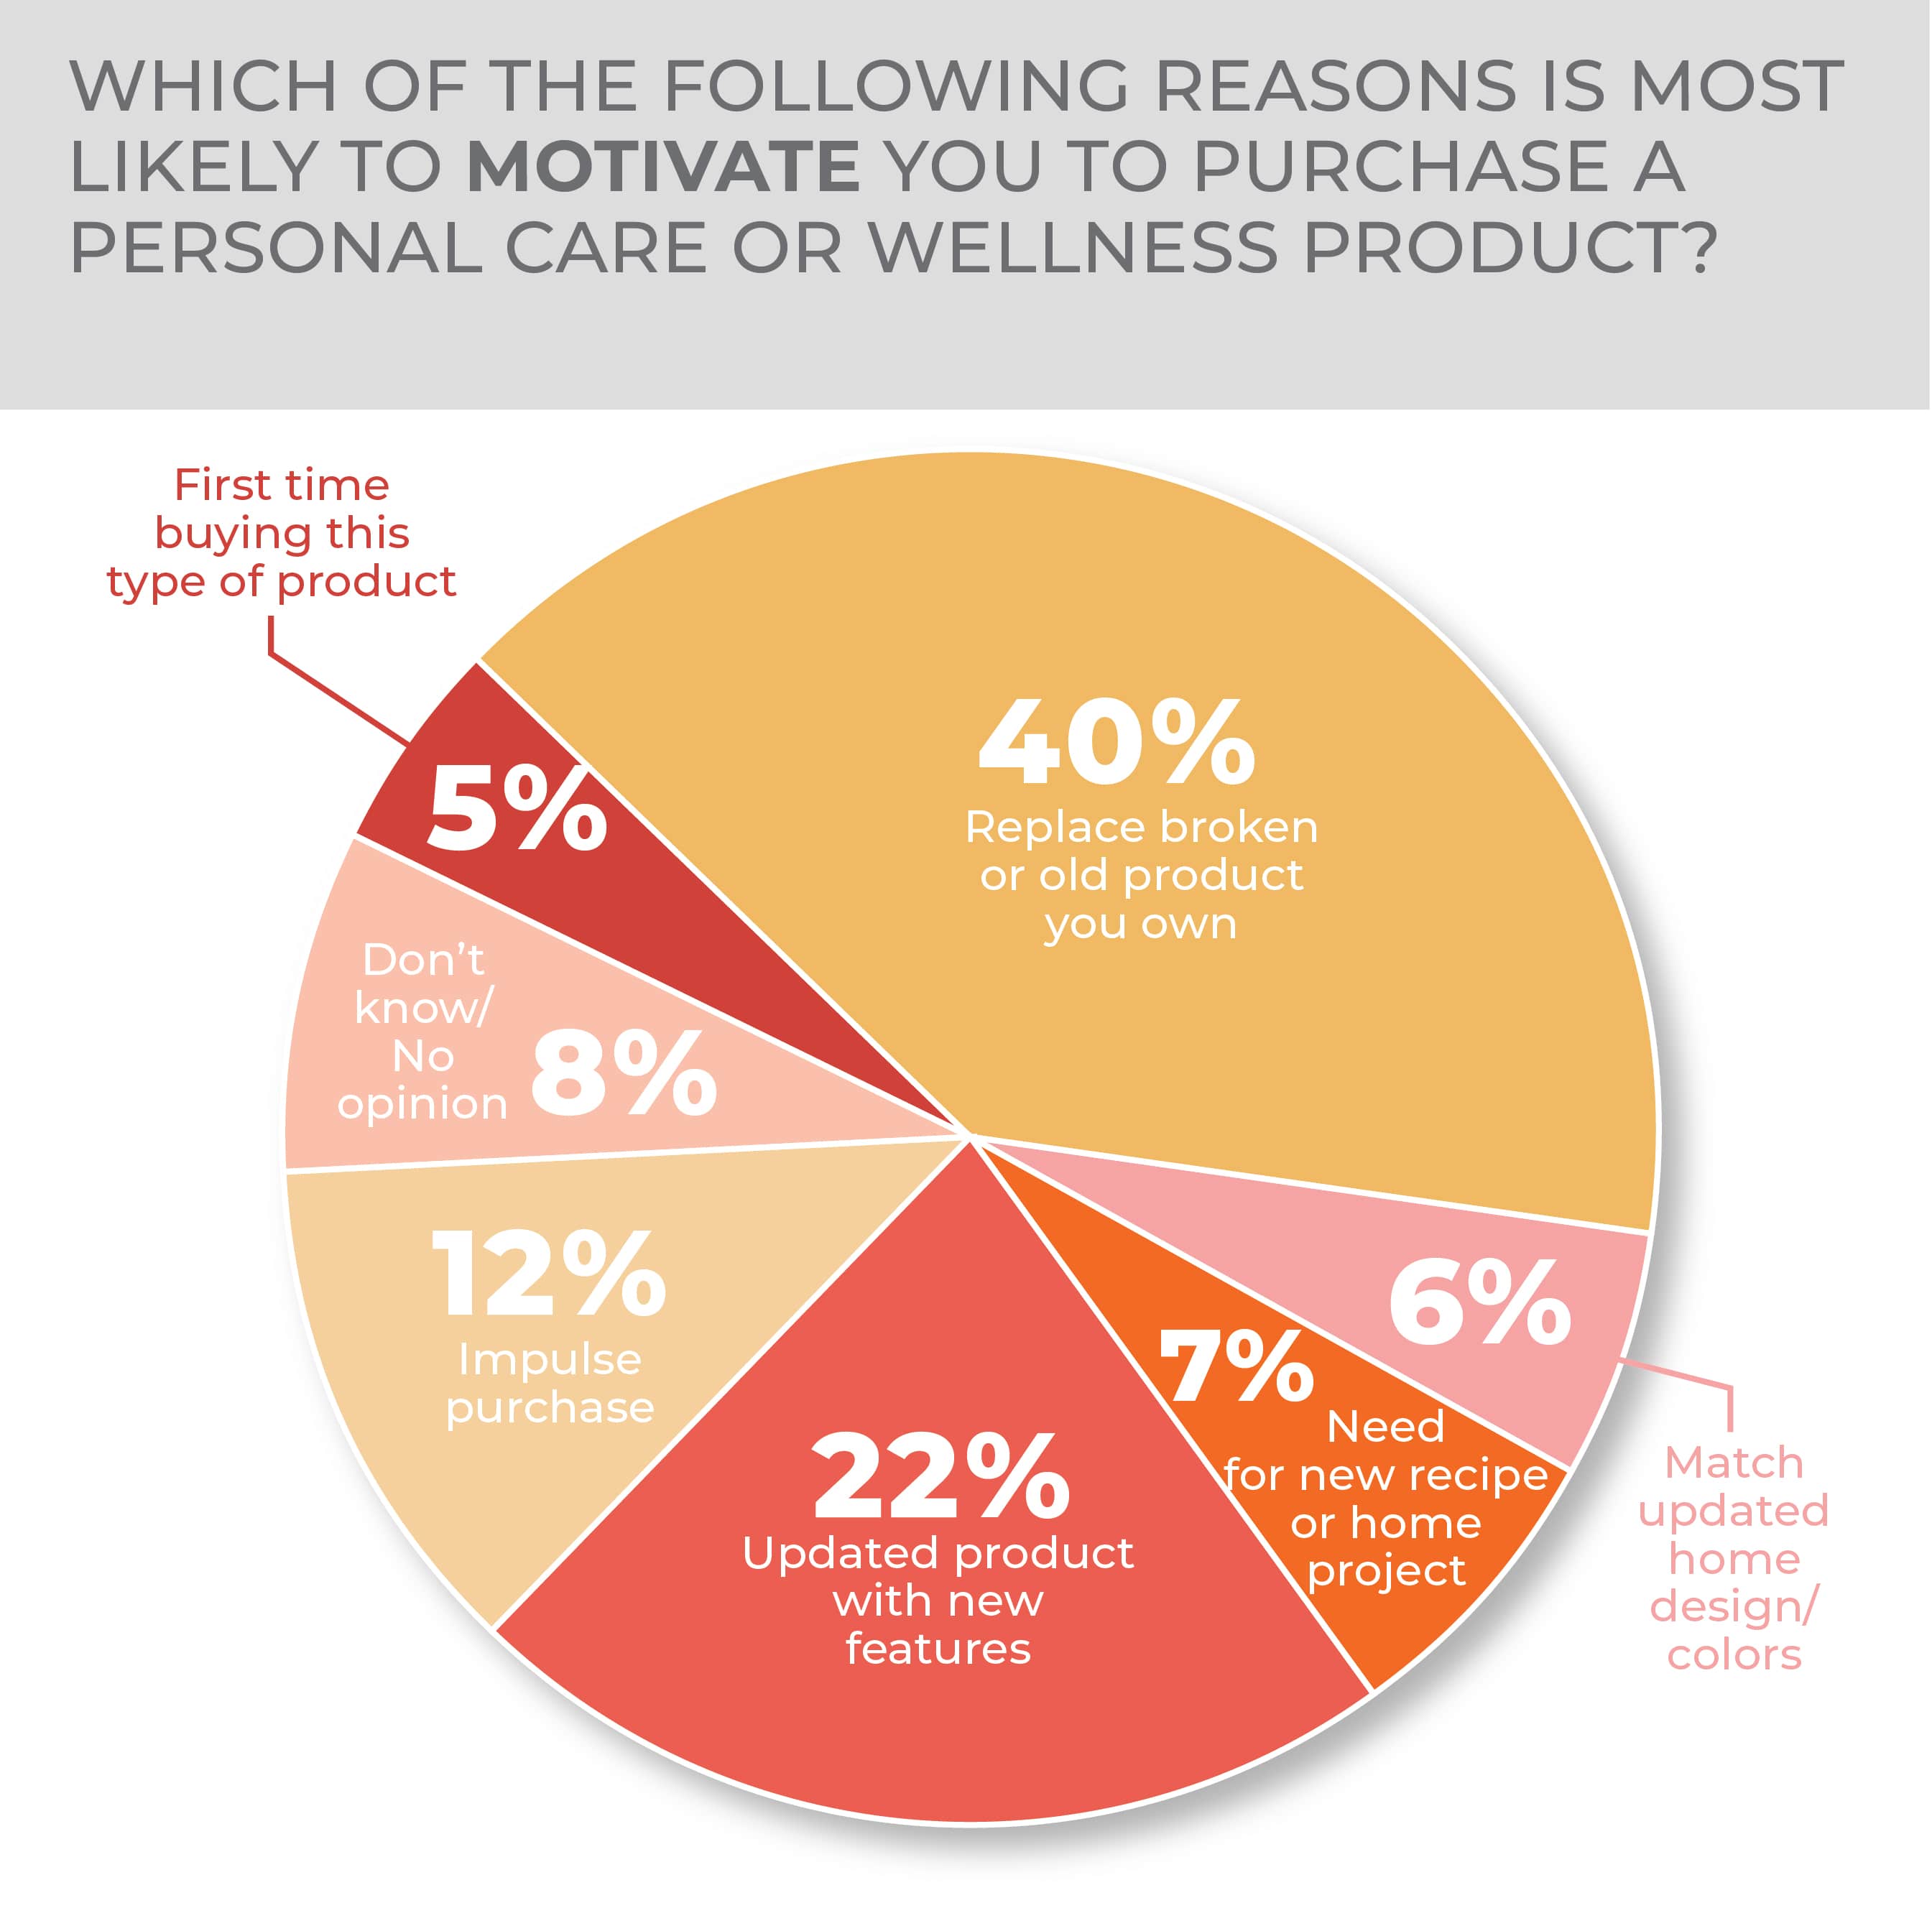
Although some potential purchases are prompted by necessity, as 40% of respondents said they would buy a new product in the category to replace a broken or old item, many consumers are primed to purchase. Following, 22% of respondents said they would buy an updated product with new features and 12% would likely buy on impulse, those being the second and third highest reasons given to spend money in the category. Year-over-year, reasons given to purchase remained proportionately the same.
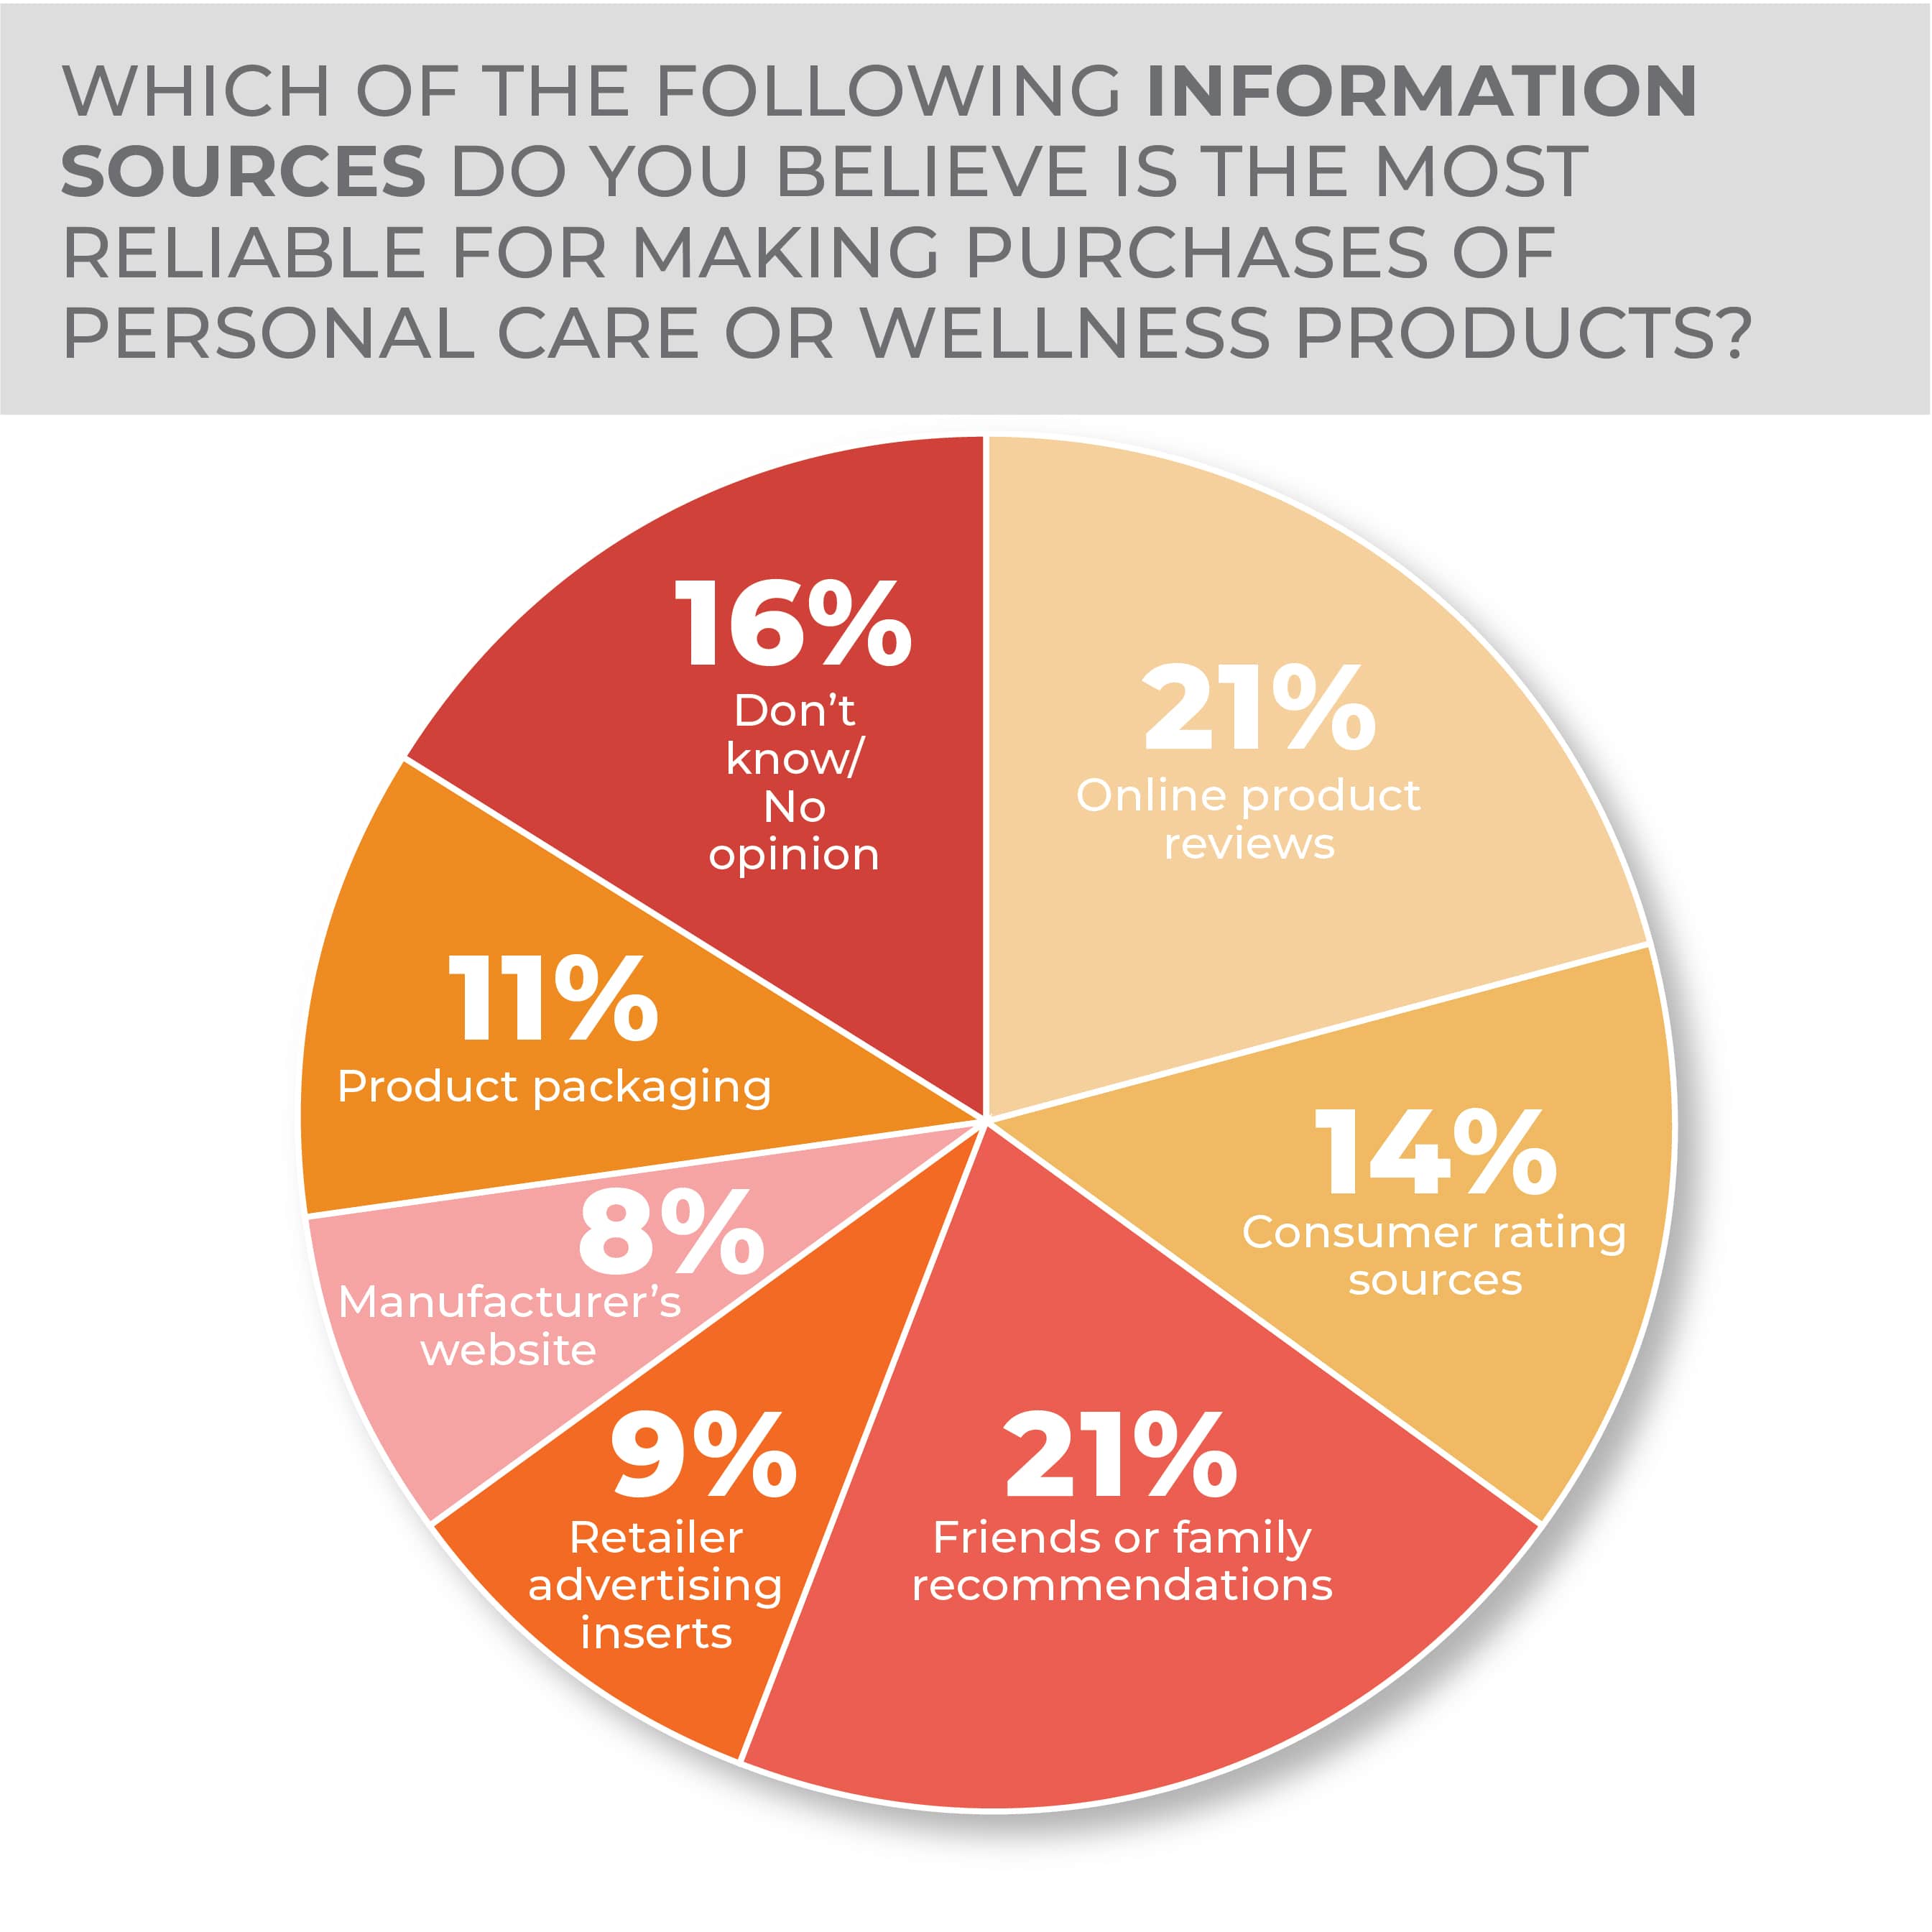
The top sources shoppers tap for information about personal care products are online reviews, tied at 21% with family and friends recommendations, followed by consumer ratings sources at 14%. However, those all slipped a bit year over year, three points in the case of reviews and four points in the case of friends or family recommendations. Product packaging gained five points to 11% year over year.
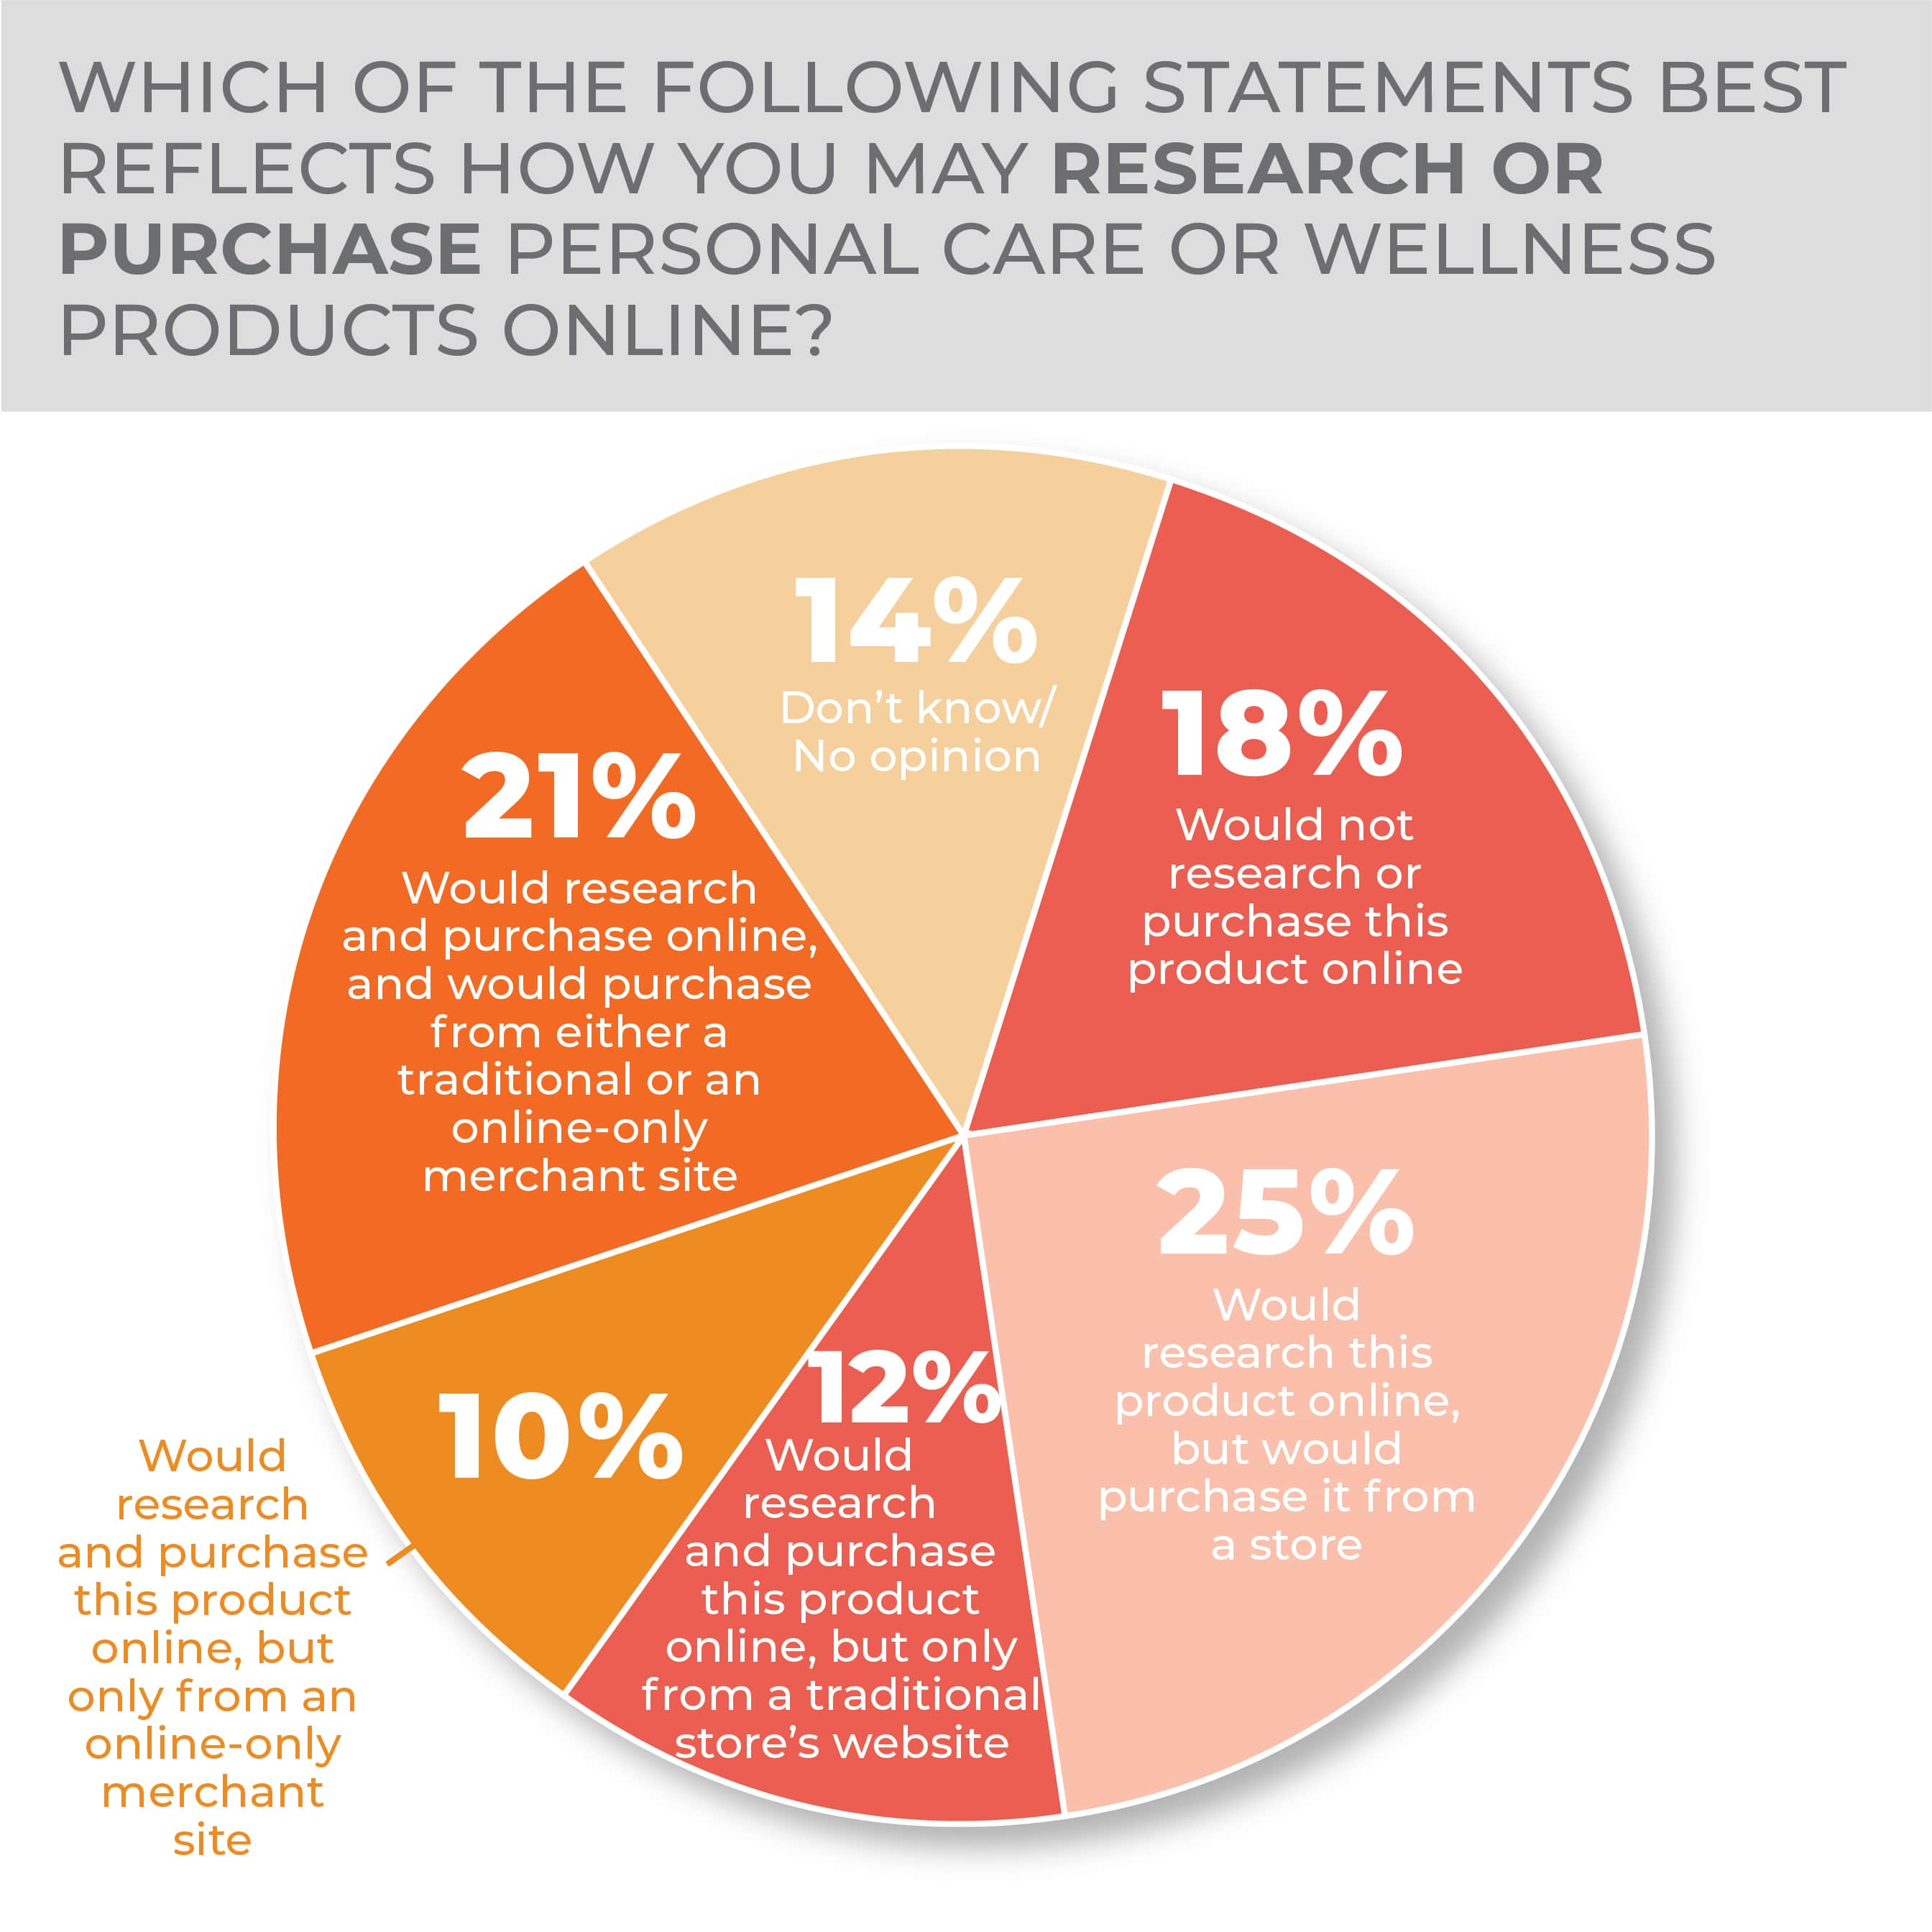
In the end, and at similar proportions to the year-earlier survey, consumers were about equally prepared to purchase in-person or online. As such, 18% of survey respondents said they would not research or purchase online, and 25% said they would research online but buy from a traditional store. Meanwhile, 12% said they would research and purchase online but from a traditional store’s website, 10% would research and purchase online but from an online-only merchant and 21% said they would research online and purchase from either a traditional or an online-only merchant.
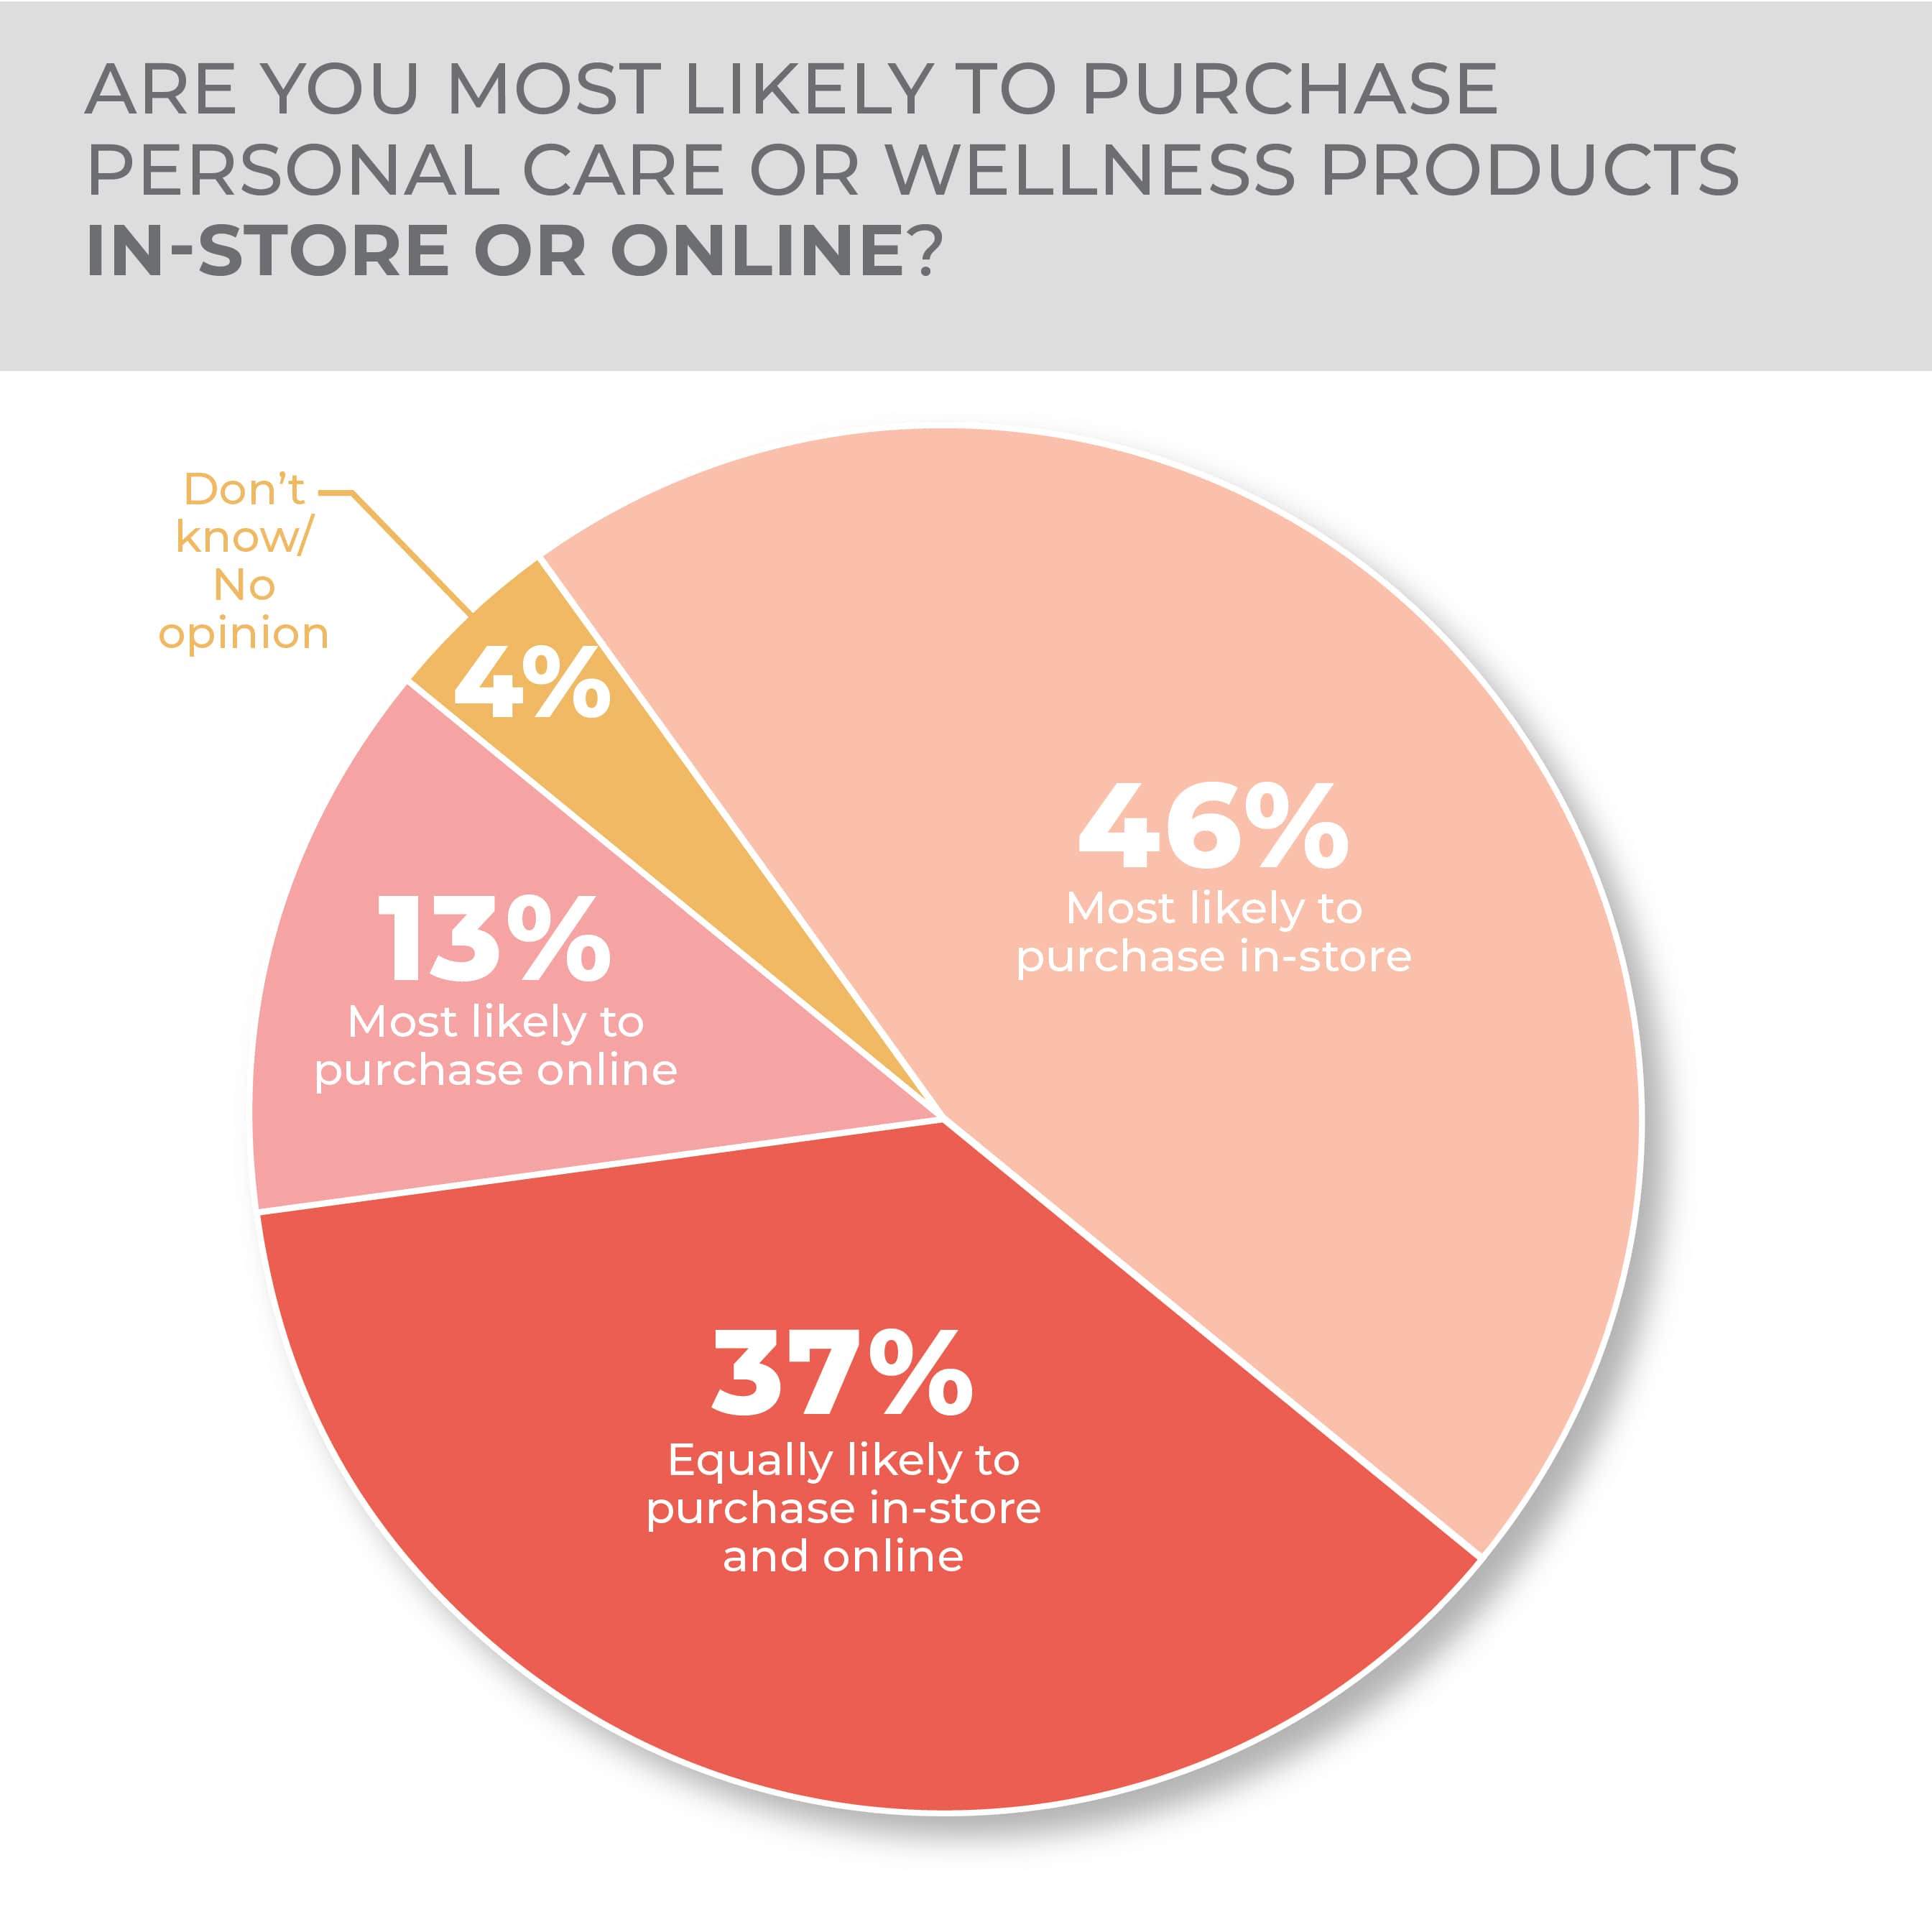
When asked to comment directly on their purchasing preference, 46% of consumers said they would most likely purchase personal care products in-store, while 37% said they were equally willing to buy in-store or online, and 13% said they would most likely buy in-store.
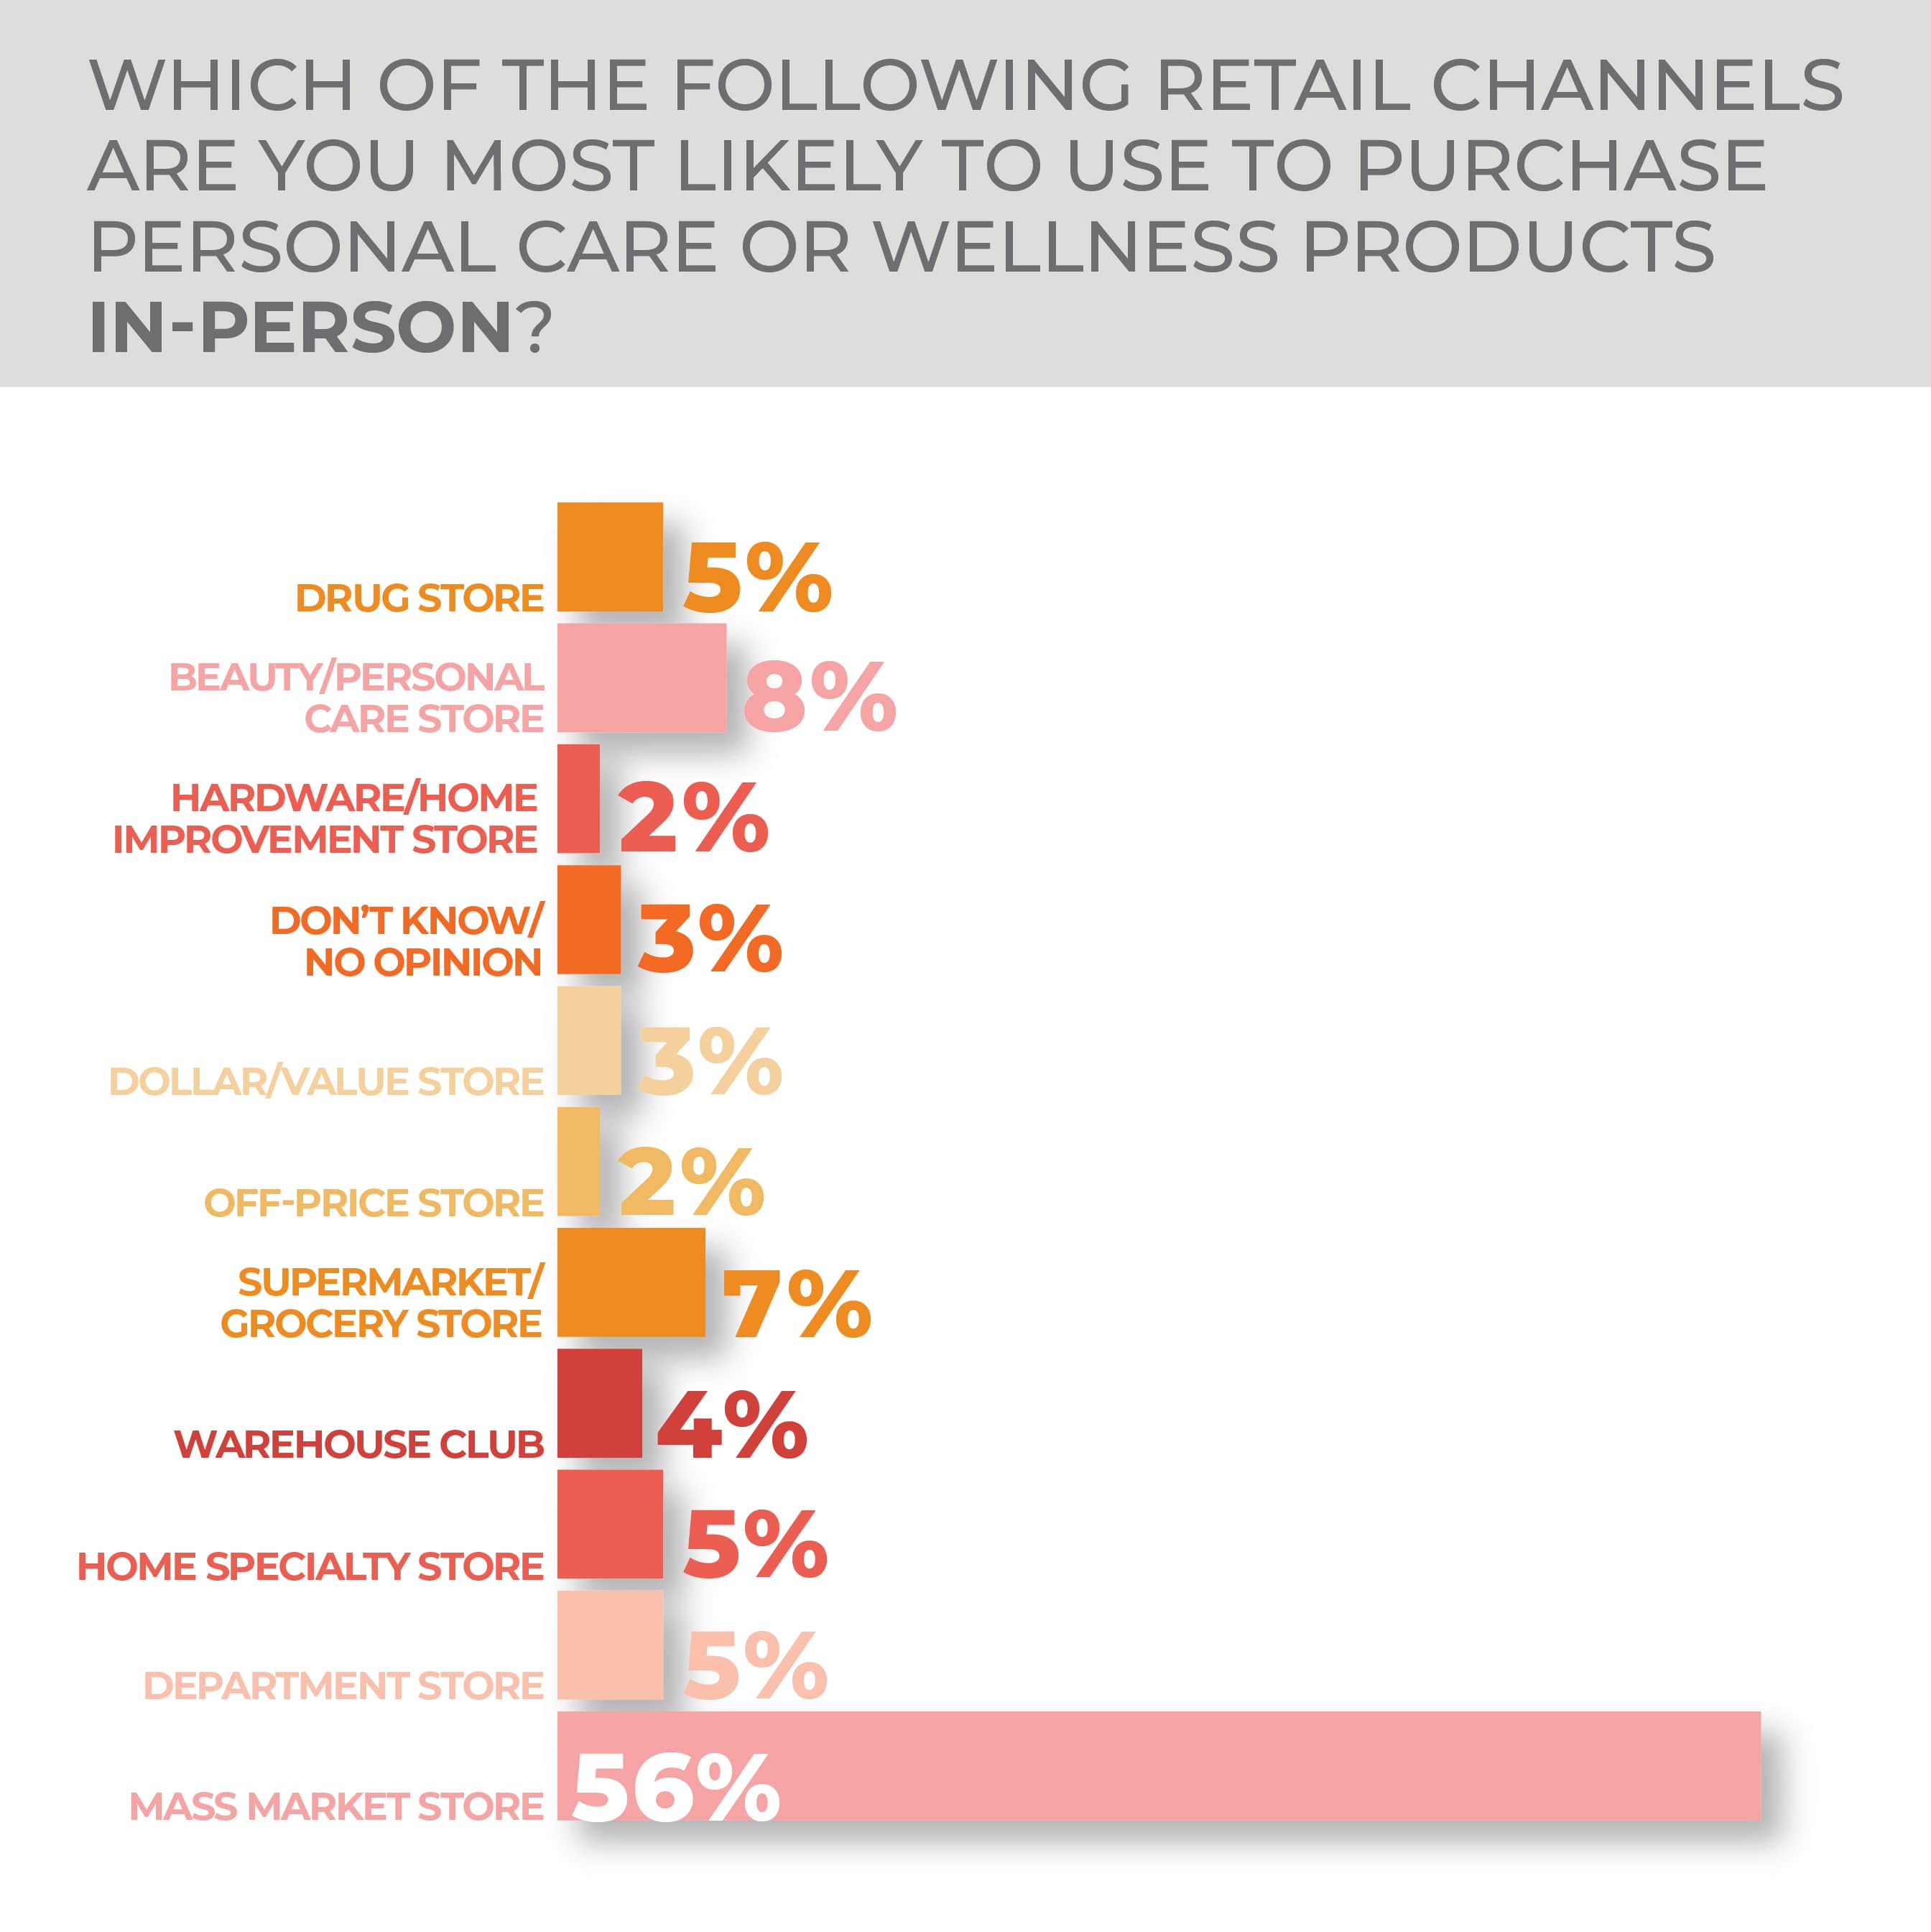
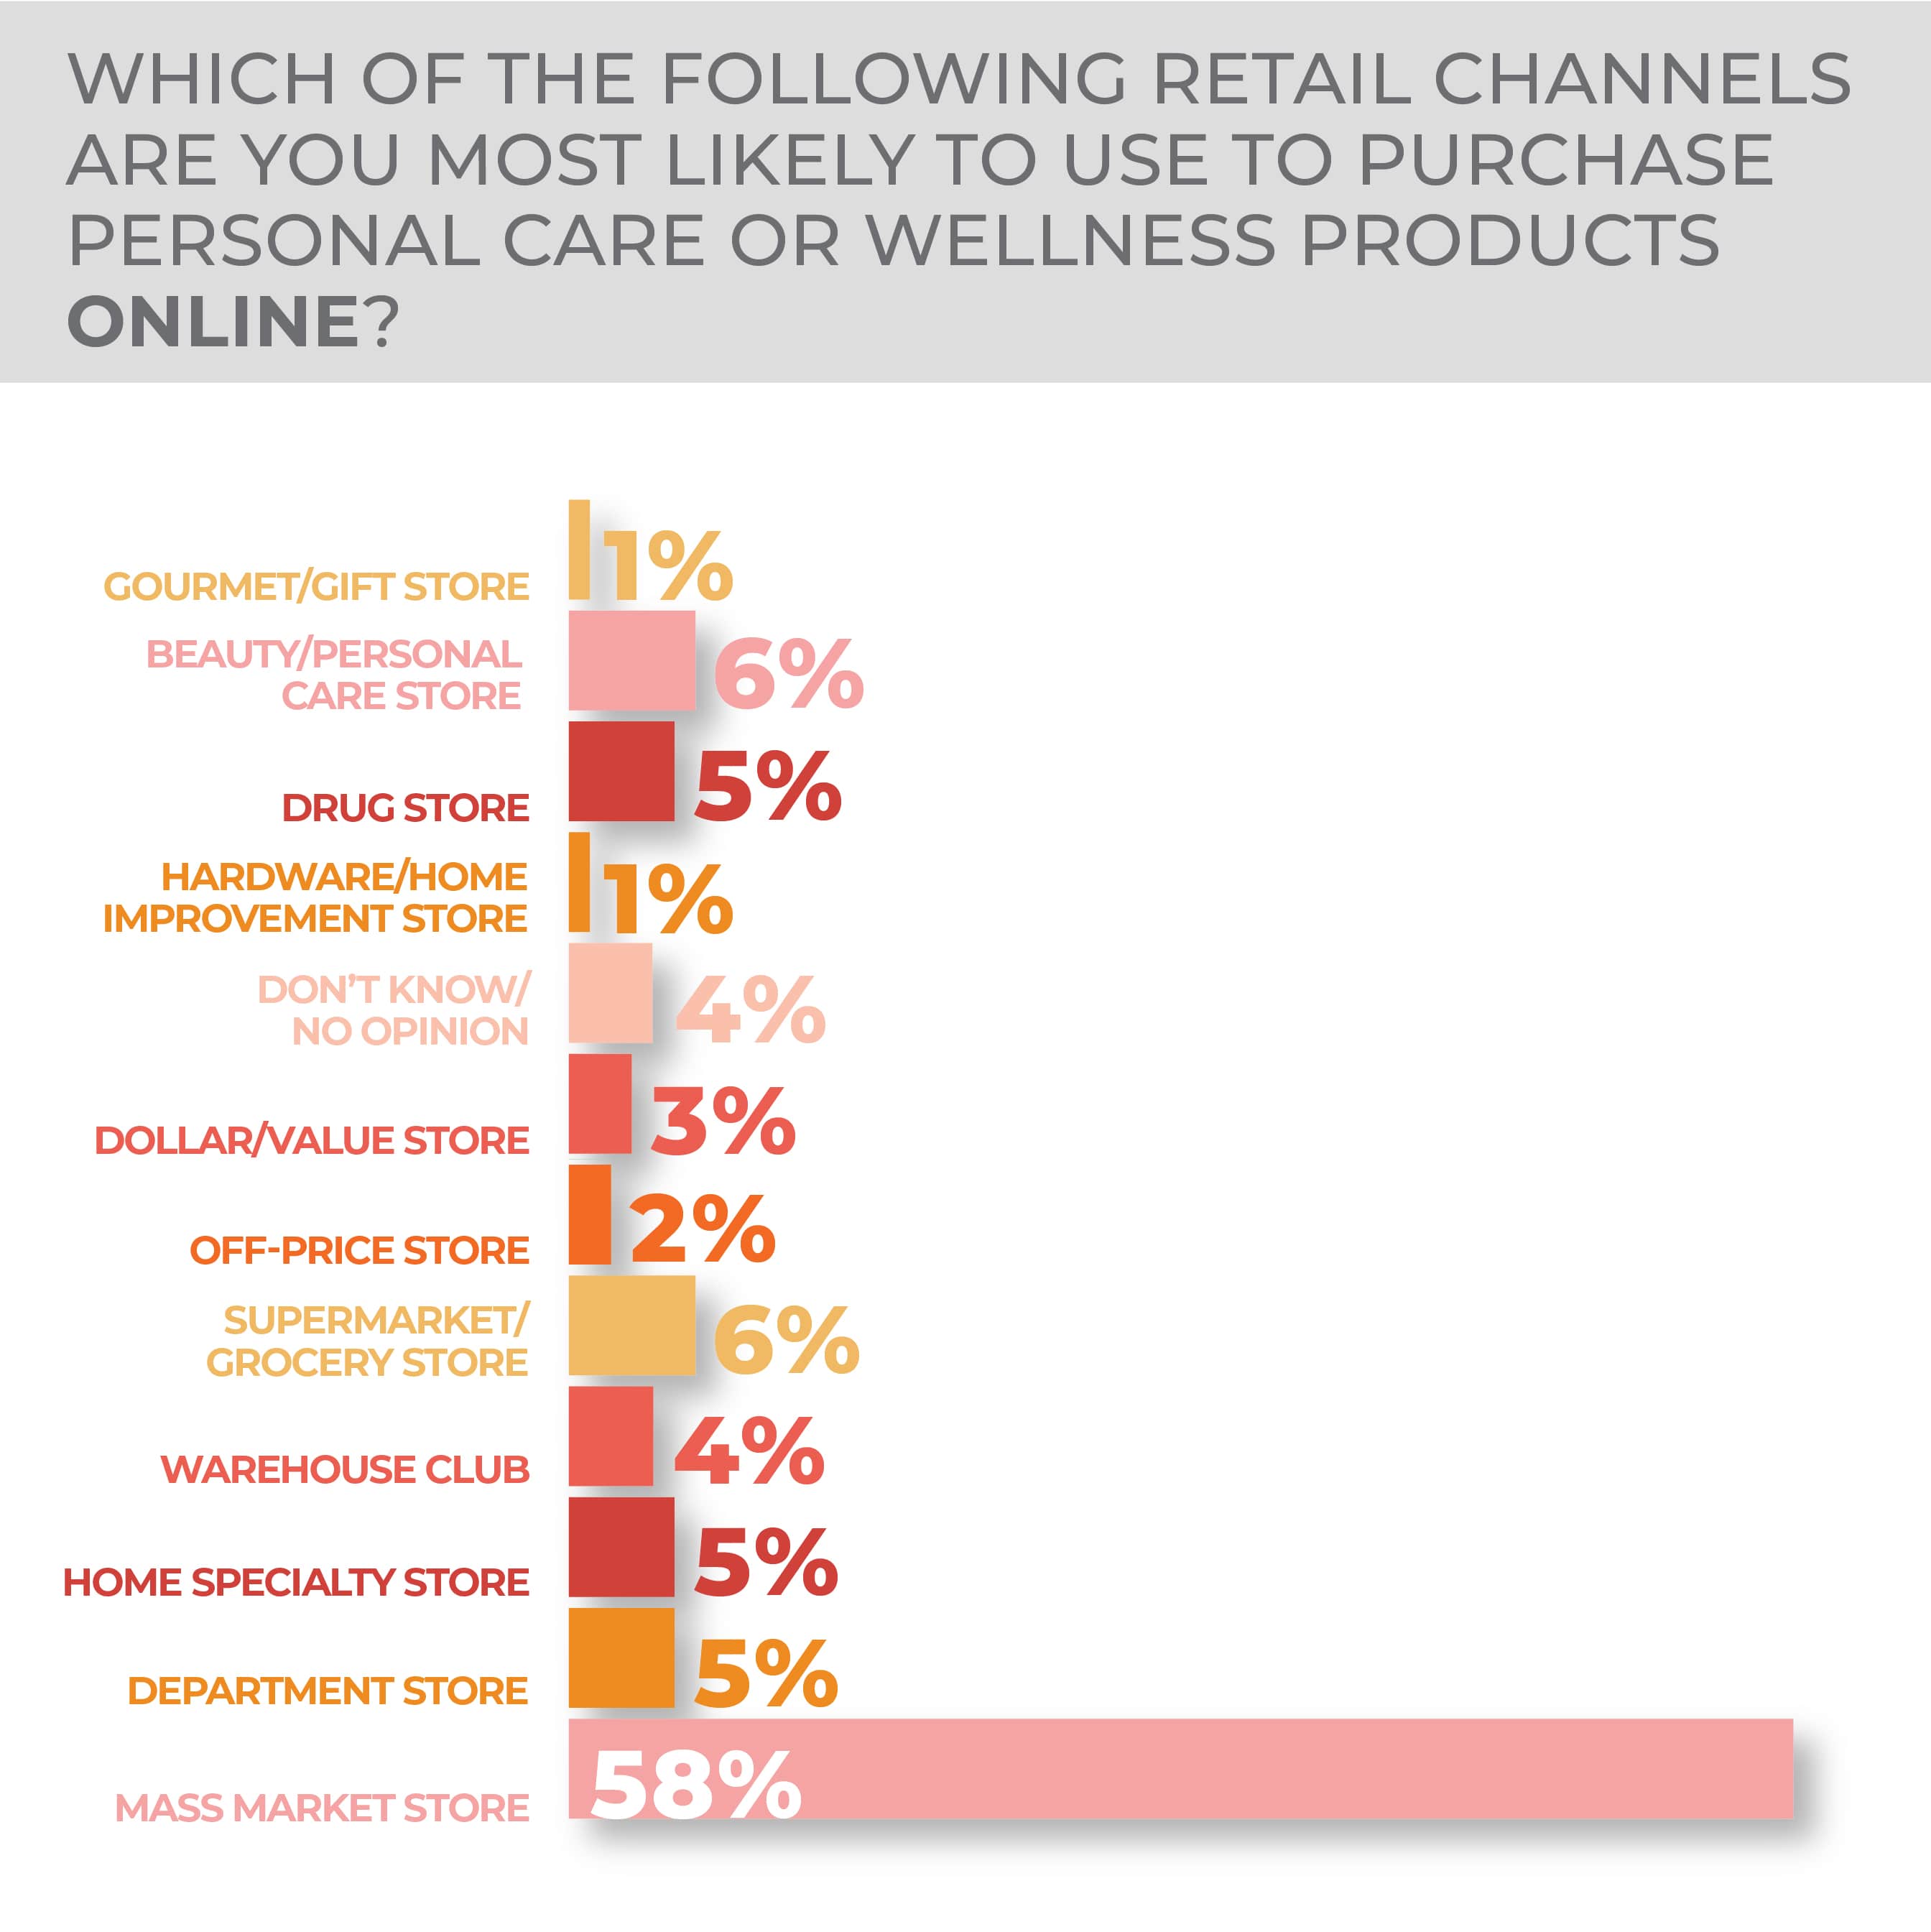
Consumers have a strong preference for purchasing in mass market stores, with 56% saying that’s the channel where they would buy, with beauty/personal care stores at a distant second place at 8%. Mass merchants are even further ahead when it comes to online purchases, at a 58% preference, and second place coming in as a tie between beauty/personal care stores and supermarket/grocery stores at 6%.
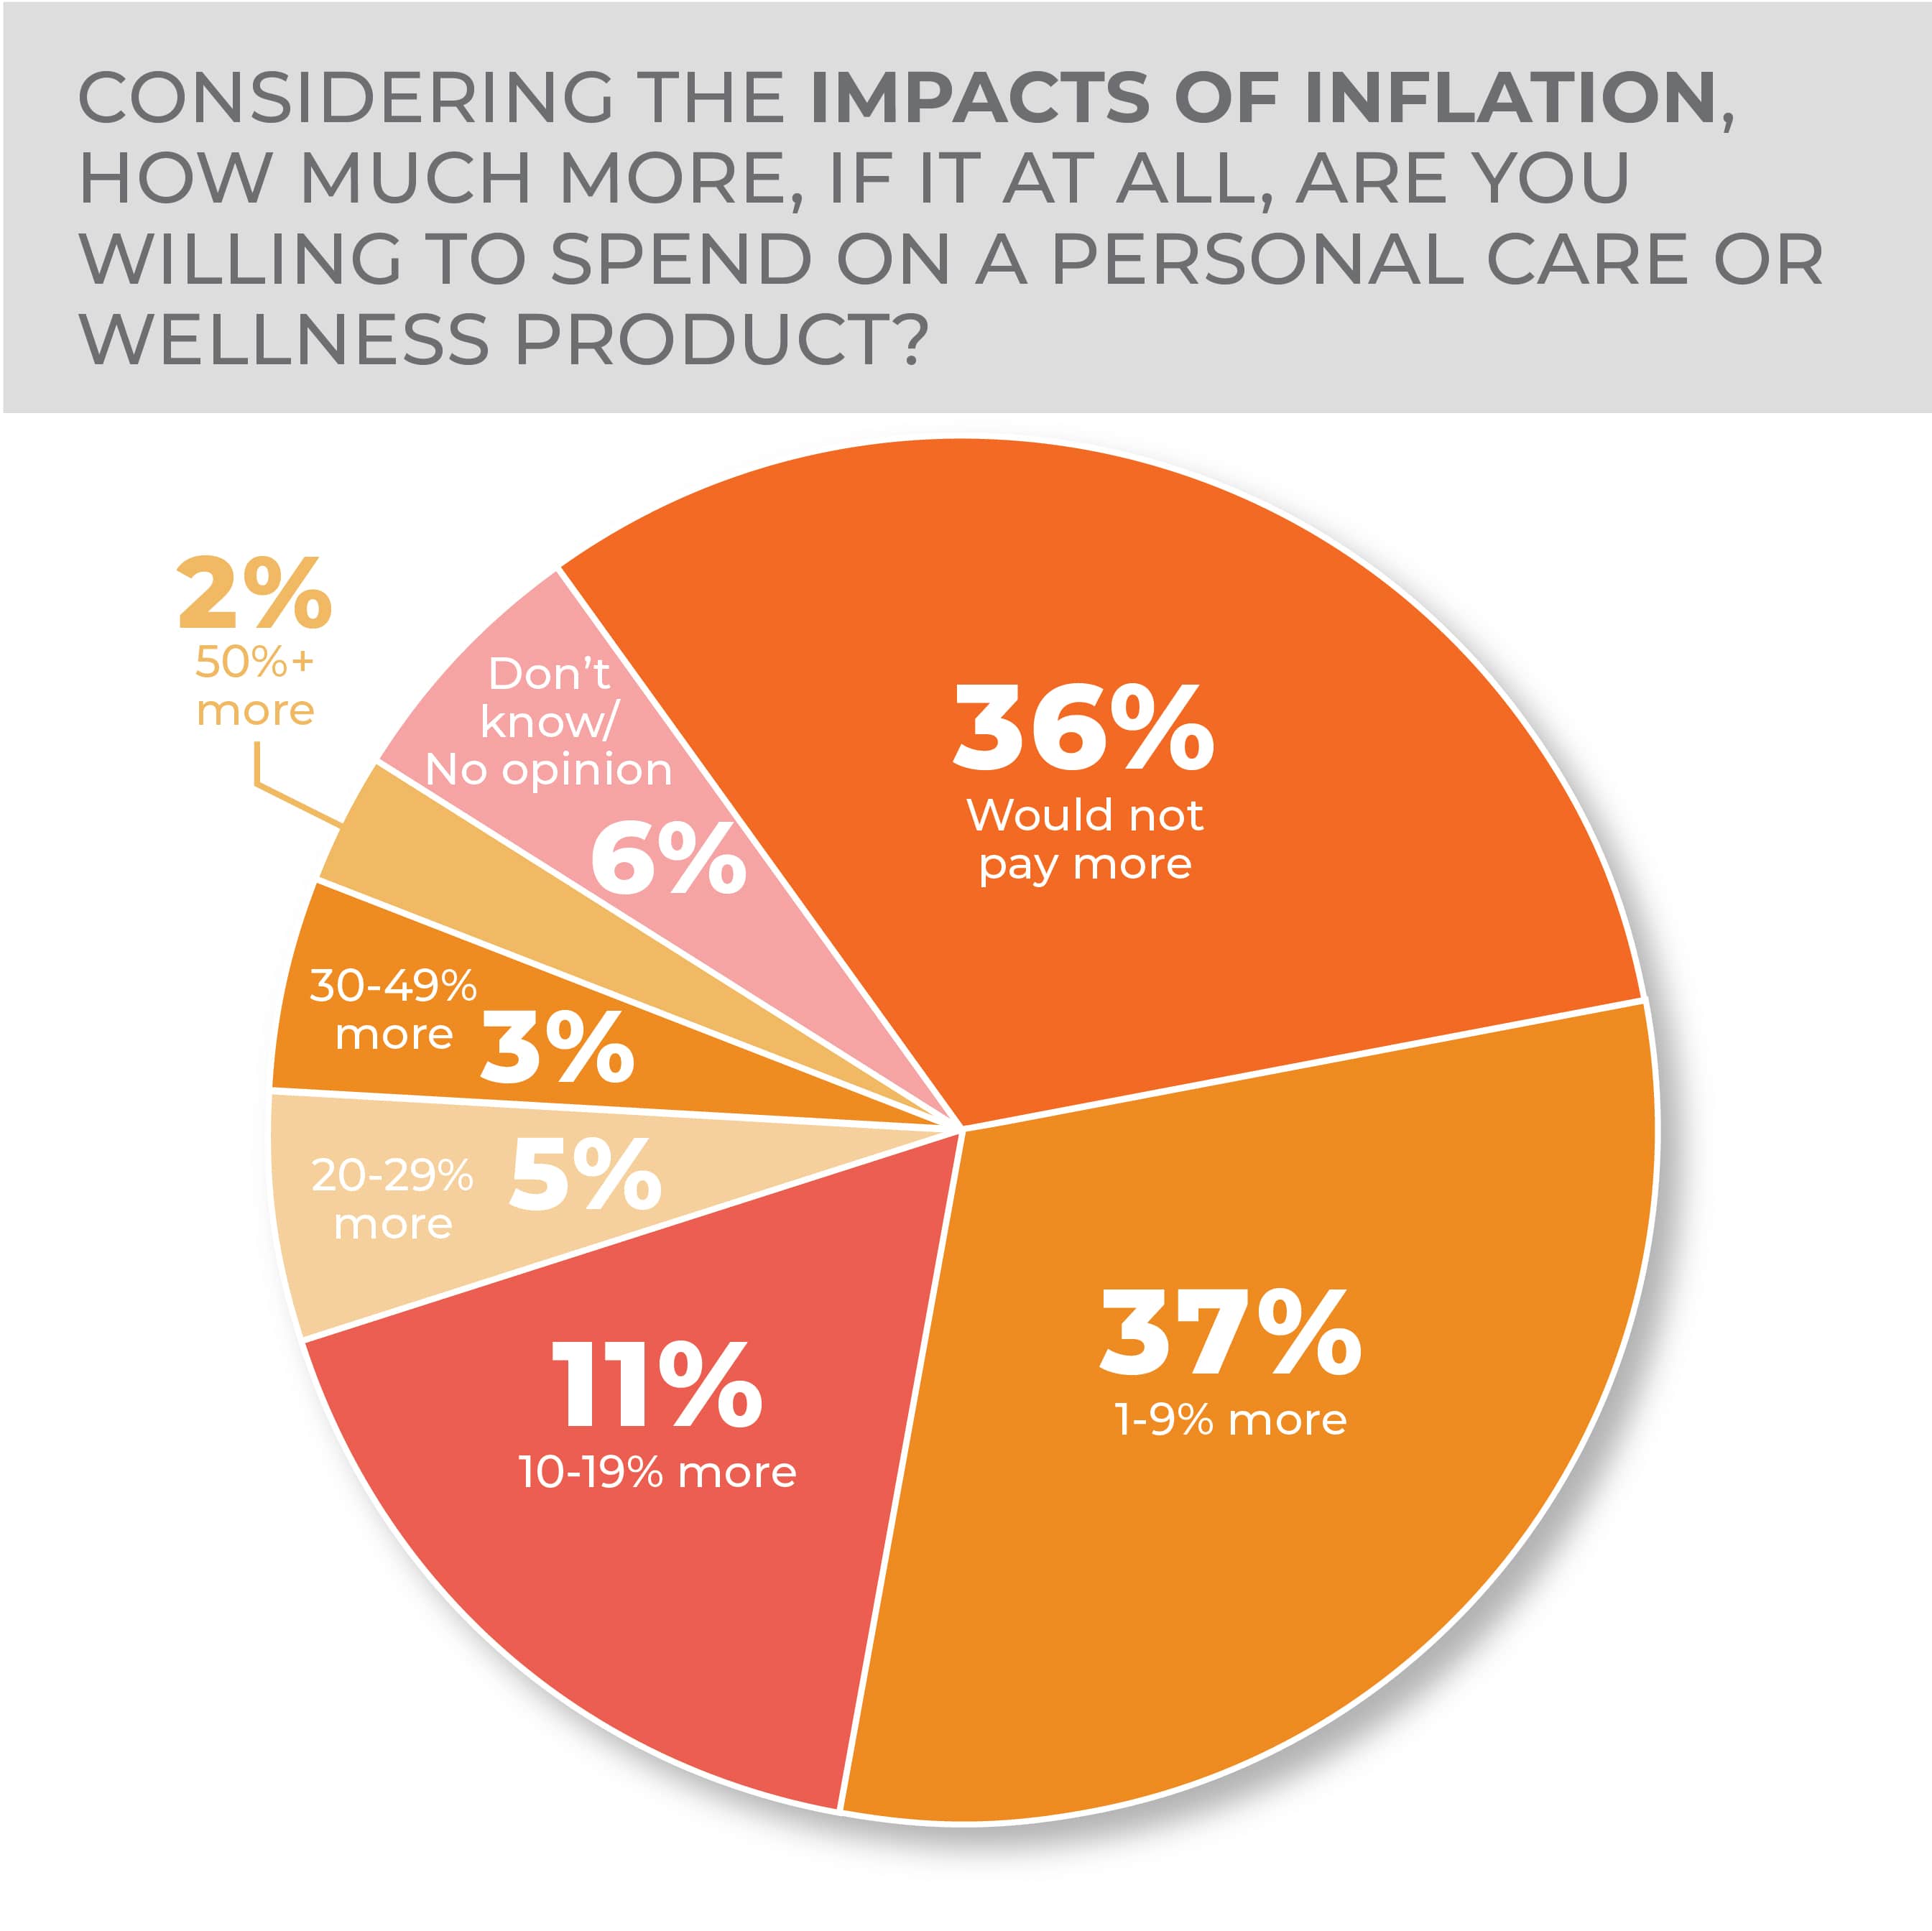
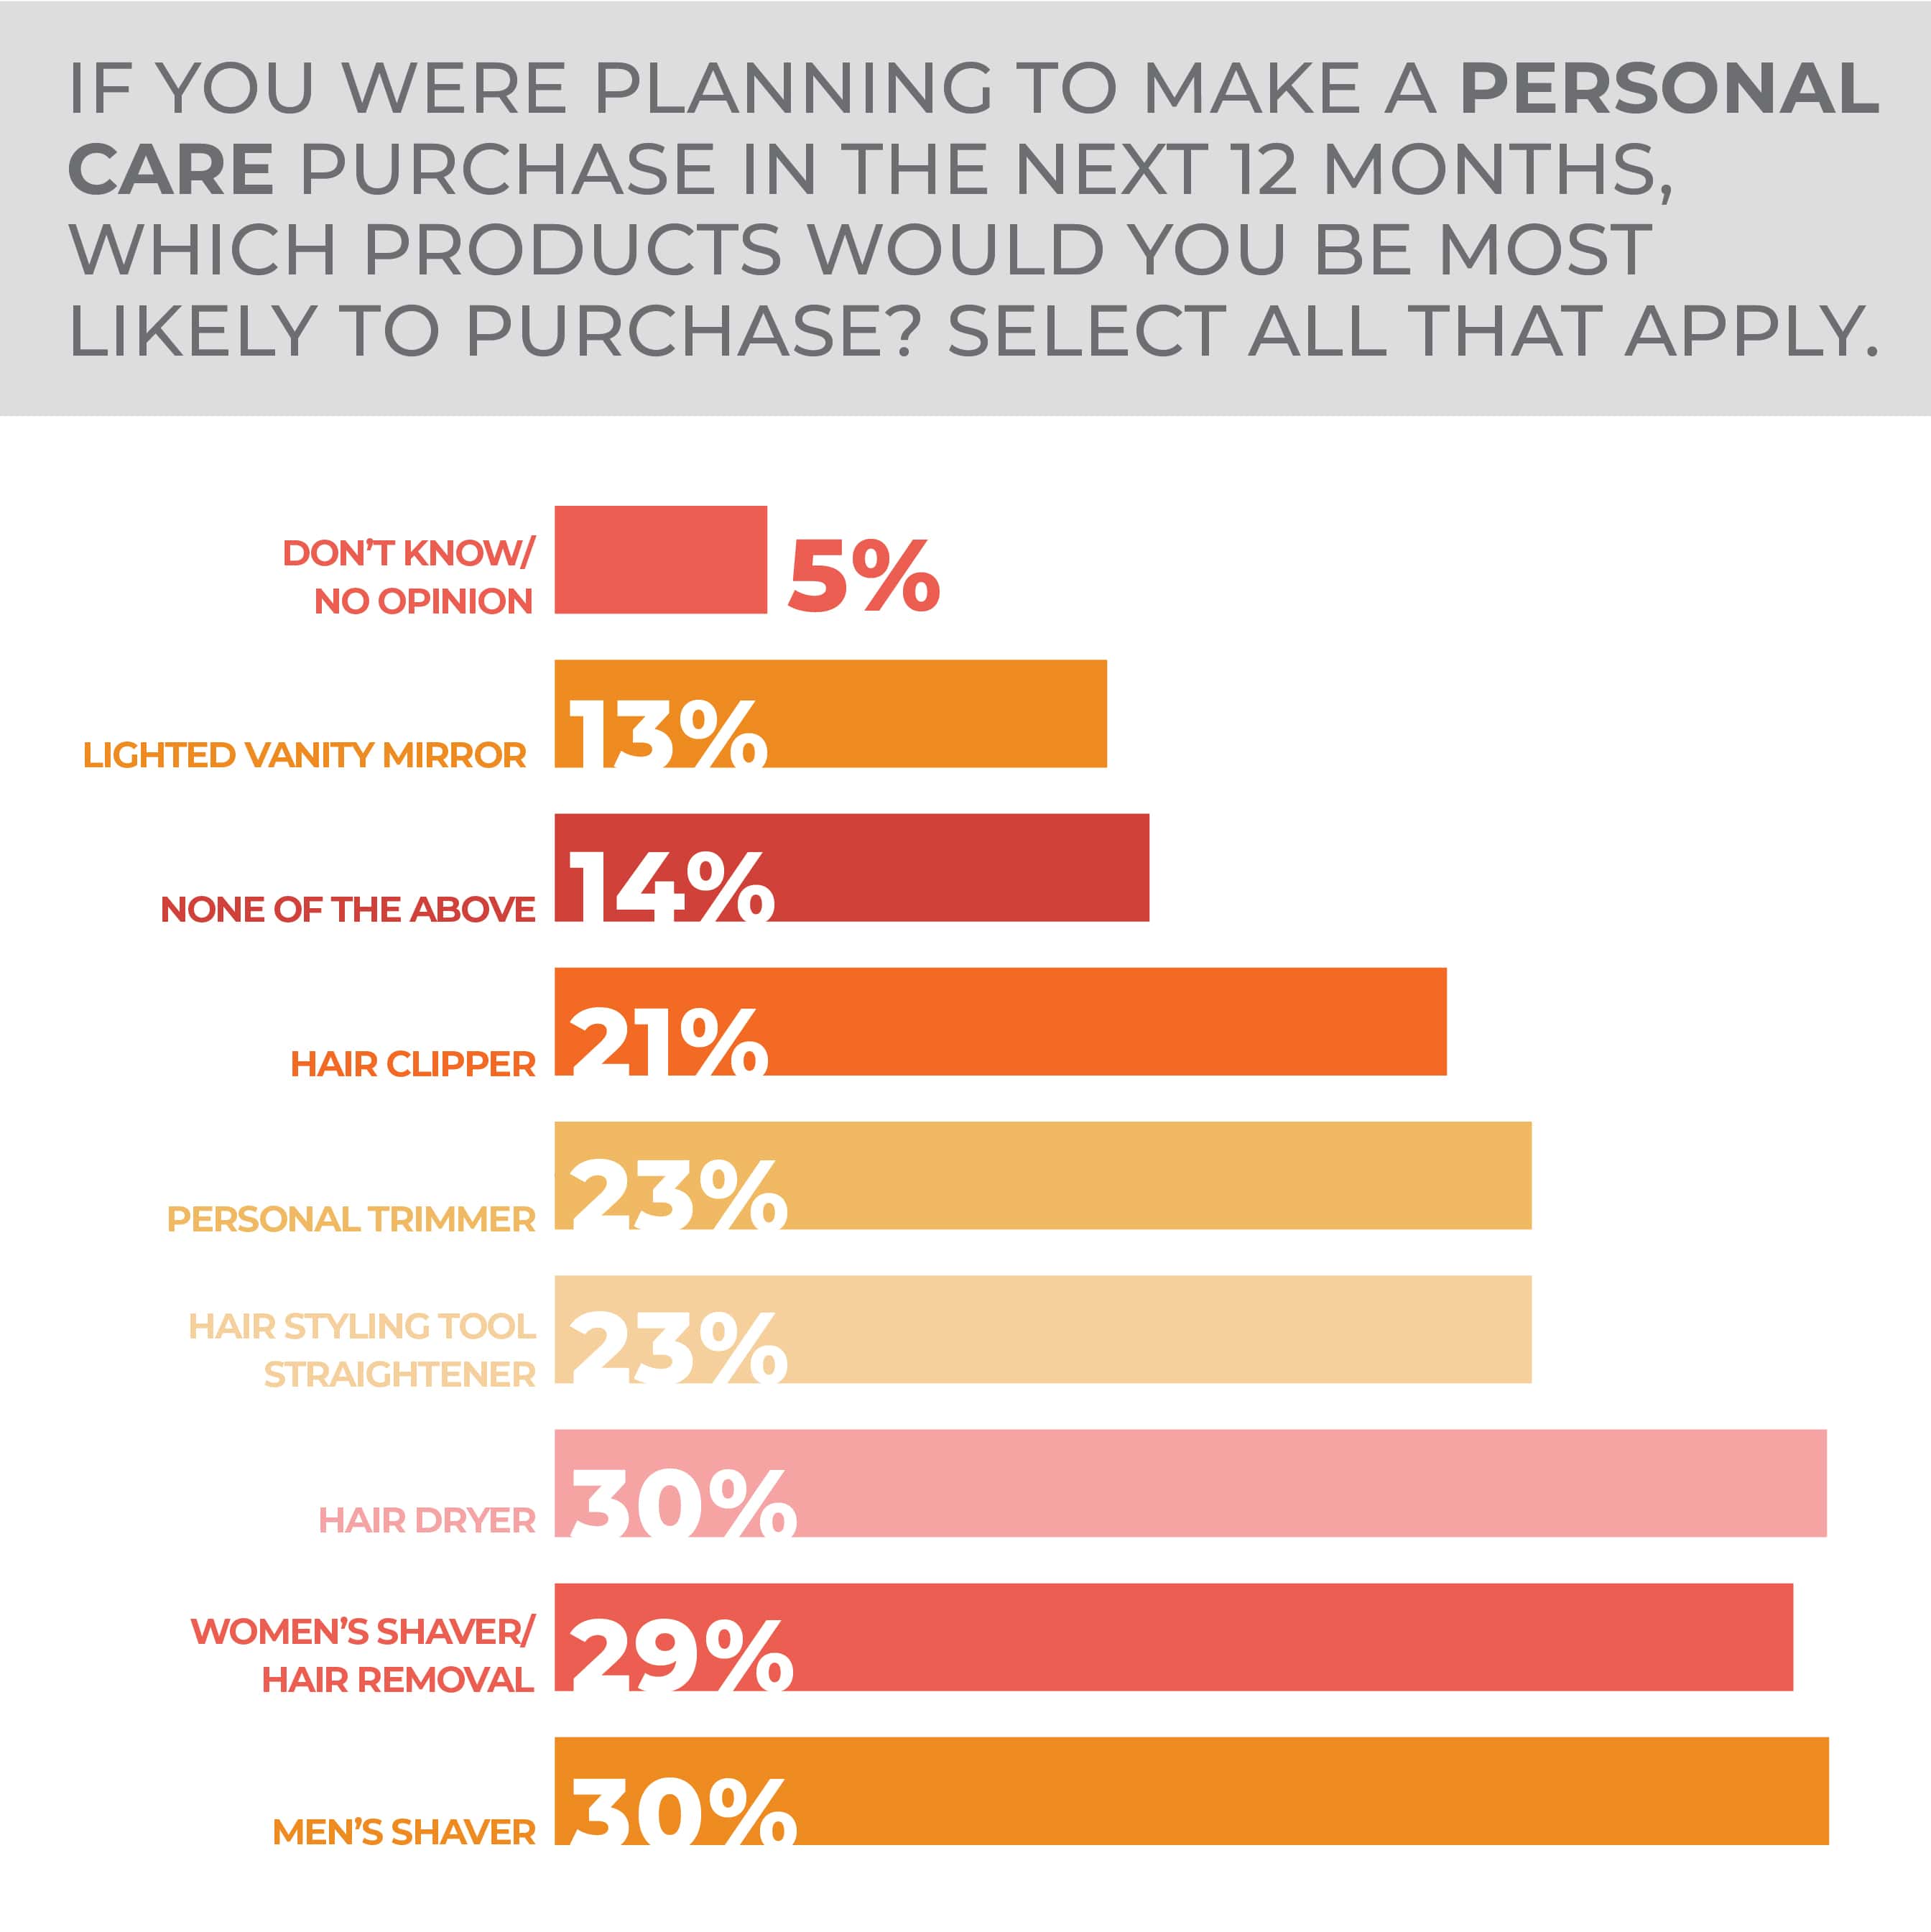
Consumers are not anxious to pay more for personal care items: 36% of survey respondents said they would not pay more, and 37% said they would pay 1% to 9% more, while 11% said 10% to 19% more. Men’s shavers and hair dryers are tied for the products most considered for purchase at 30% followed by women’s shavers/hair removers at 29% then hair styling tools/straighteners and personal trimmers tied at 23% followed by hair clippers at 21% with lighted vanity mirrors at 13%. Versus the year-previous version, hair dryers gained five points in the most recent survey with other categories showing only slight changes.
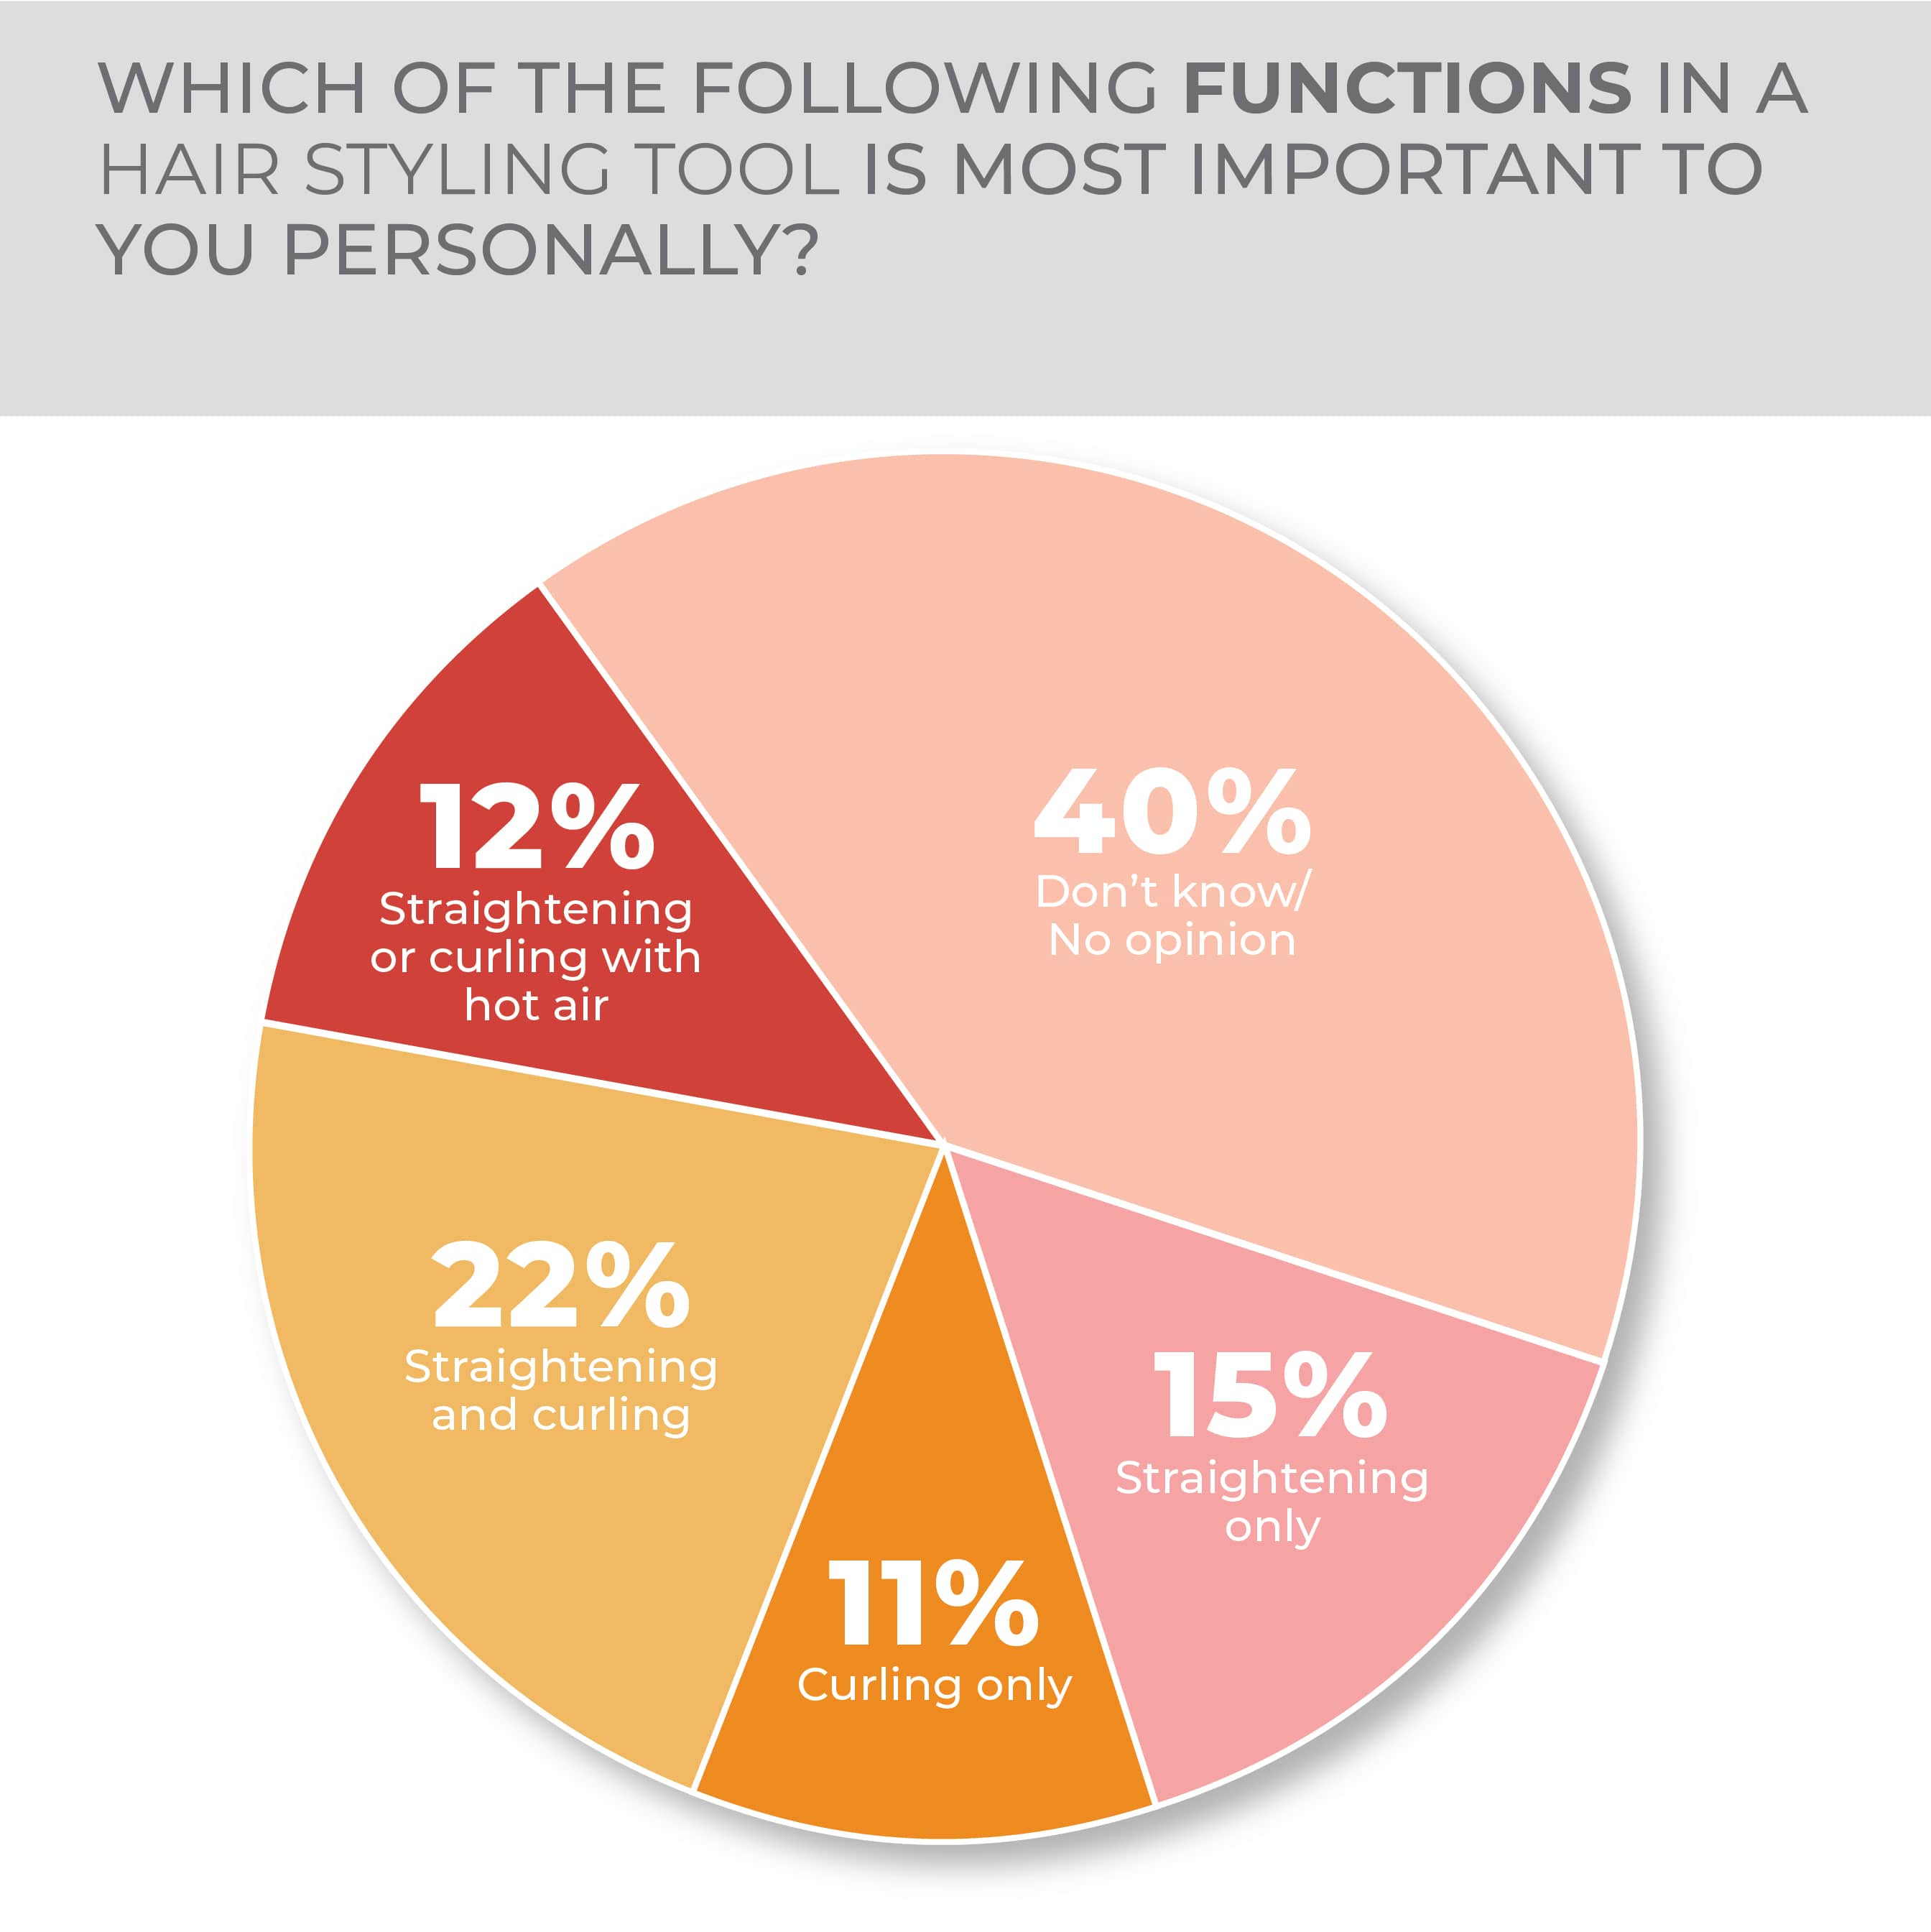
Within the hair styling tool segment, 22% of consumers who express a preference said that tools that straighten and curl were their favorite option followed by straightening only at 15%, straightening and/or curling with hot air at 12% and curling only at 11%.
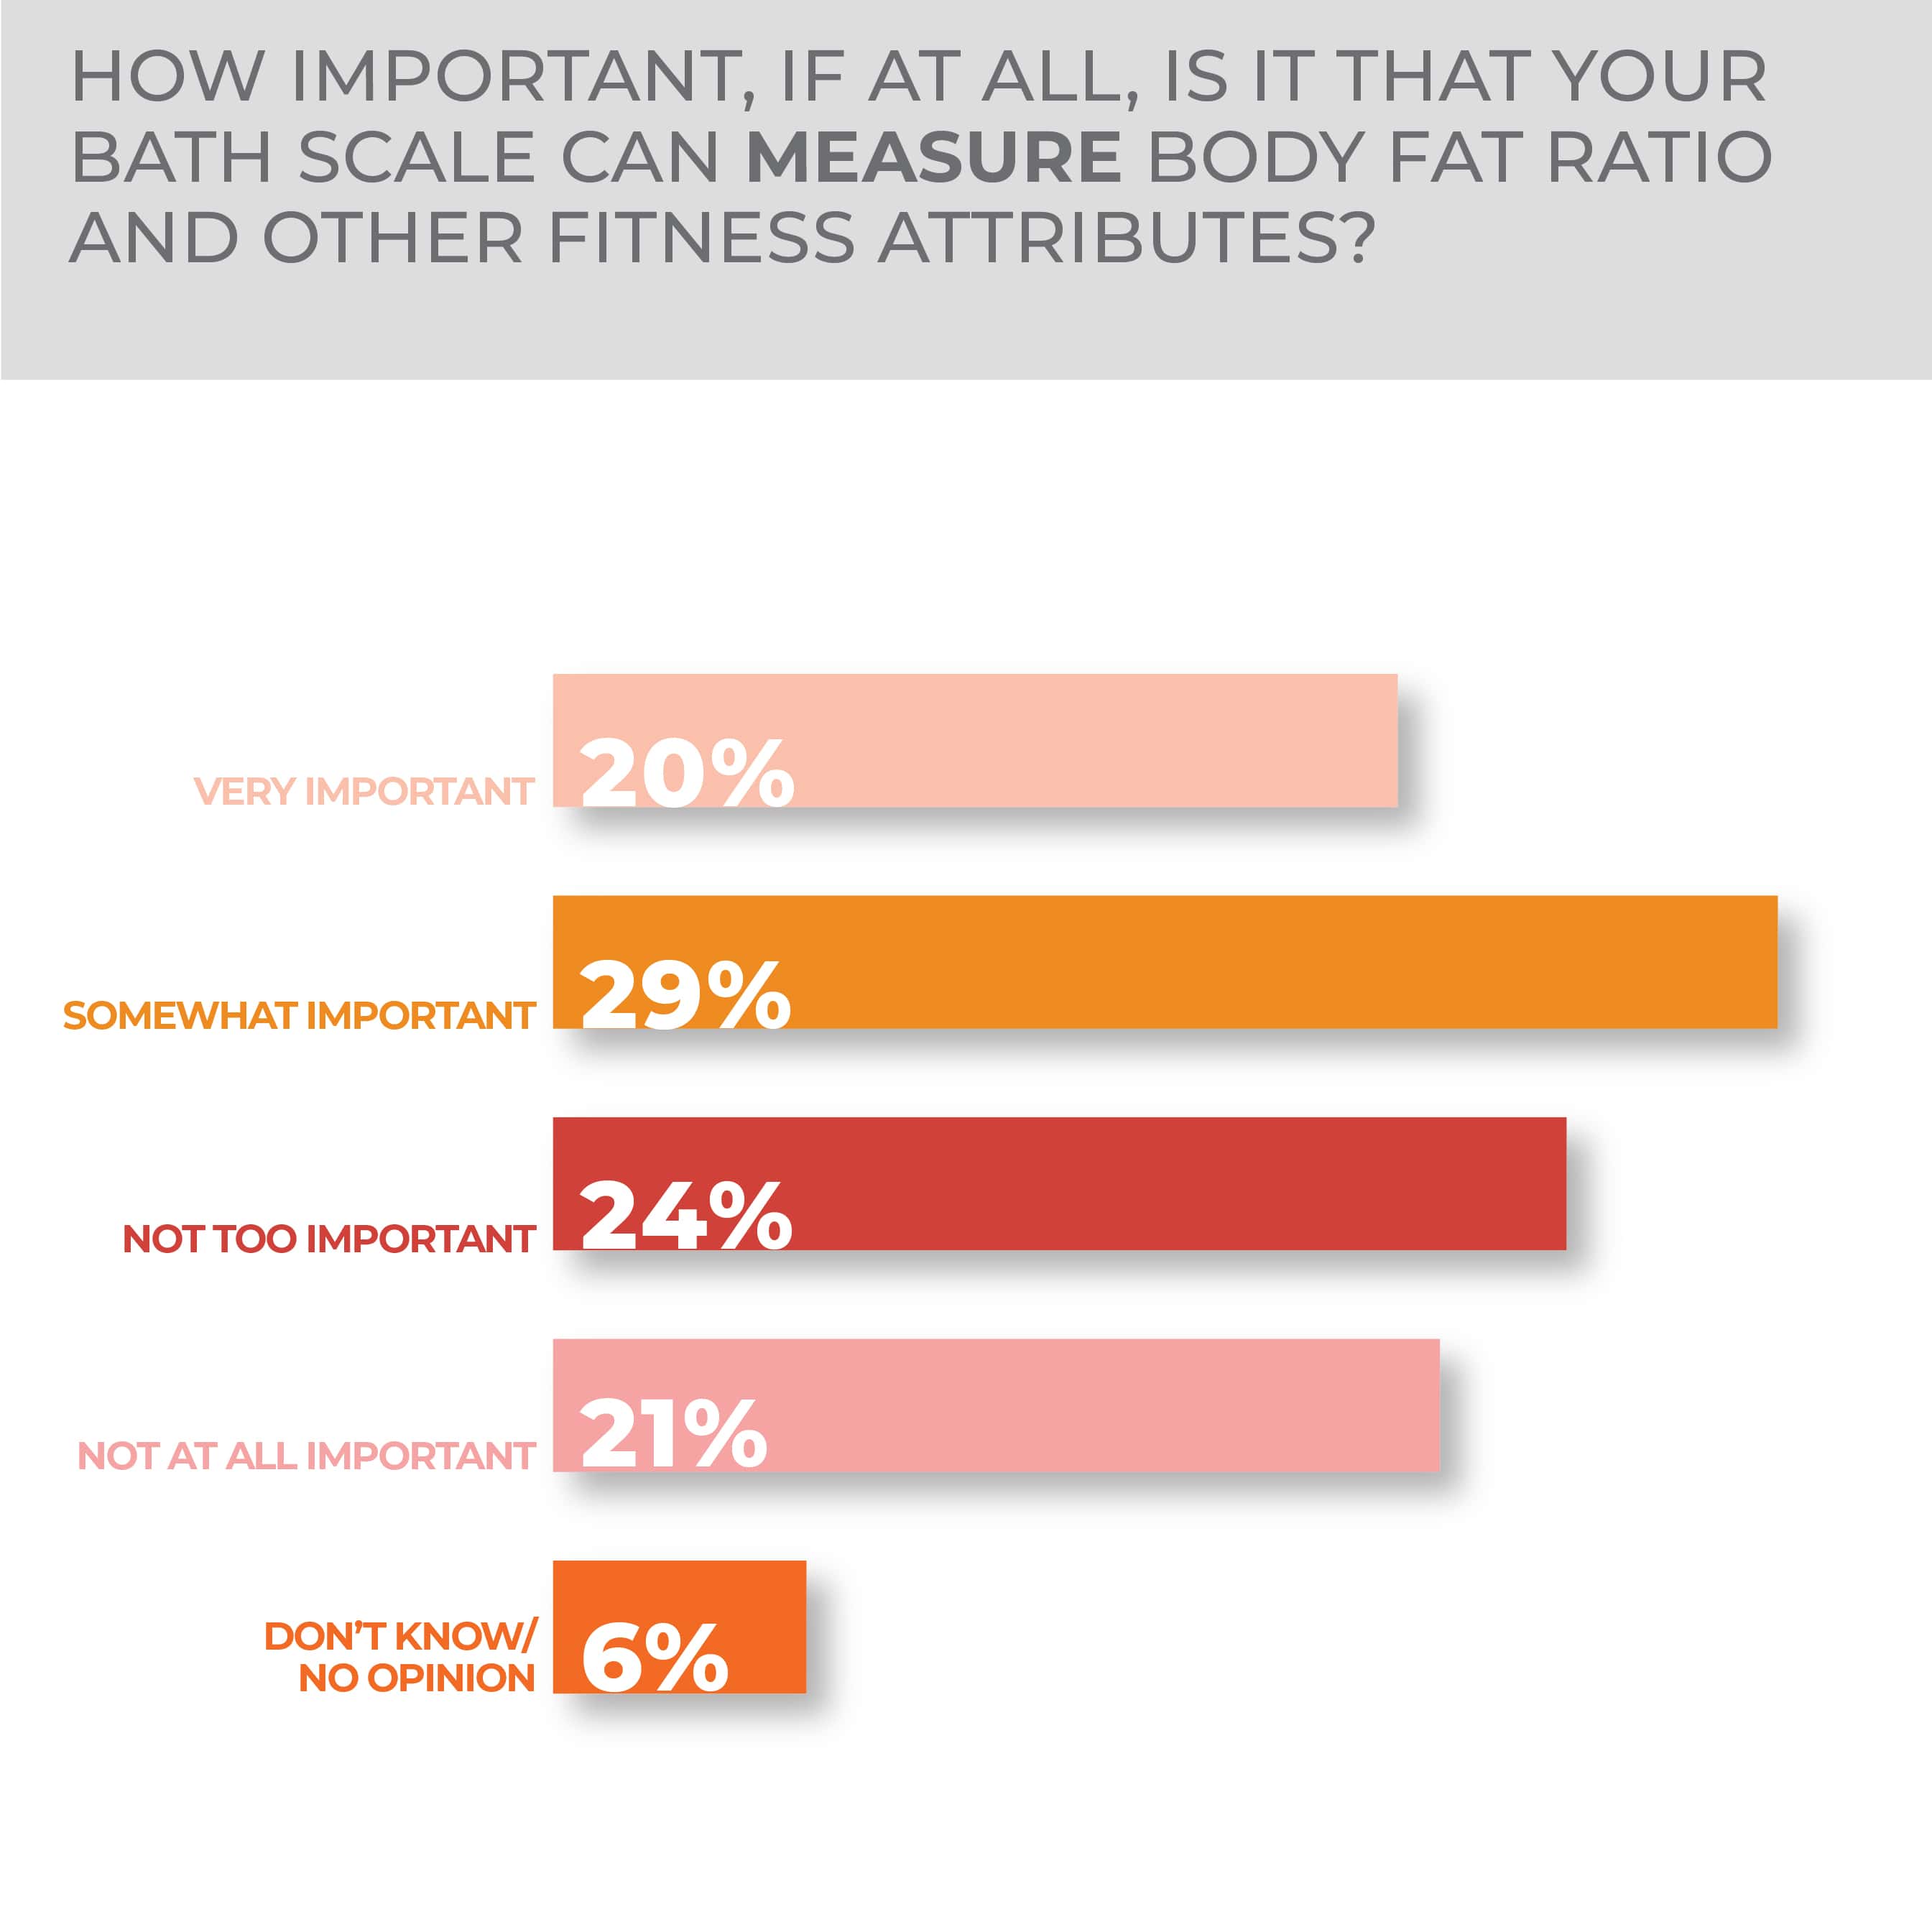
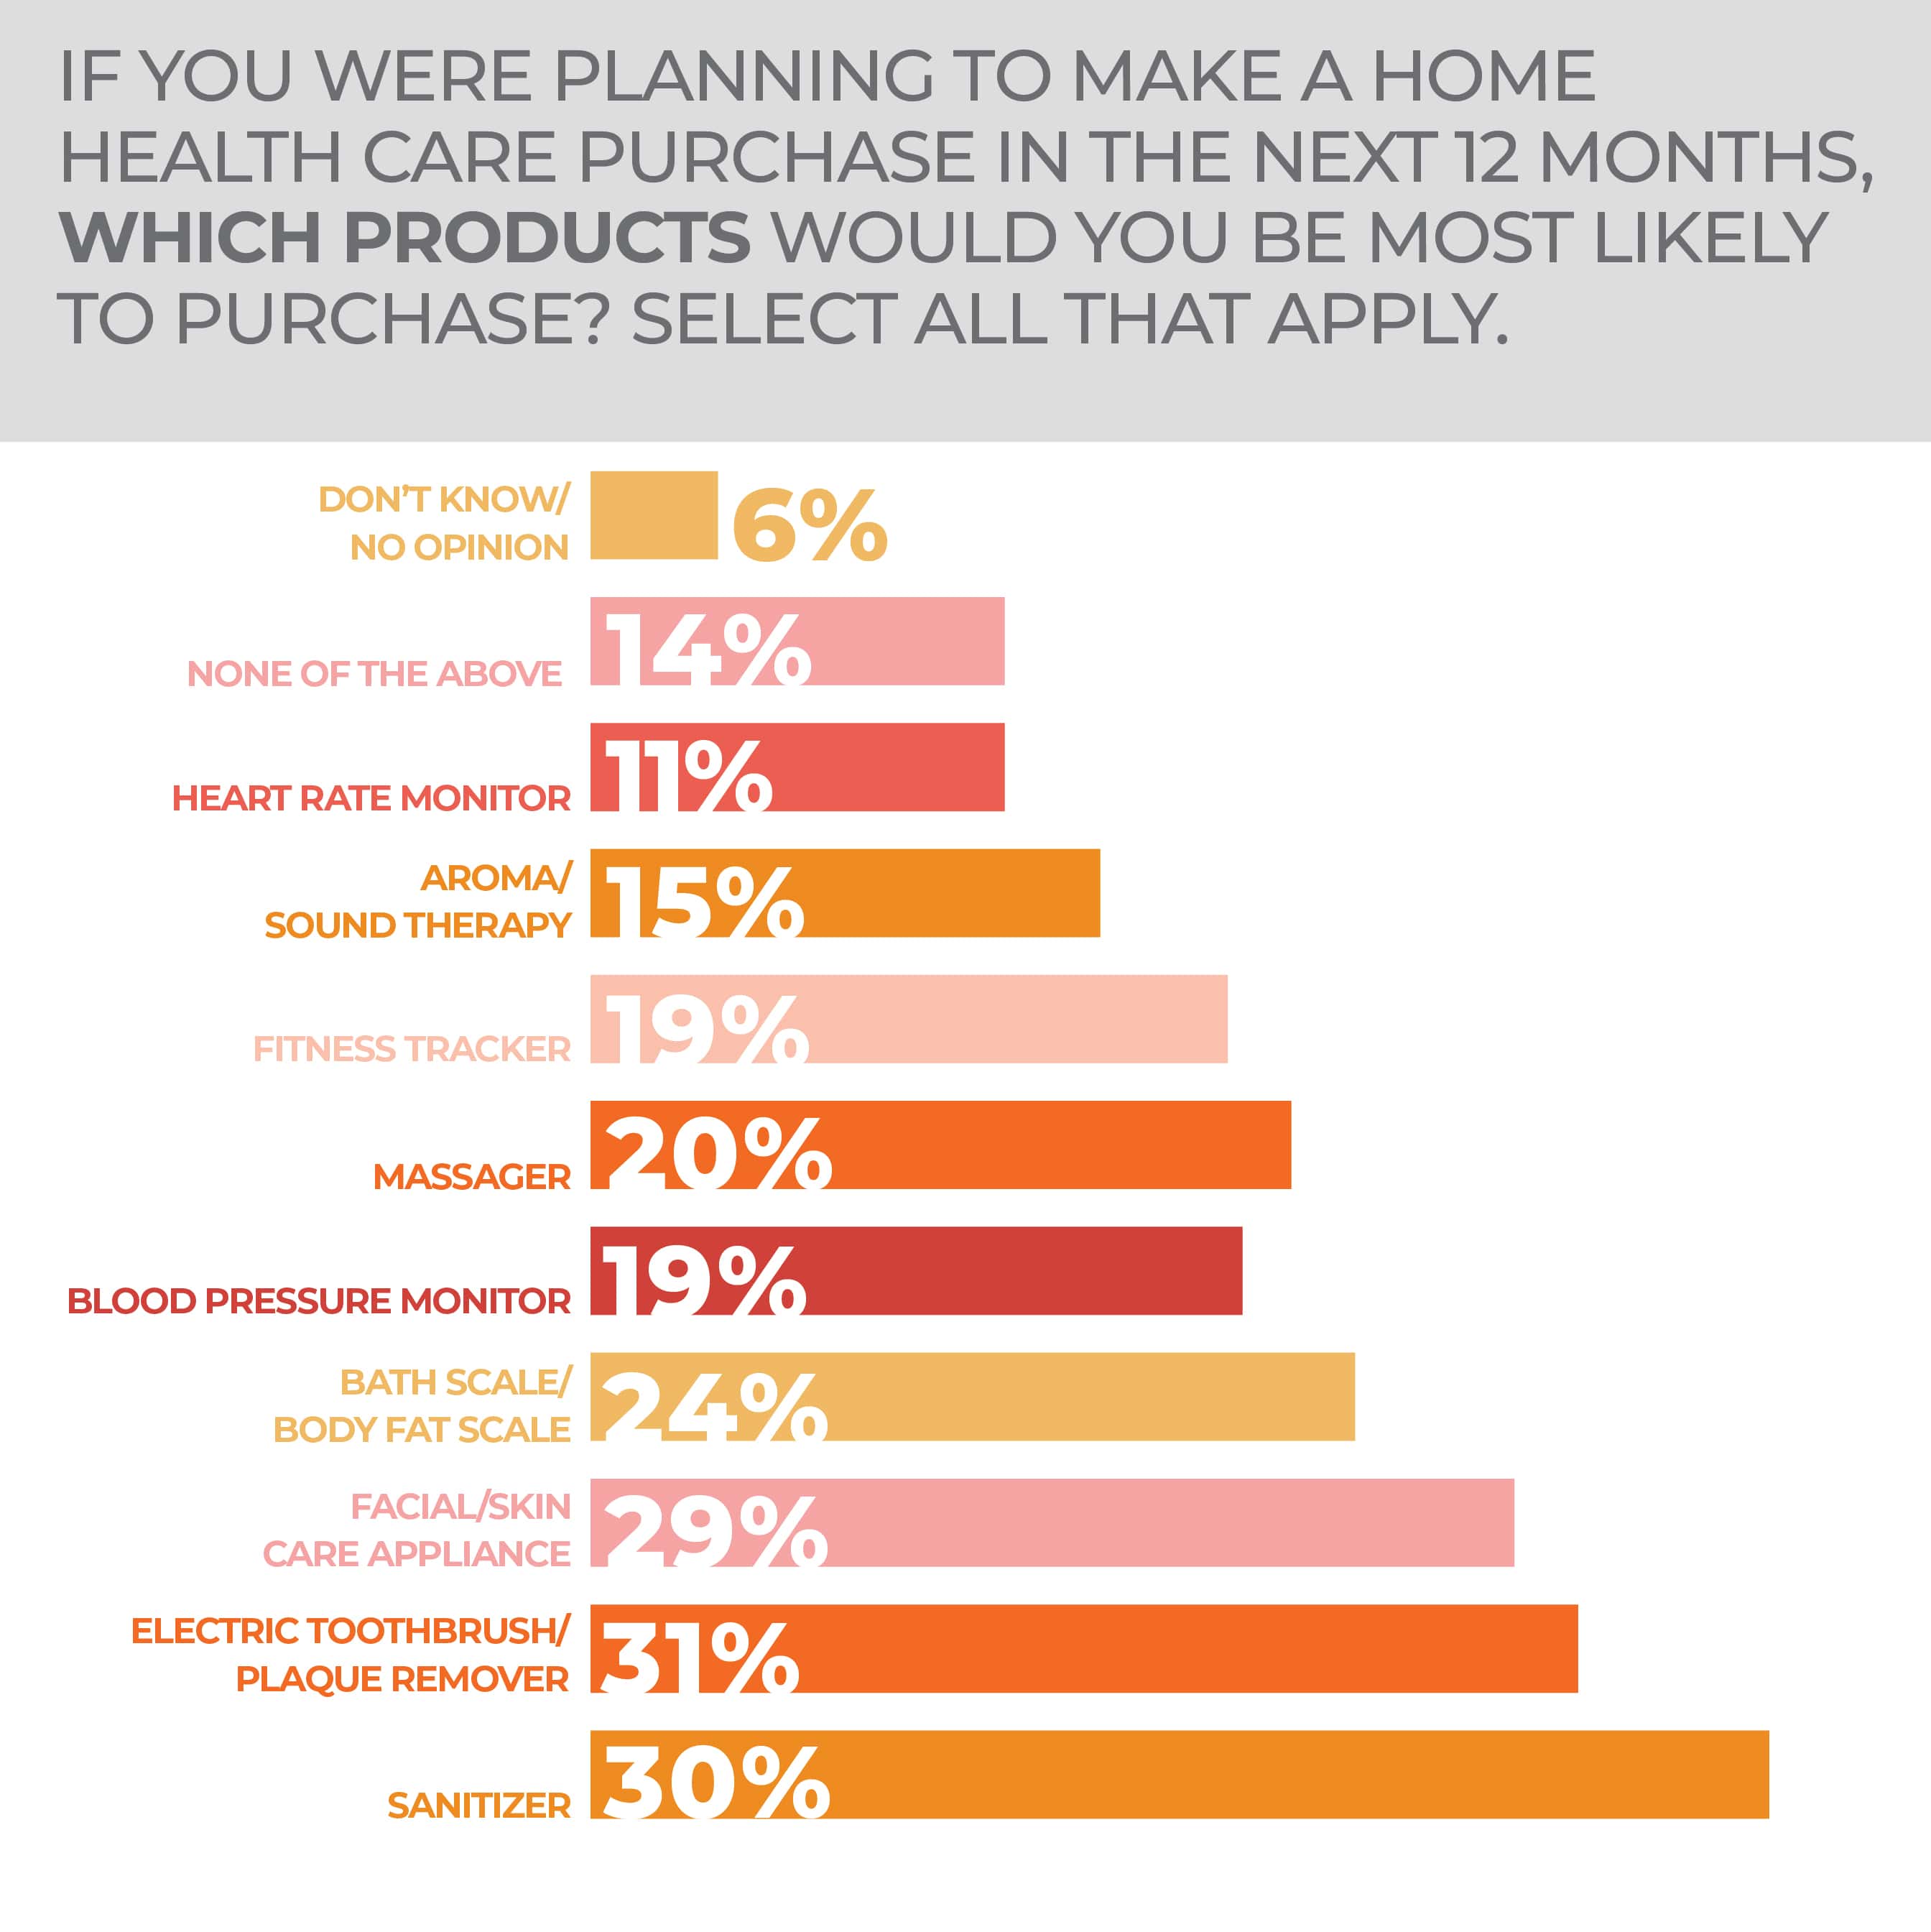
The top choice among home health care products as revealed in the survey were electric toothbrushes/plaque removers at 31%, followed by sanitizers at 30% and facial/skin care appliances at 29%. Next, bath scales/body fat scales ranked at 24% trailed by massagers at 20%, blood pressure monitors and fitness trackers tied at 19%, then aroma/sound therapy products at 15% and heart rate monitors at 11%. Year over year, the only significant movement was a four-point drop in the blood pressure monitor segment and a seven-point post-pandemic drop in the sanitizer segment. In the bath scale category, the ability to measure body fat ratio and other fitness attributes was rated as very important by 20% of consumers and somewhat important by 29%.
Women are more likely than men to purchase personal care products when it comes down to demographics at 41% very and 29% somewhat likely to do so versus 32% and 30%, respectively. Younger consumers 18-34 are most enthusiastic about purchasing in the category at 49% very and 30% somewhat likely to buy as compared to those 35-44 who are 43% very and 33% somewhat likely and those aged 45-65, who are 32% very and 29% somewhat likely to purchase. Yet, even among the oldest consumers 65 and over, almost half might contemplate a personal care purchase in the year ahead with 21% very and 26% somewhat likely to do so.
In broad terms, all regions of the United States show significant and similar purchase intent. Southerners are 39% very and 30% somewhat likely, Northeasterners are 36% very and 29% somewhat likely, Midwesterners are 36% very and 27% somewhat likely, and Westerners are 34% very and 30% somewhat likely to purchase personal care products in the coming months.
More Personal Care & Wellness Findings:
Storage & Organization
Home storage and organization is a category that is always in demand, not only because of the constant need to sort and store long term and seasonally but also because the wide range of product price points means that most people can afford something in the category when they want to tuck stuff away.
Beyond that consumers got more use out of their homes during the COVID-19 pandemic, and even if some are spending more time and money outside the household, consumers are still managing home offices, gaming areas, outdoor spaces and other domestic dimensions they expanded when they were stuck at home.
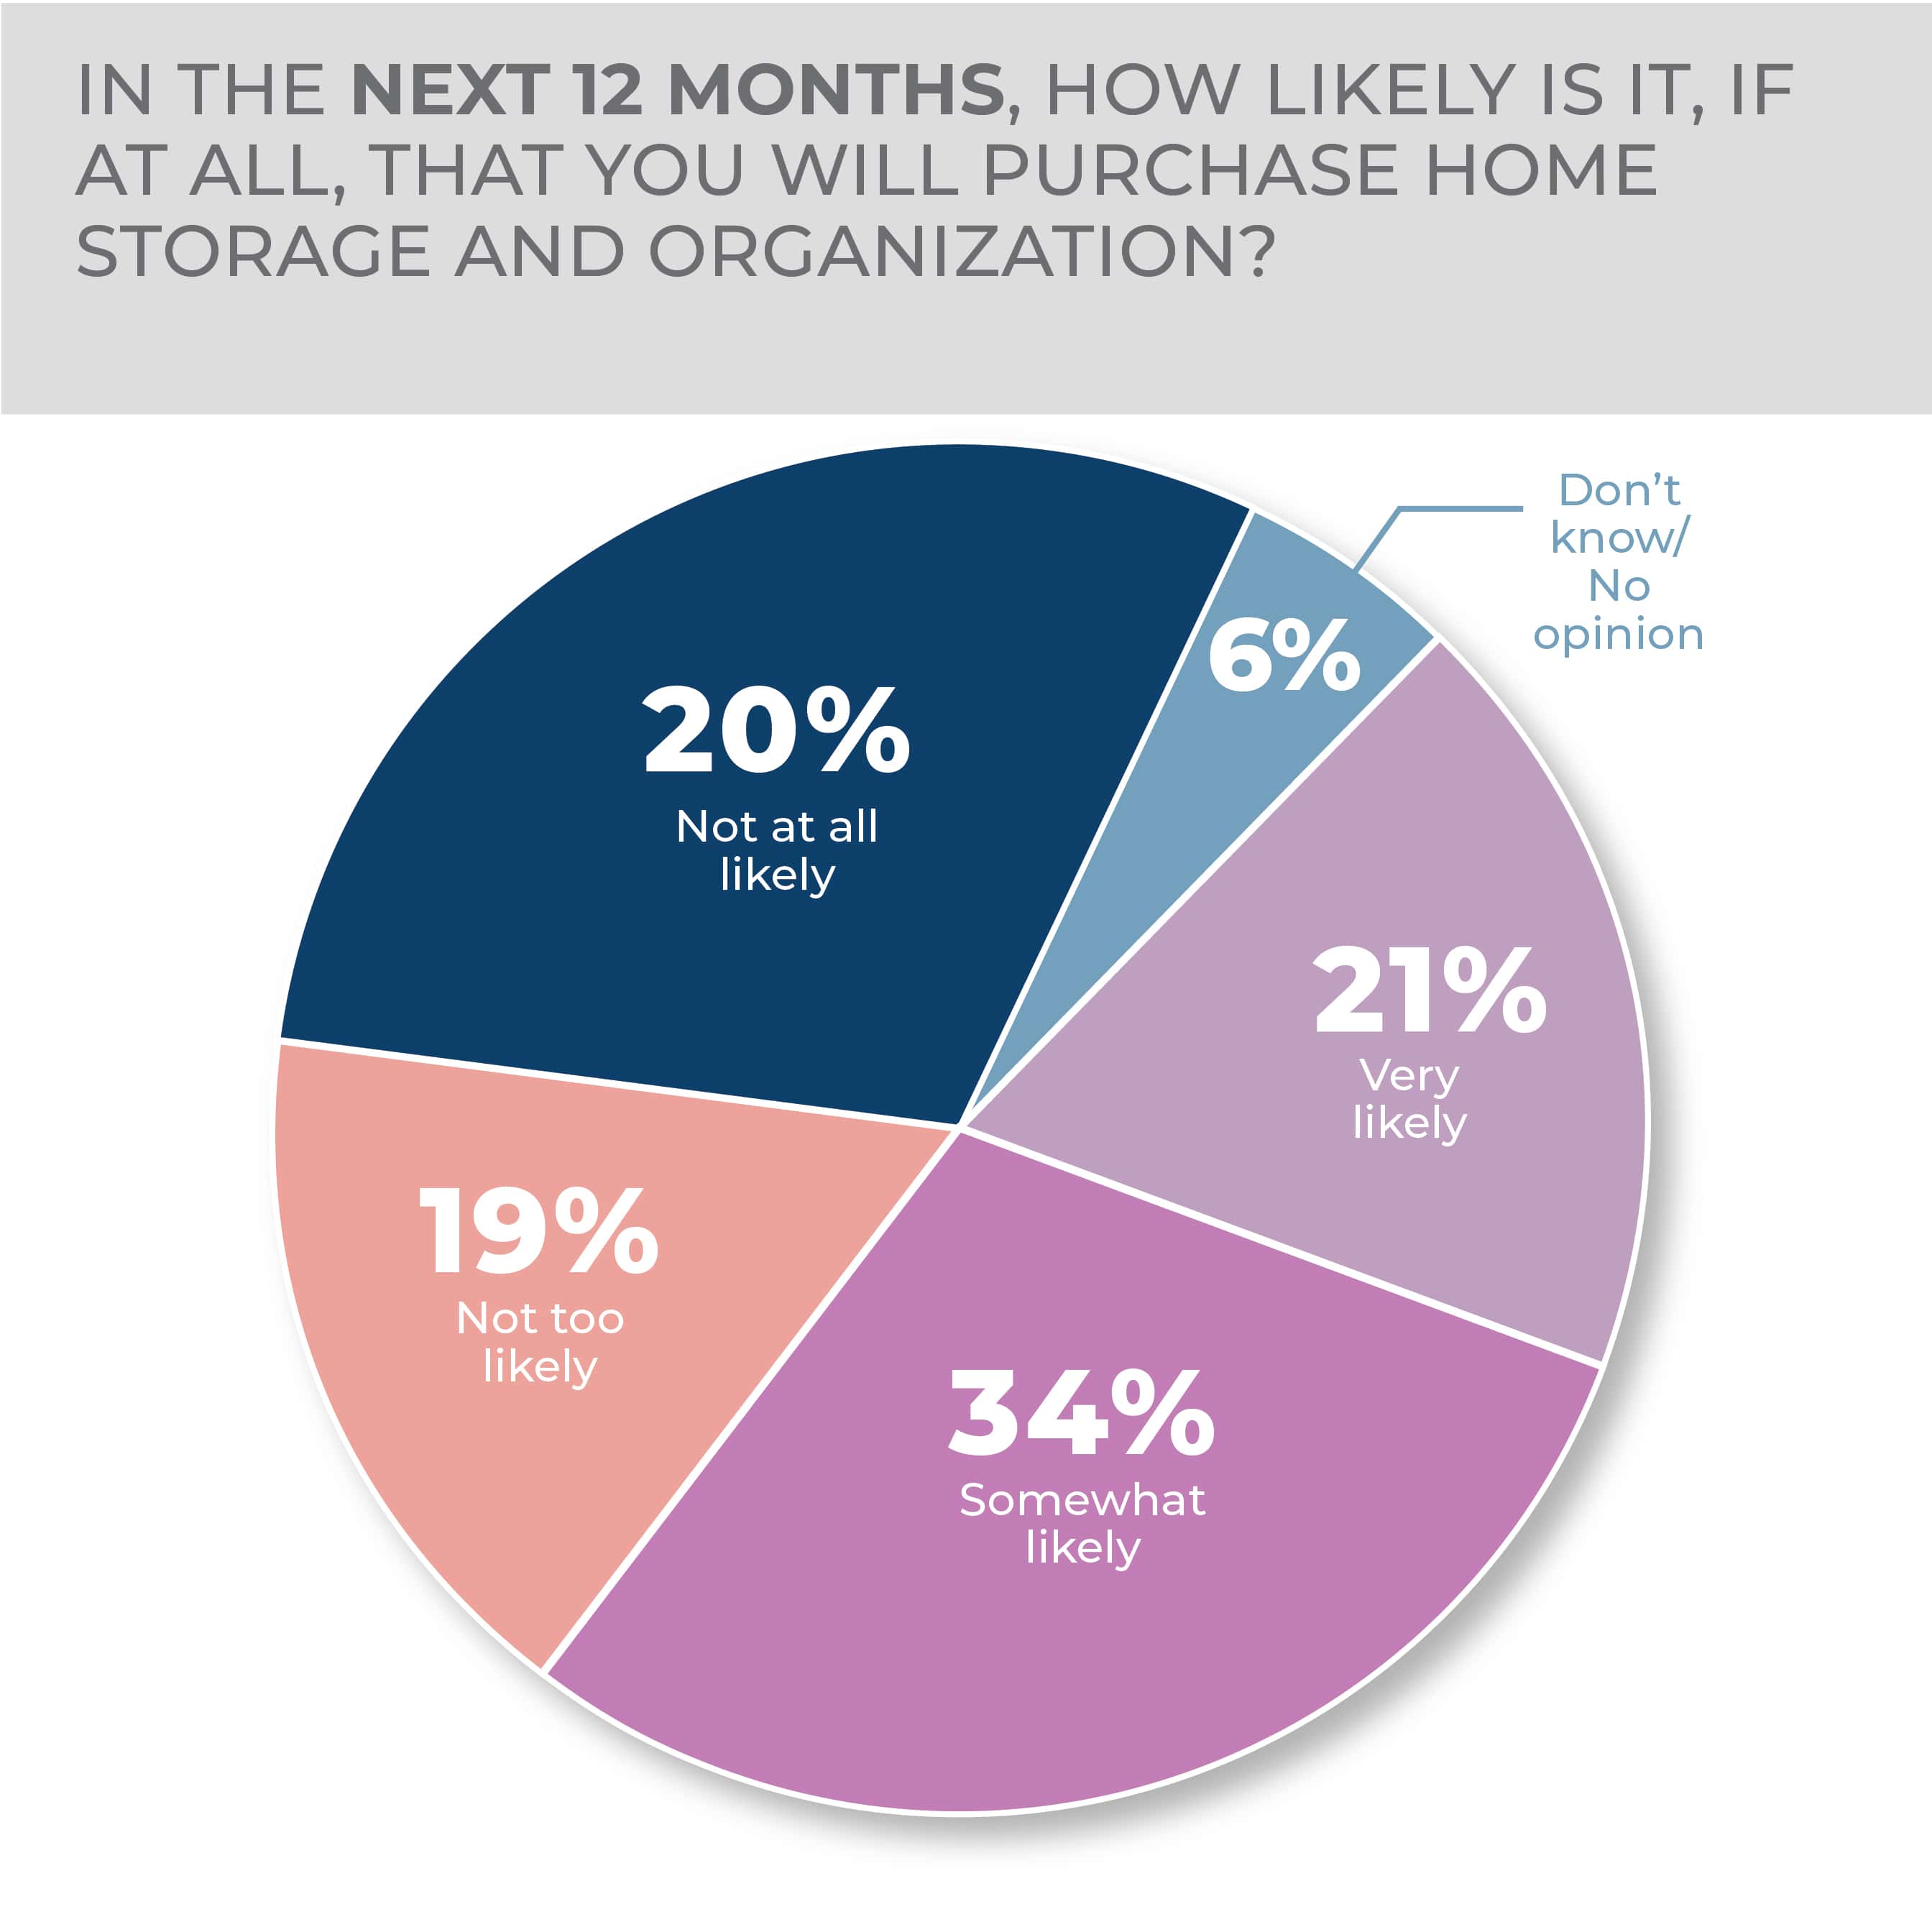
That said, it’s hardly surprising that the purchasing intentions revealed in the HomePage News 2023 Consumer Outlook Survey didn’t change much year over year. The 21% very likely and 34% somewhat likely to purchase recorded in the most recent poll is essentially flat, down a point in each case, year over year. The findings in both years are that the combined likely purchasing sentiment includes more than half of consumers. The high proportion of consumers who are at least somewhat inclined to buy storage and organization products should be understood in a broader context as such items can be an impulse or a secondary purchase following on something else bought. For example, the purchase of a desk may prompt the purchase of an organizer.
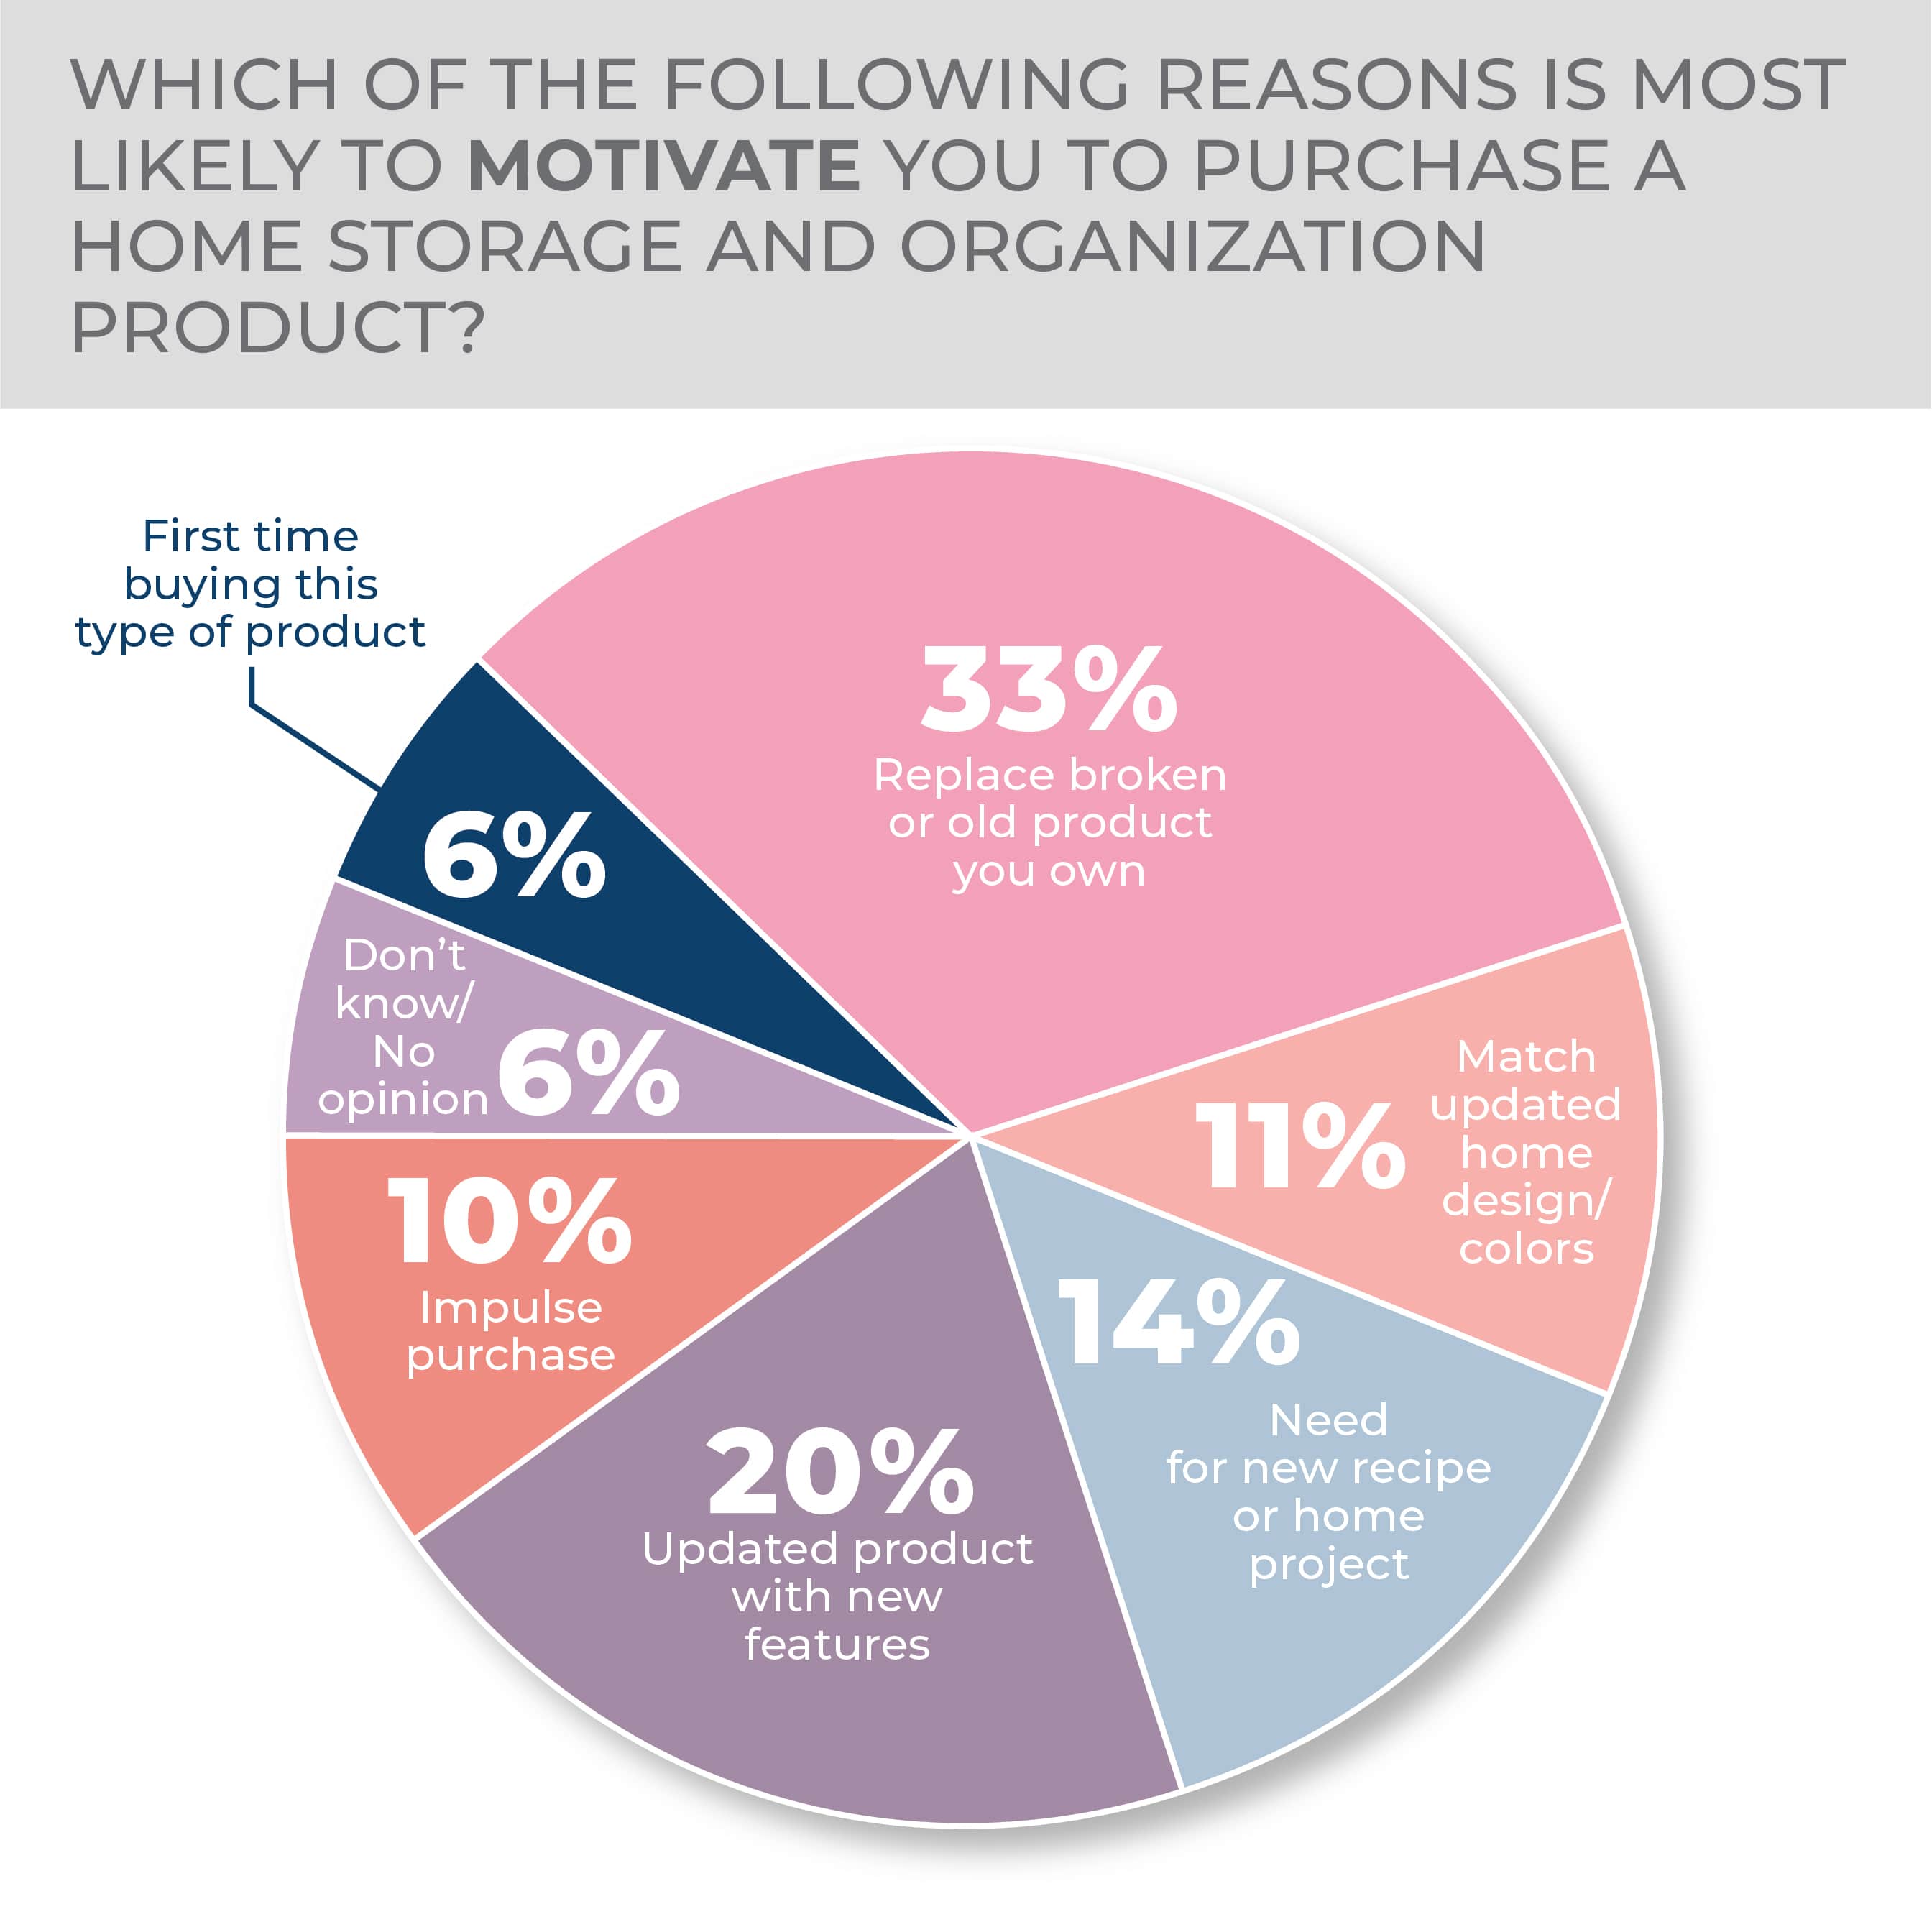
It’s also no surprise that a third of respondents to the survey were interested in a replacement product when asked about purchase motivation. Then 20% wanted storage with updated or new features and 14% because they had a home project, whether preparing a new recipe best made in bulk or reorganizing the attic. Again, the results were essentially consistent with the survey a year earlier.
-
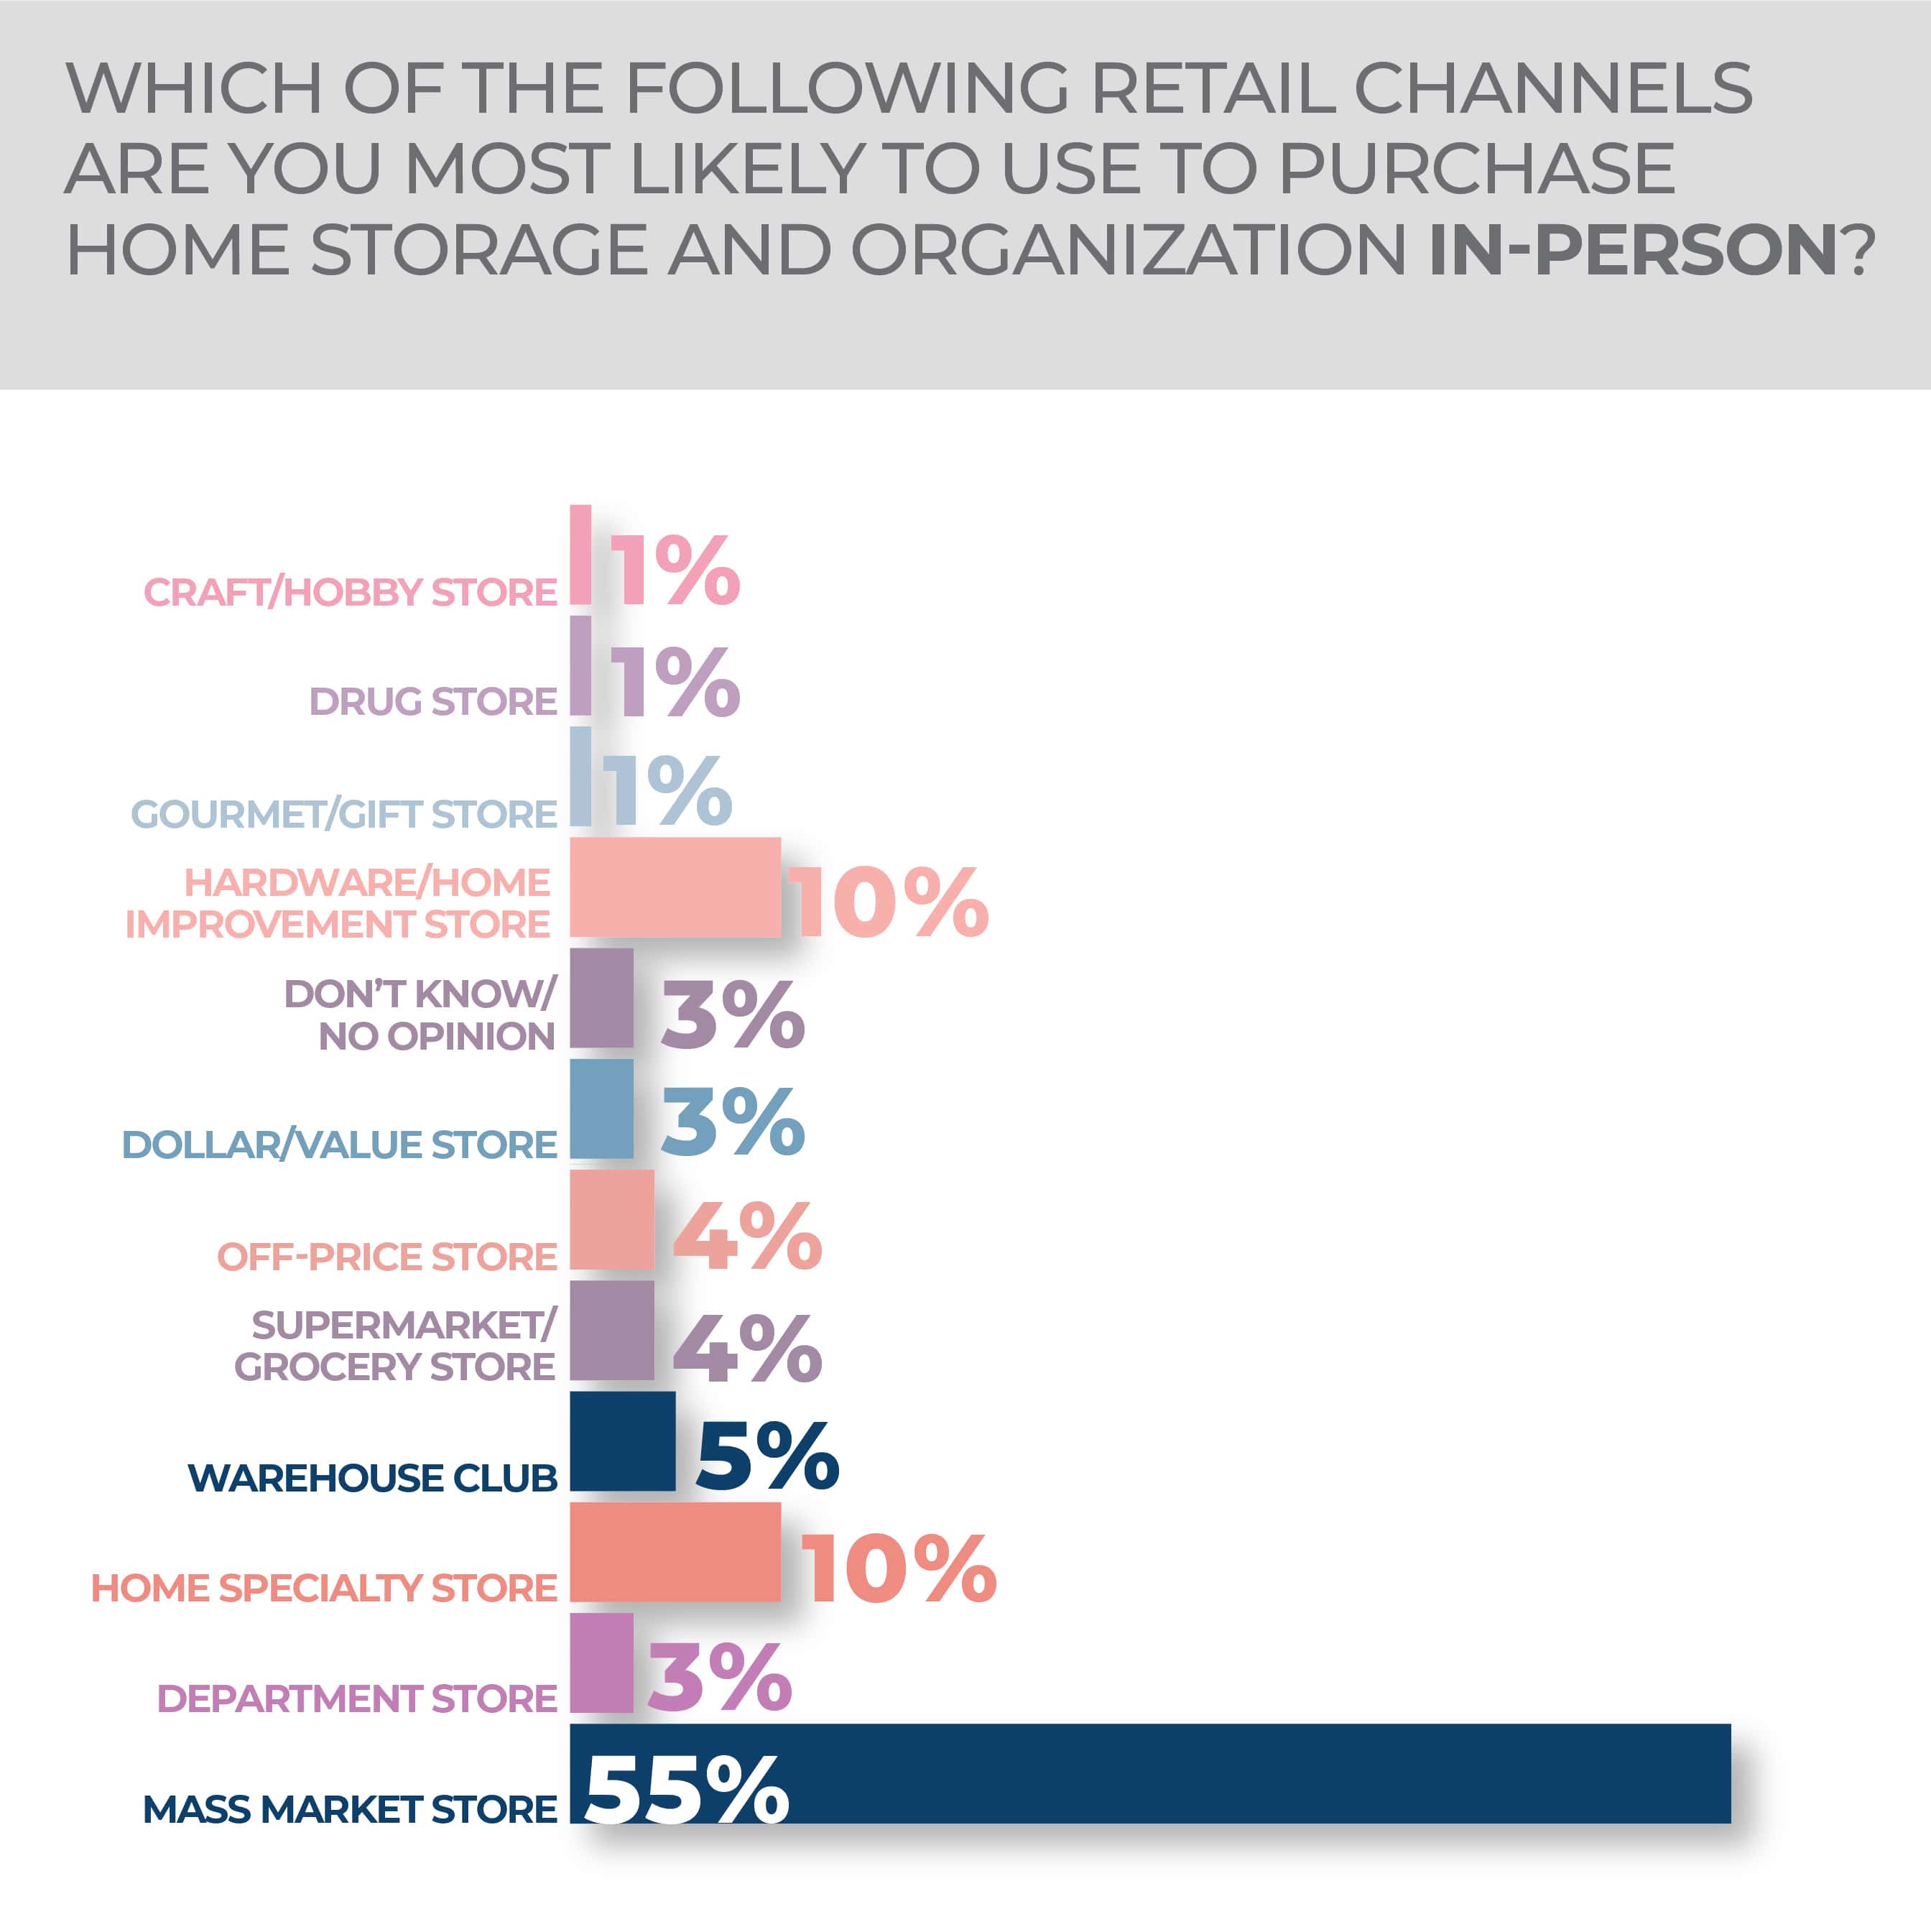
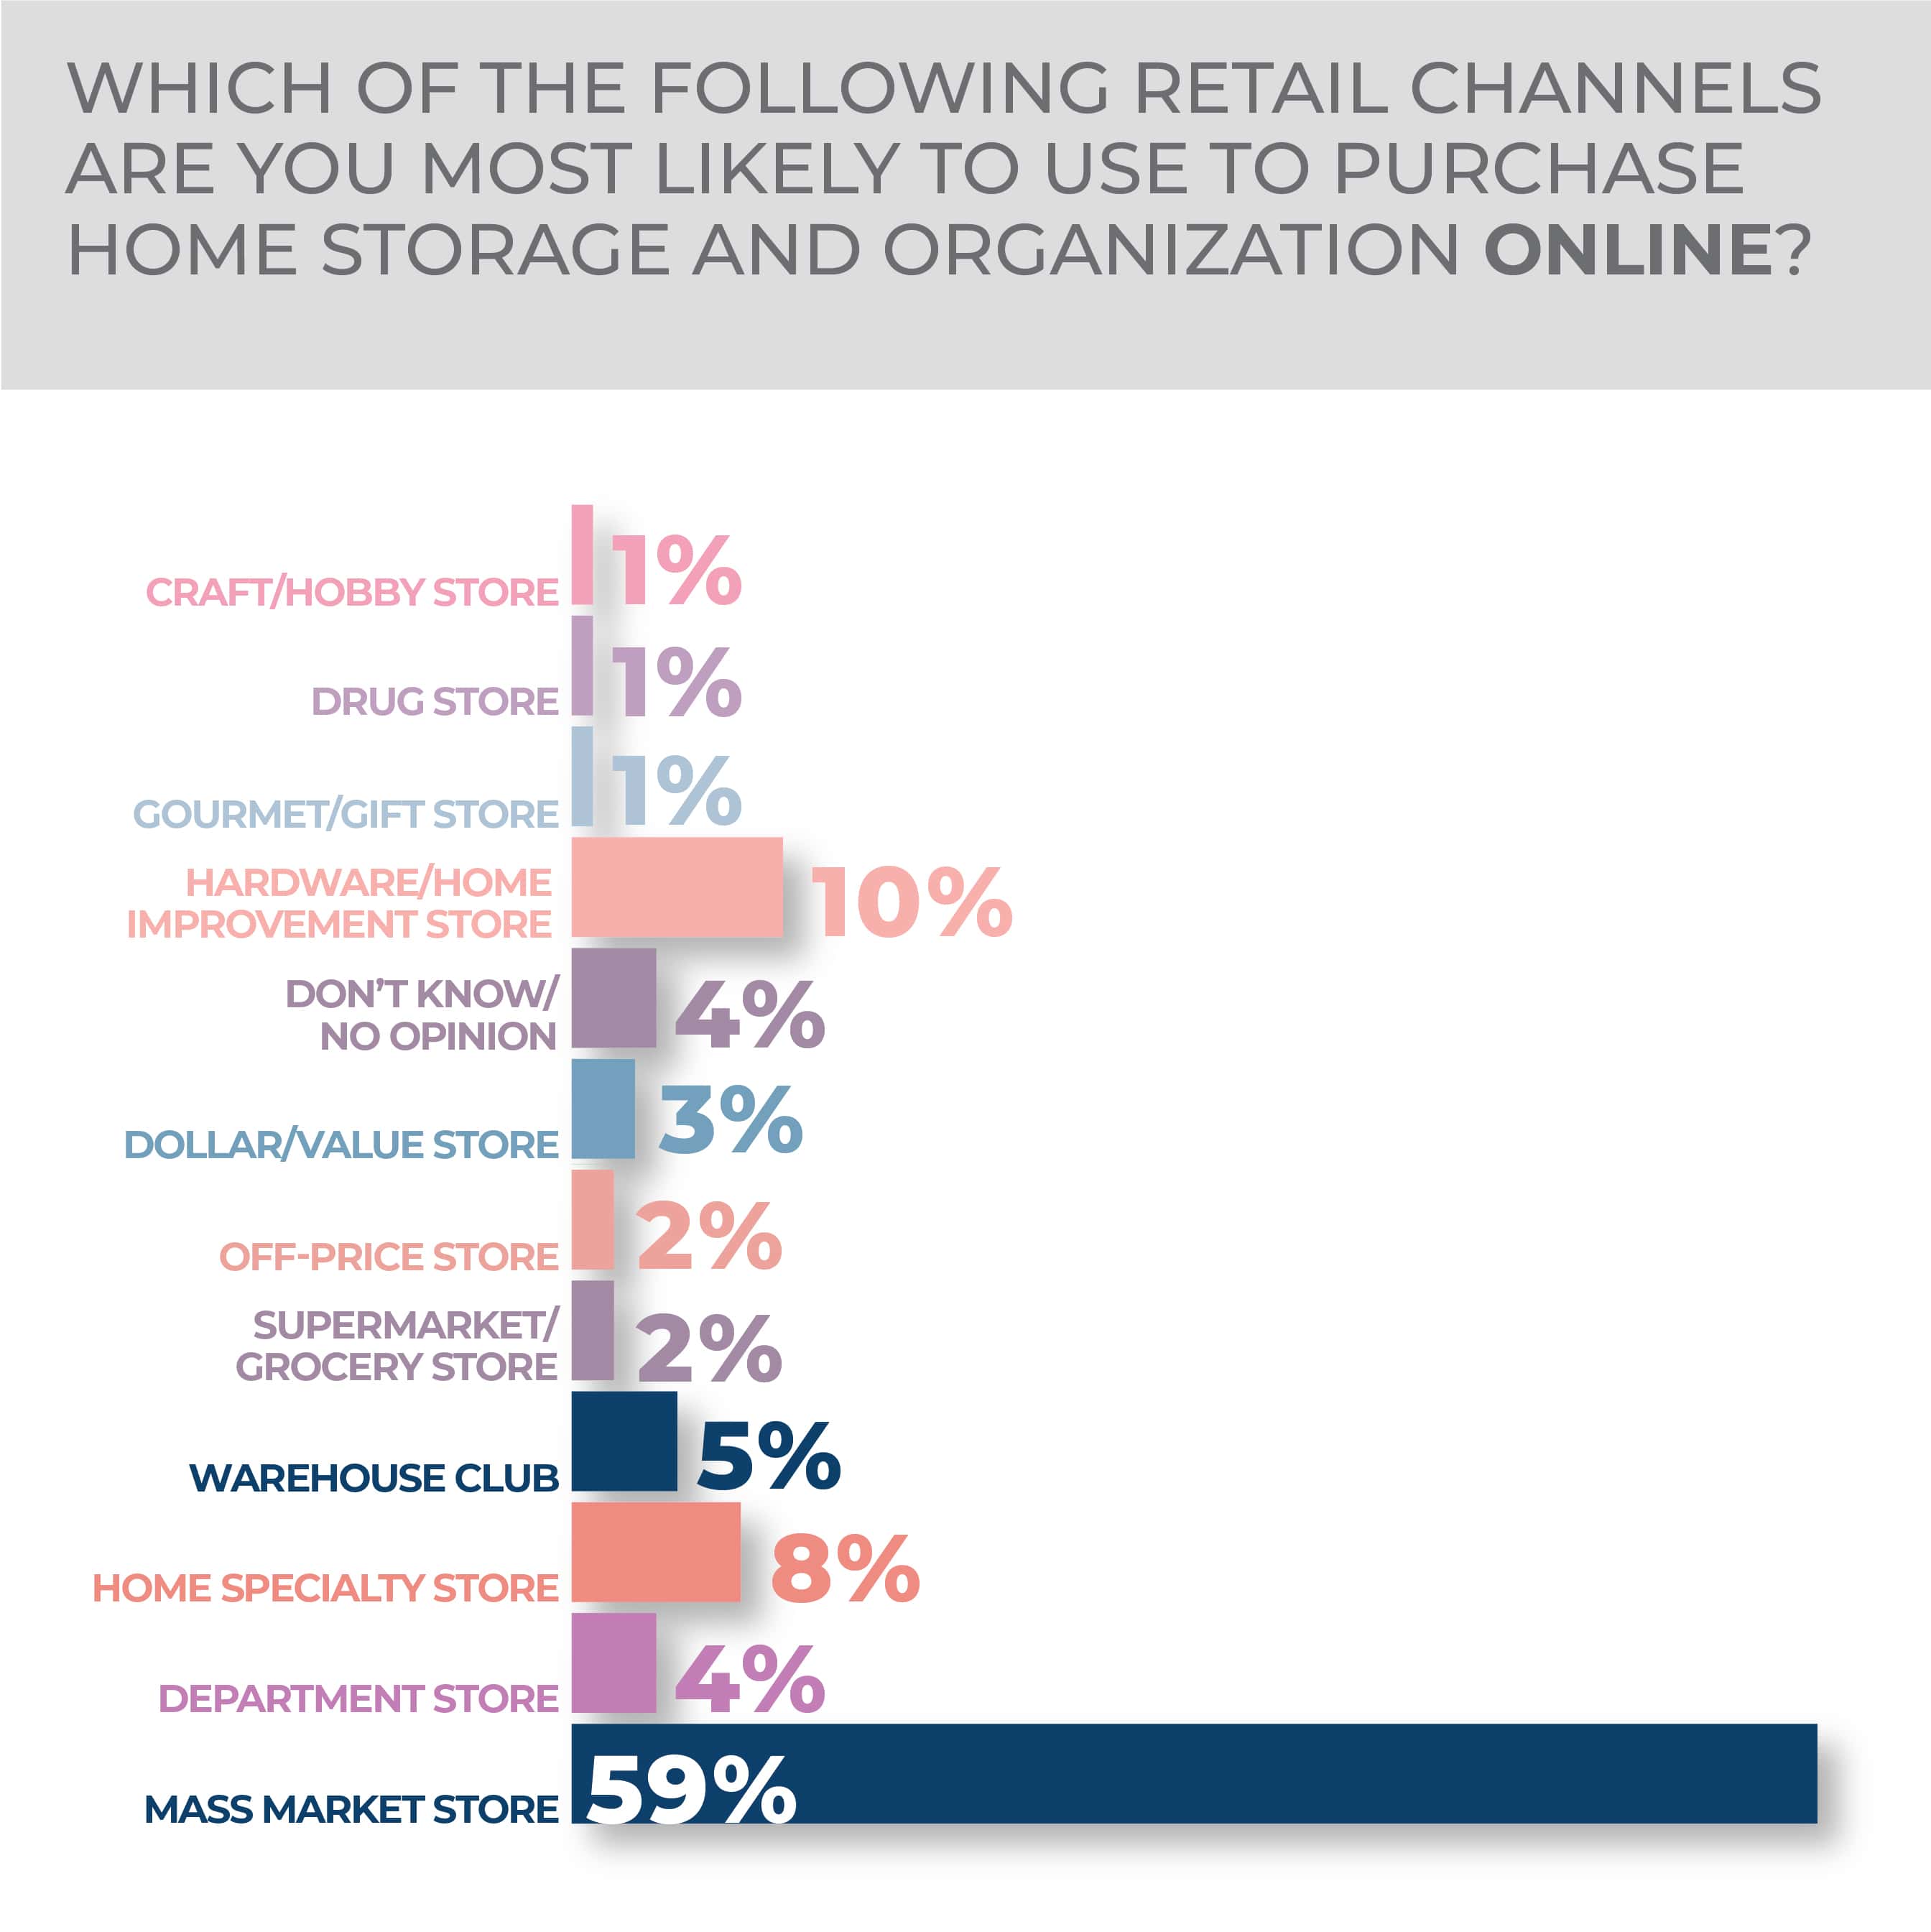
- Whether purchasing in-store or online, mass-market retailers were the overwhelming choice for home storage and organization products.
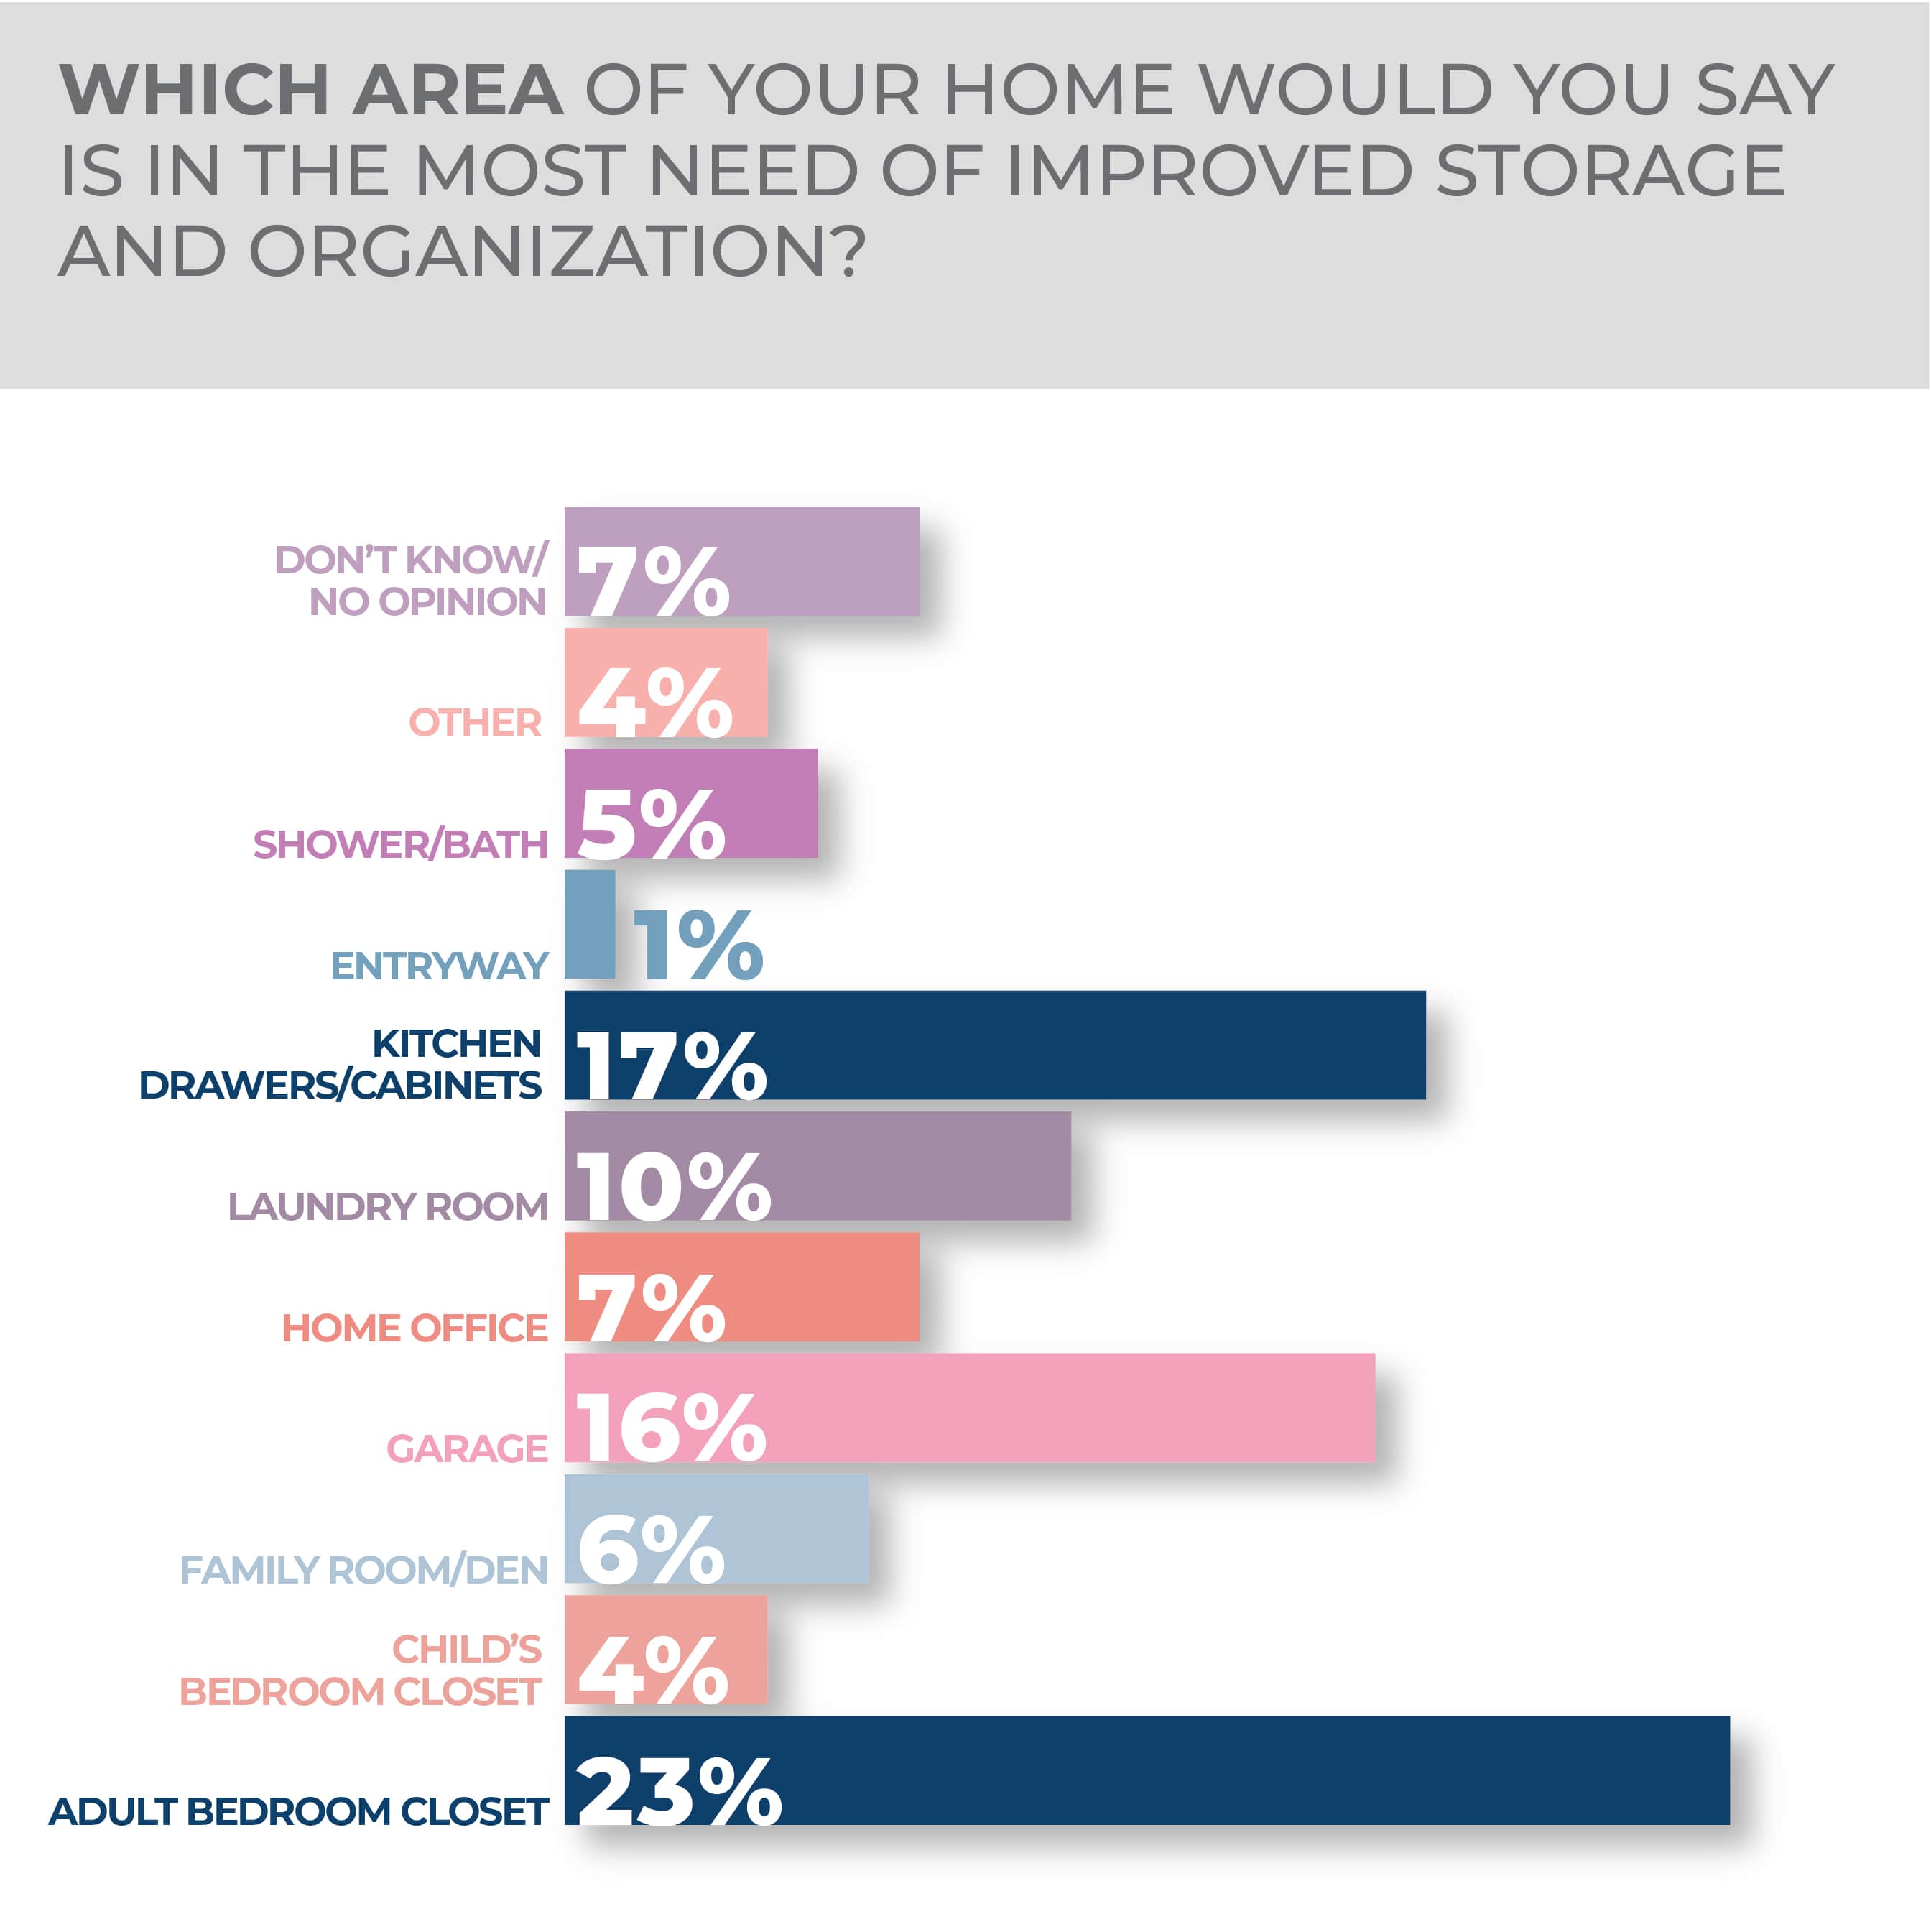
- When it comes to location, the top choices for home storage and organization purchases in the year ahead were adult bedrooms followed by kitchen cabinets.
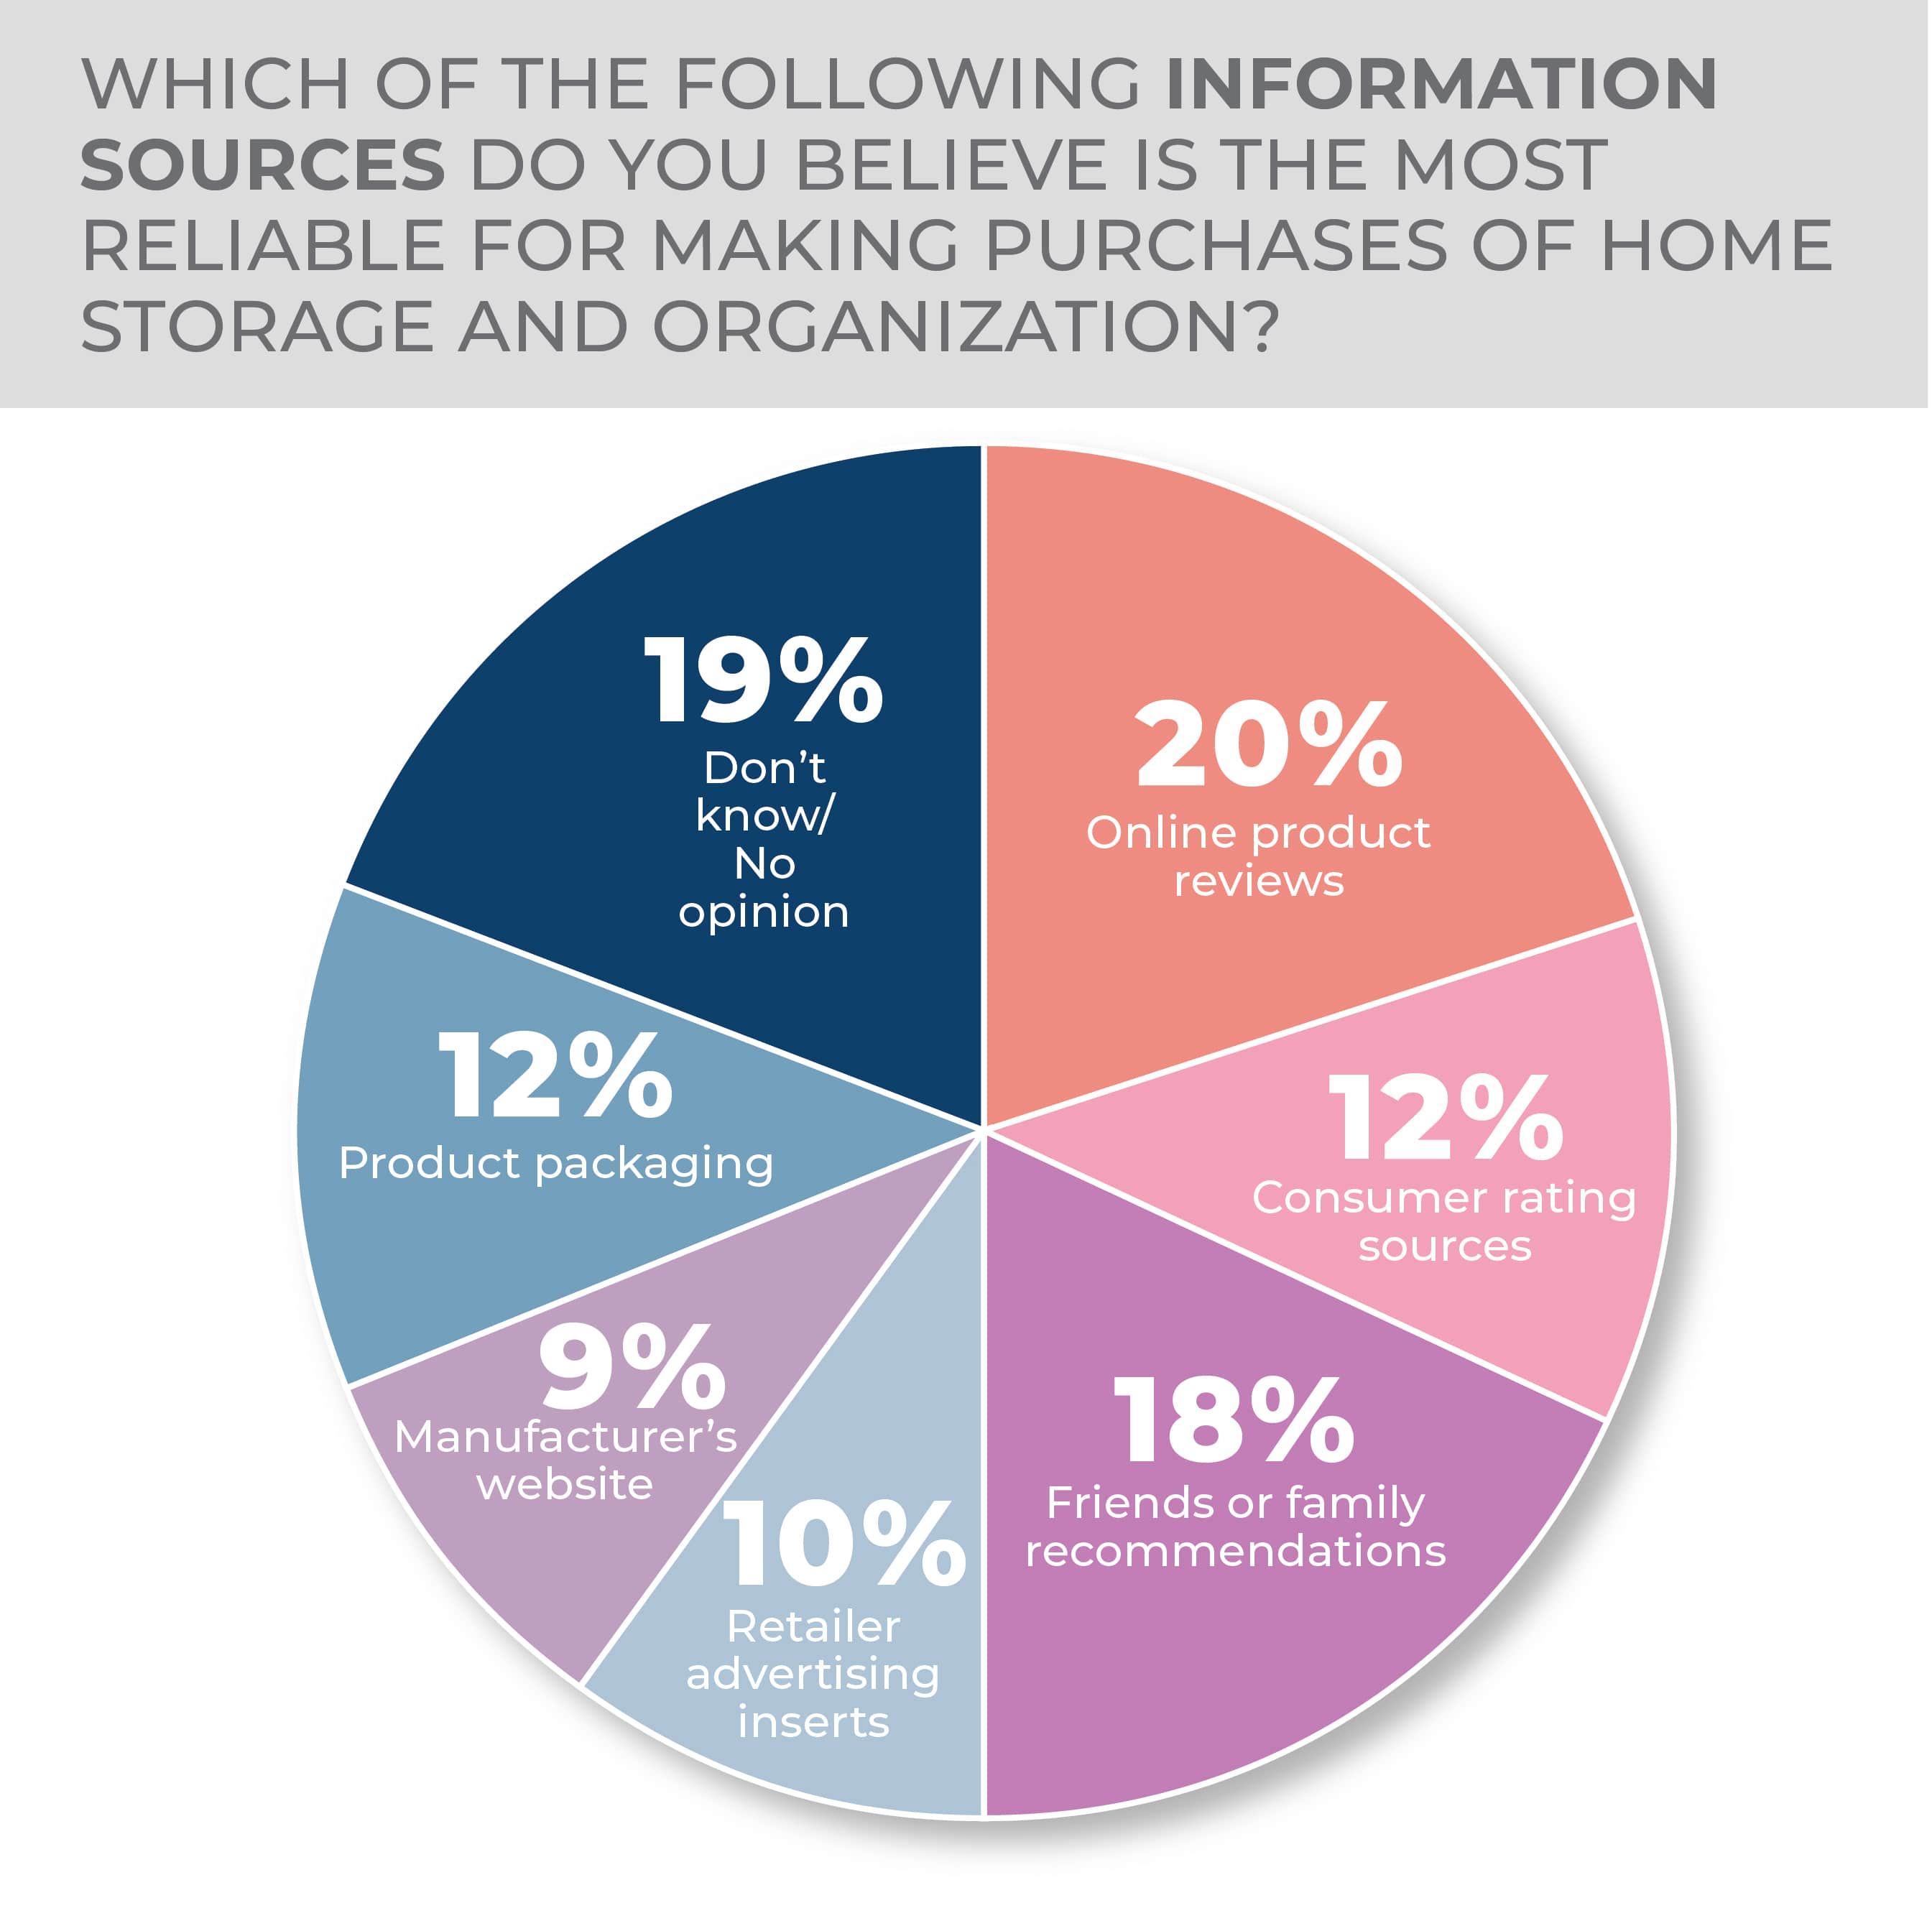
The top information sources slipped a few points in the study results year over year while manufacturers’ websites and product packaging gained a bit. As they were a year prior, online product reviews were the top choice for product information at 20% followed by friends or family recommendations at 18%, consumer ratings sources and product packaging, tied at 12%, retailer advertising inserts came in at 10%, and manufacturers’ websites at 9%.
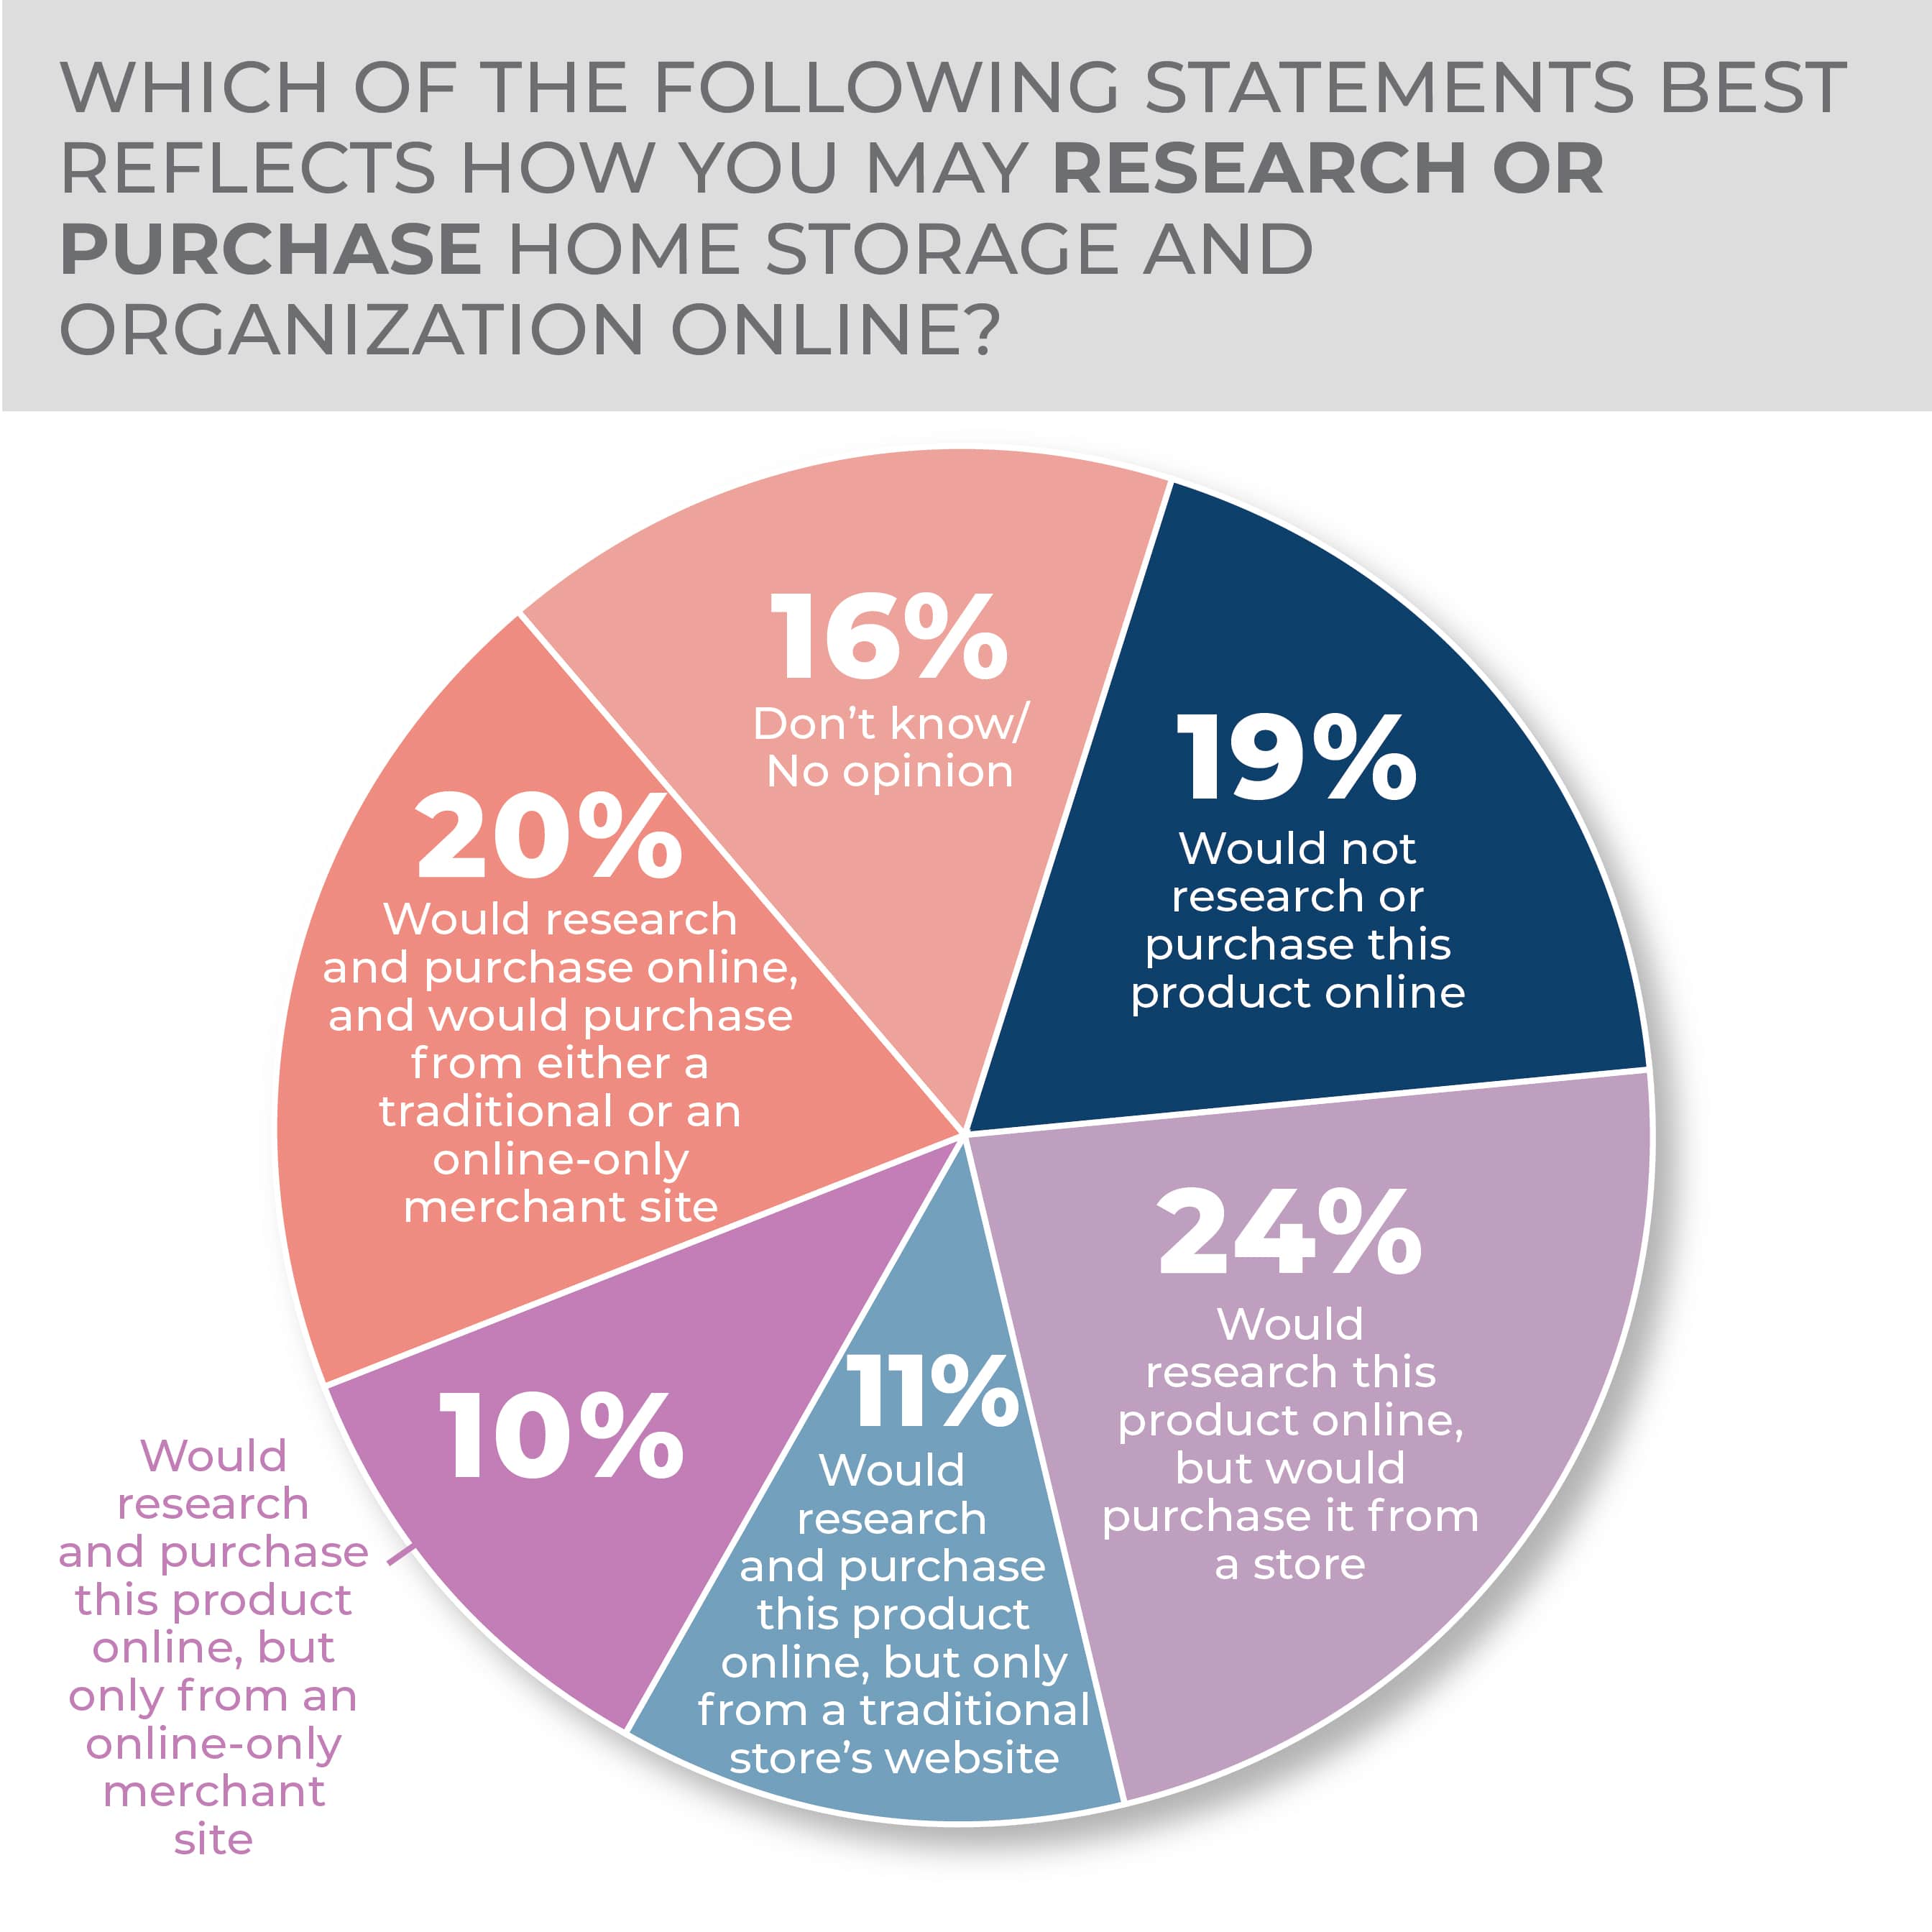
What hasn’t changed at all from one year to the next is a slight lean toward in-store purchasing and at approximately the same proportions from the year-previous study, with research online, purchase in-store topping the responses at 24% and would not research or purchase this product online coming in third at 19% for a total of approximately 43%. In second, 20% of consumers said they would research and purchase a product online from a traditional store or online-only merchant, then 11% said they would research and purchase online but only from a traditional store’s website and 10% said they would research online and buy from an online-only store, for a combined 41%. The rest didn’t know or didn’t have an opinion.
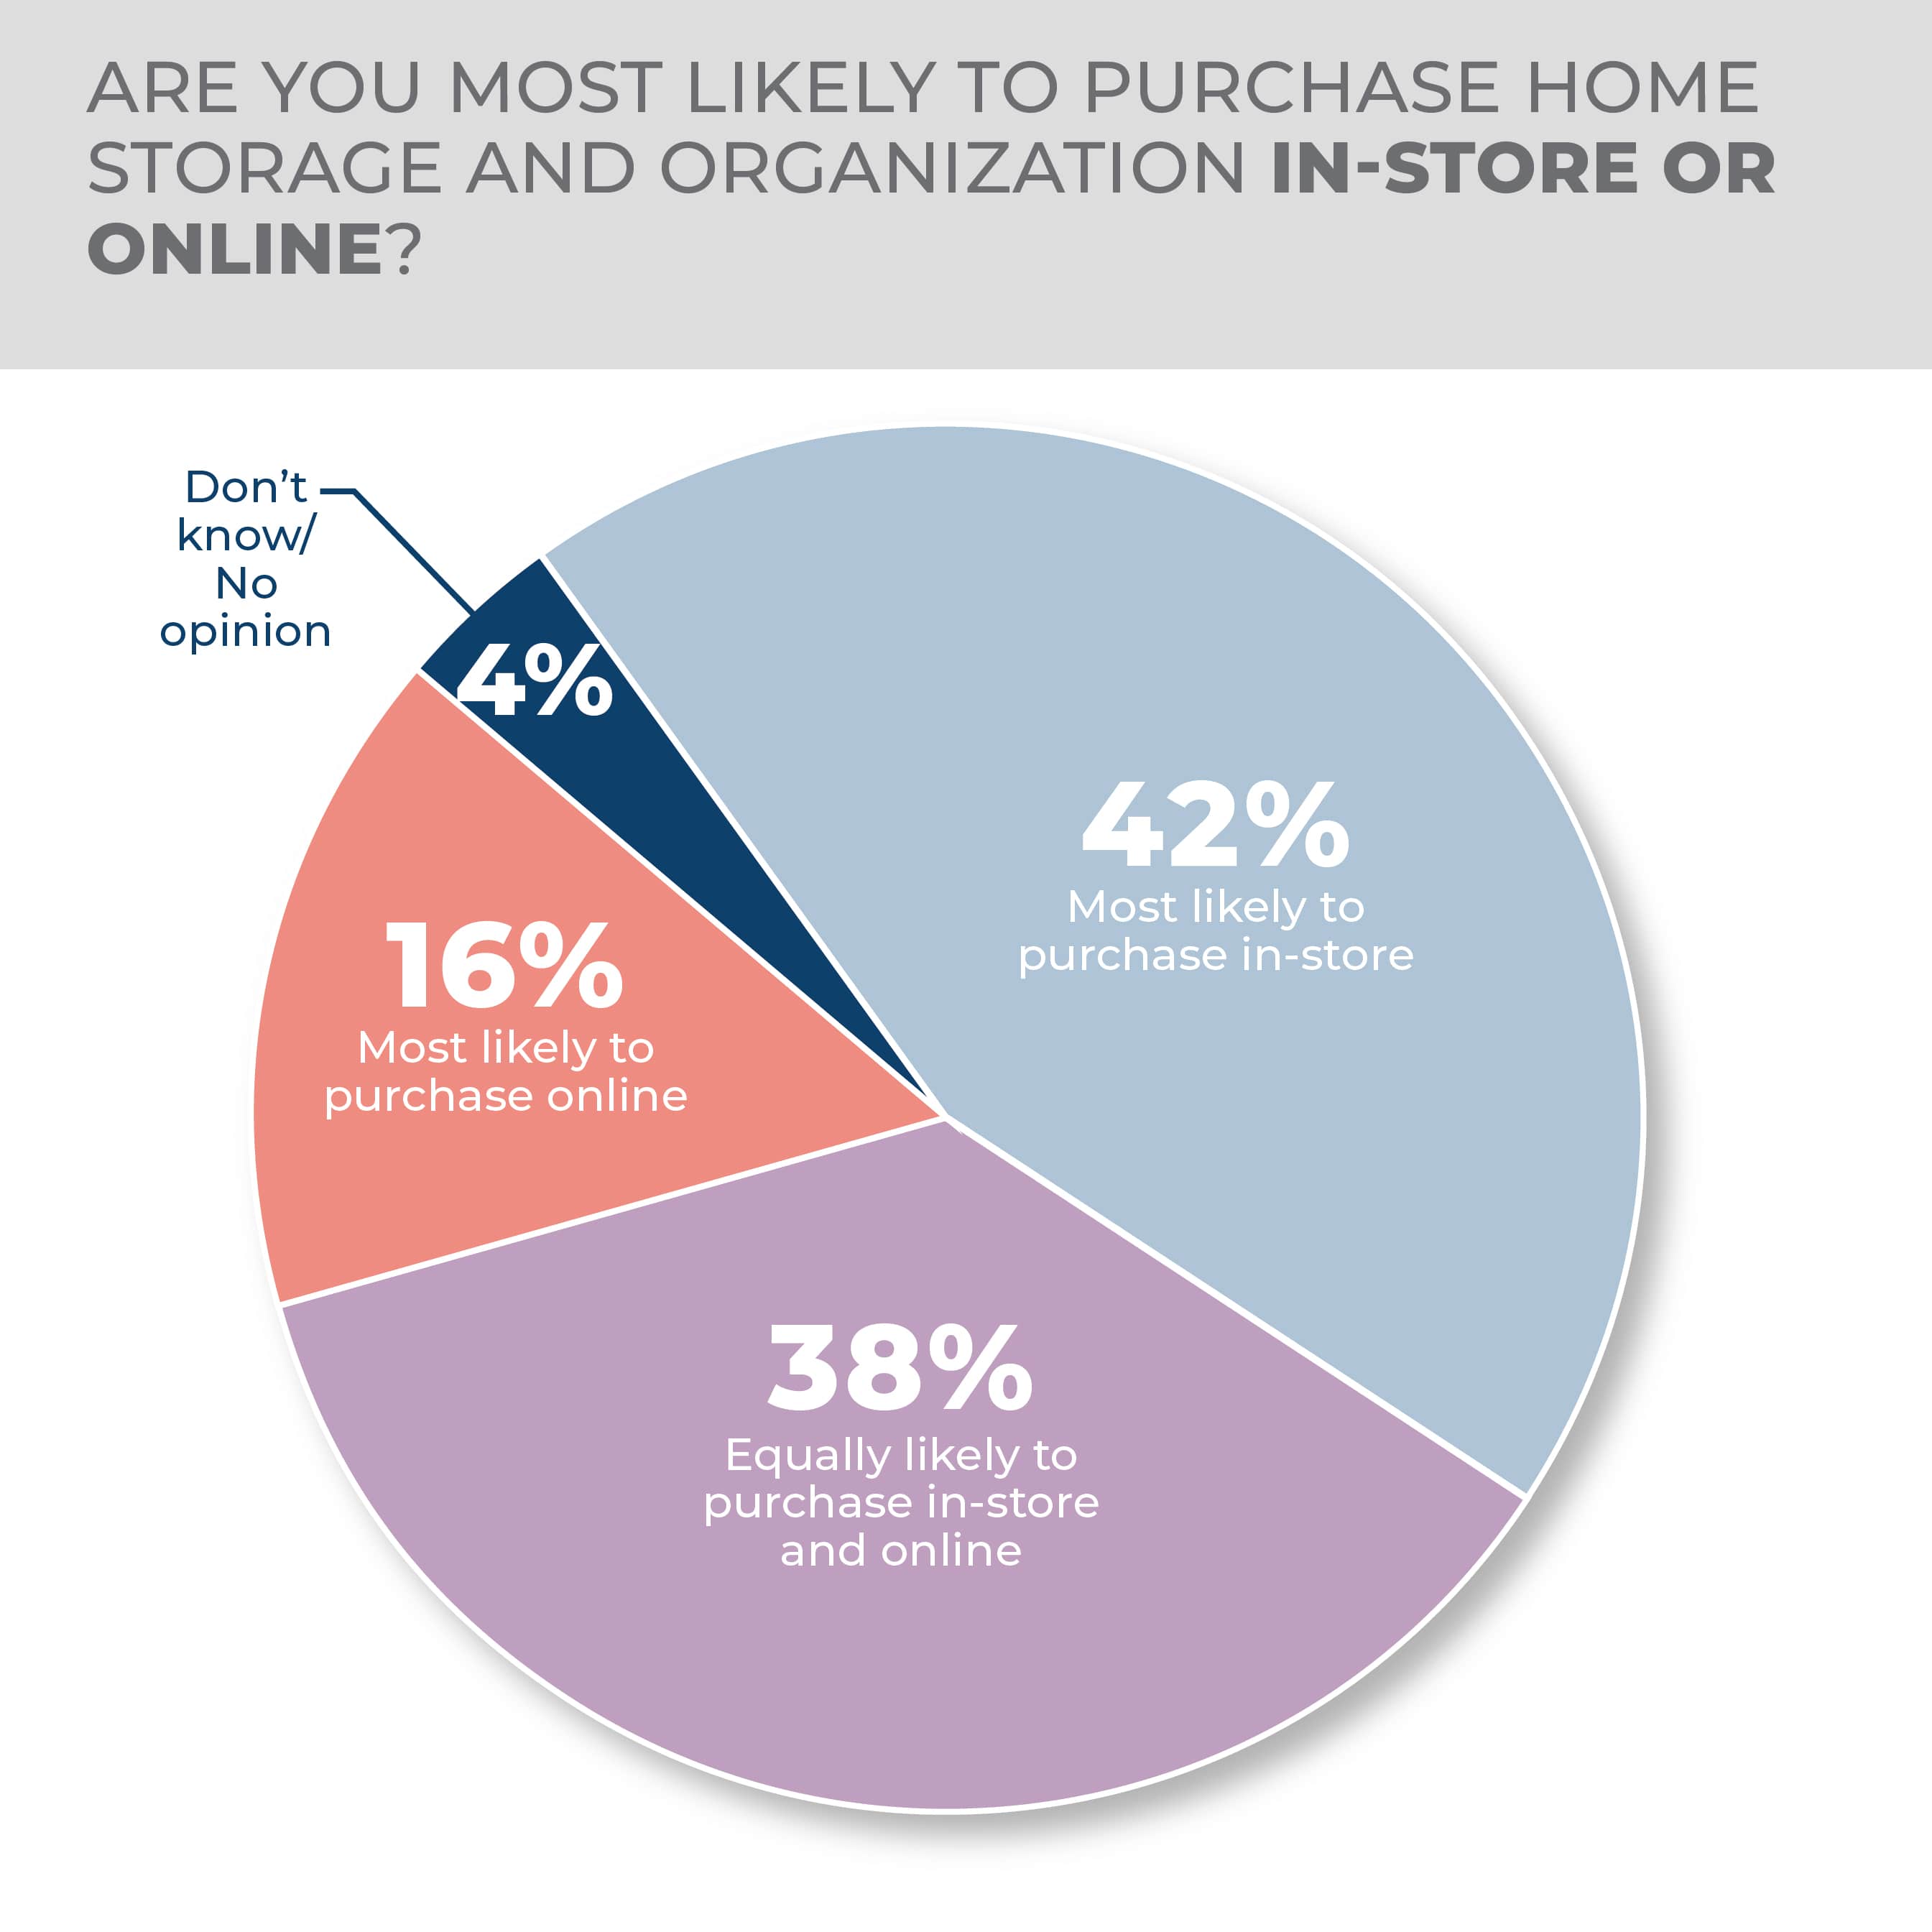
When asked about their preference specifically, the numbers fell more or less in line regarding purchase destination with 42% of consumers saying they would most likely buy in-store, 38% online or in-store and only 16% saying they were primarily interested in buying online.
When asked where they would most likely buy in person, 55% said a mass merchant with hardware/home improvement stores and home specialty stores coming in a distant second at 10% with no other channel of retail above 5%. Mass market was even more dominant online, with 59% making it their first choice for storage and organization purchases, with home improvement/home storage at 10%, home specialty at 8%, and, again, no other channel above 5%.
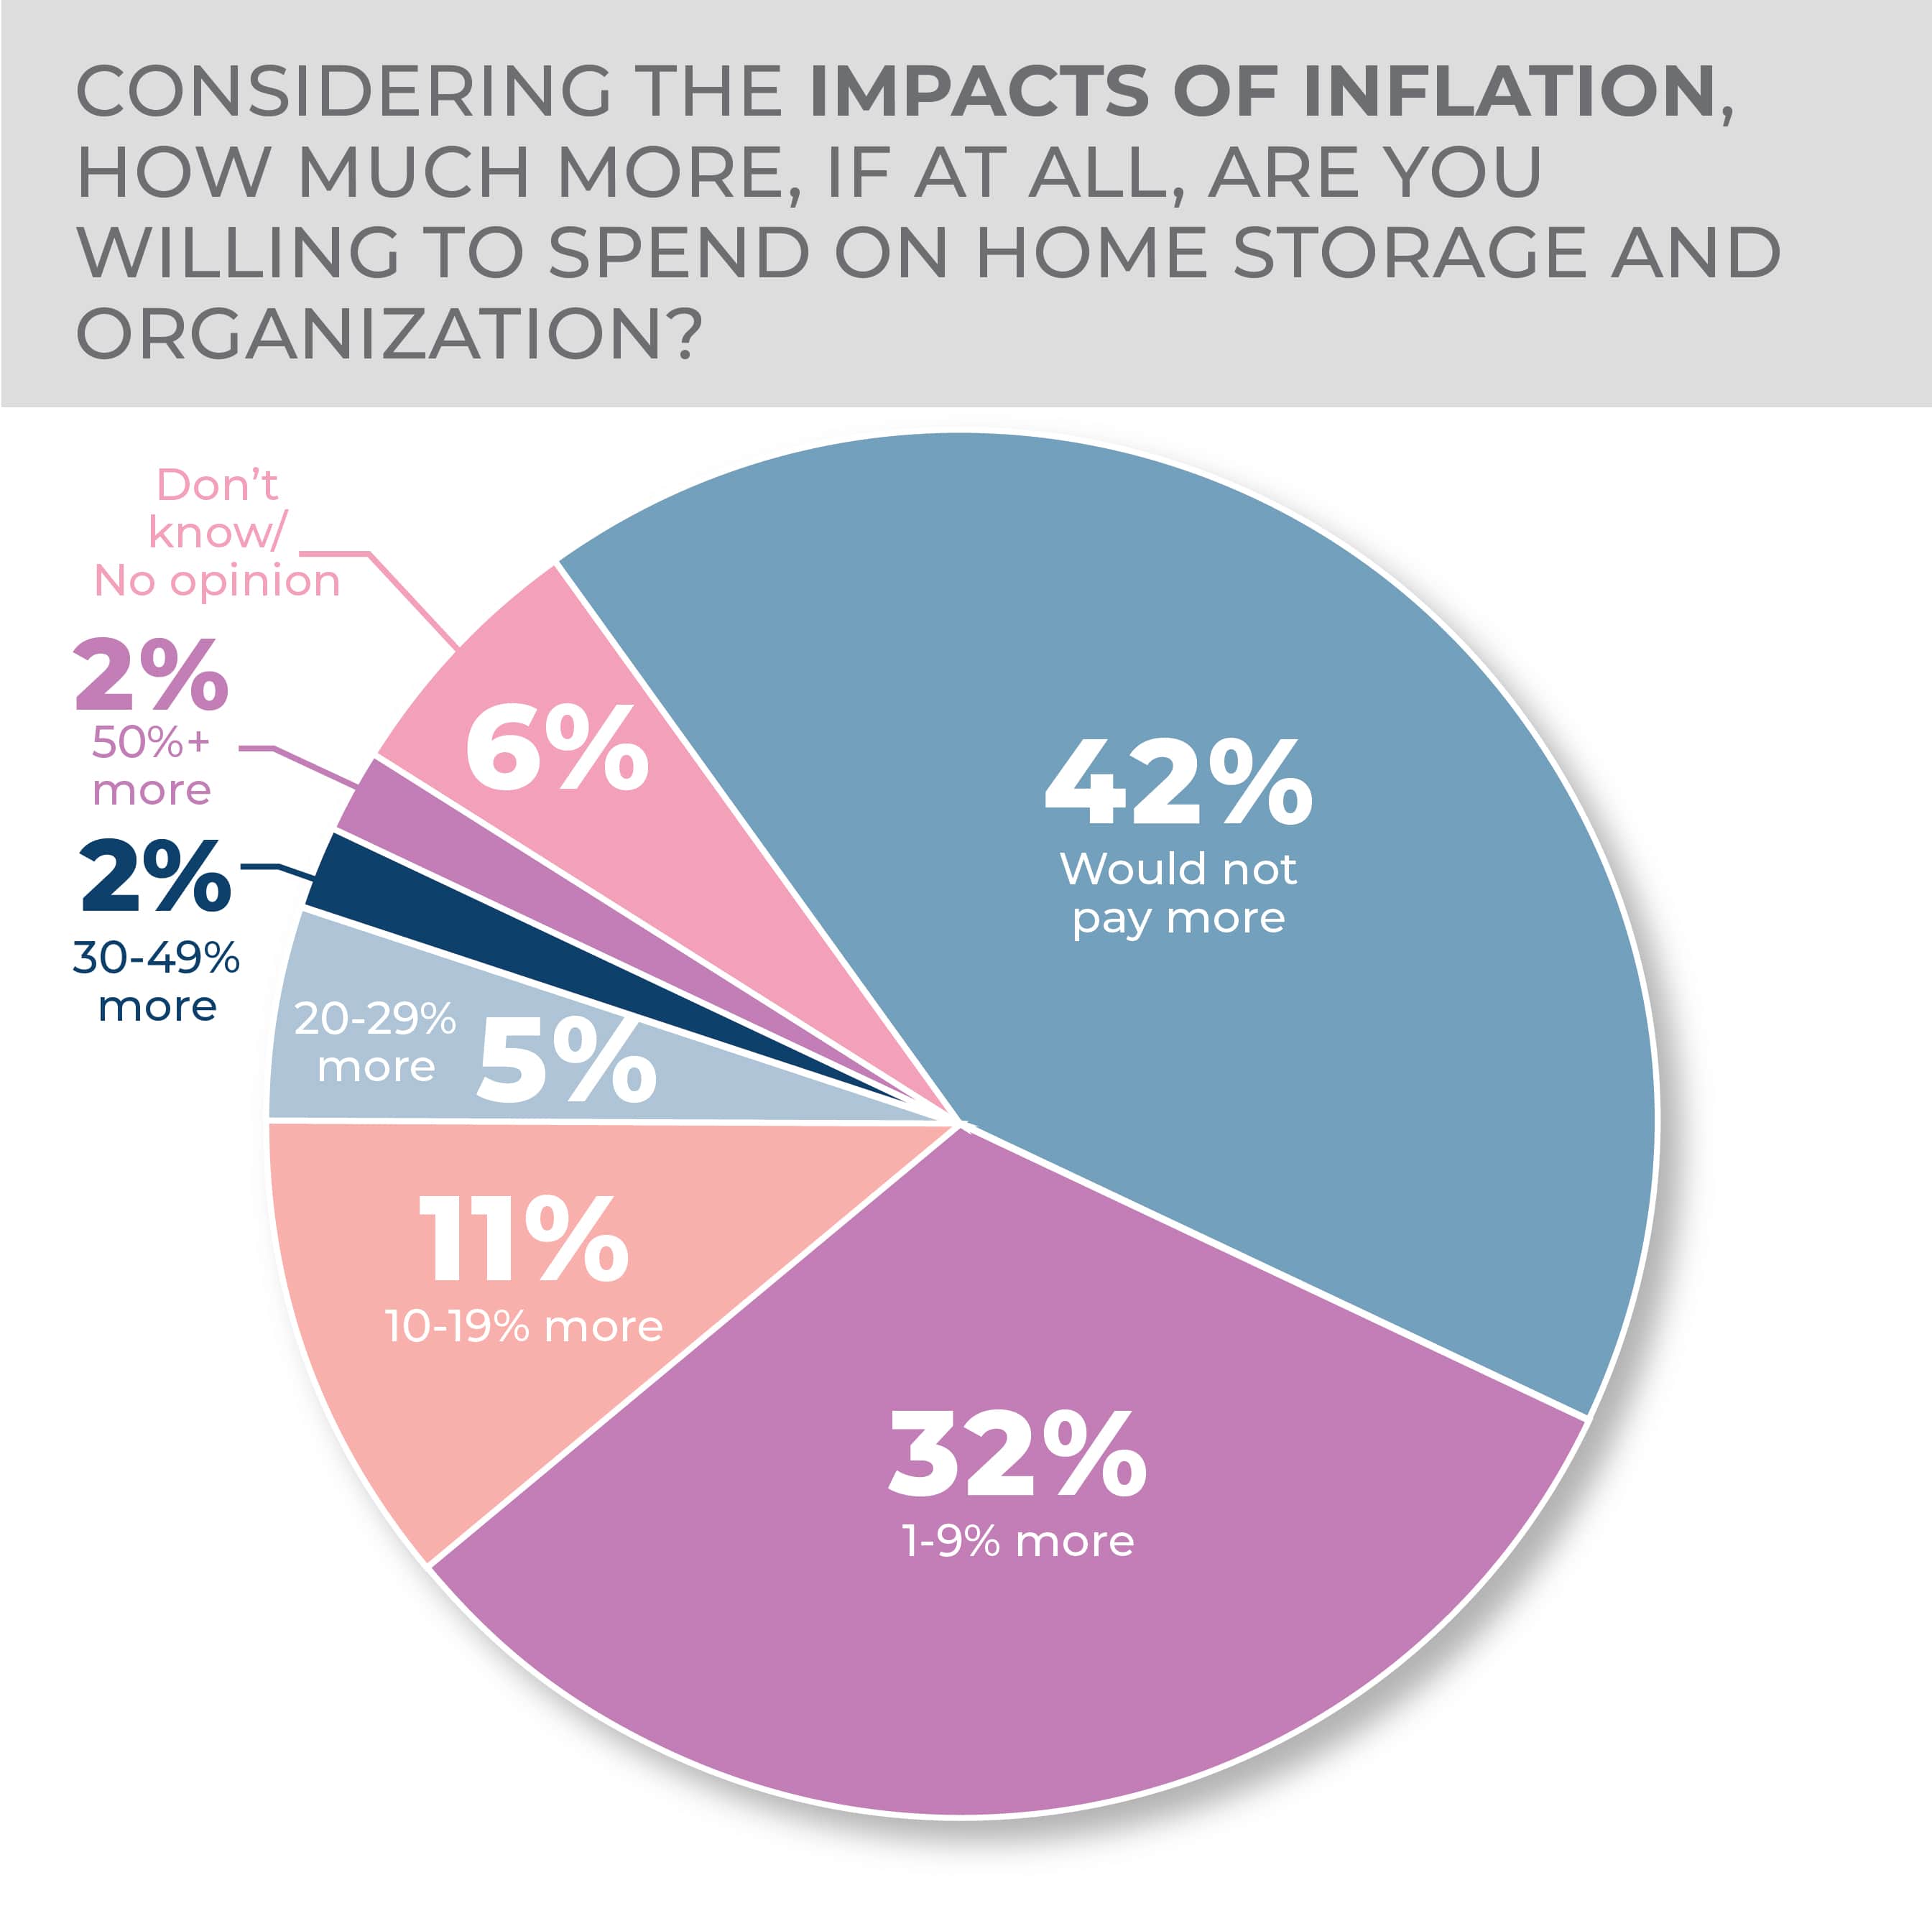
Given that home storage and organization products come in a wide variety of materials and configurations, consumers responding to the Outlook survey were not inclined to chase prices despite inflation with 42% saying they would not pay more, 32% saying they would pay 1% to 9% more and only 11% saying they would pay 10% to 19%.
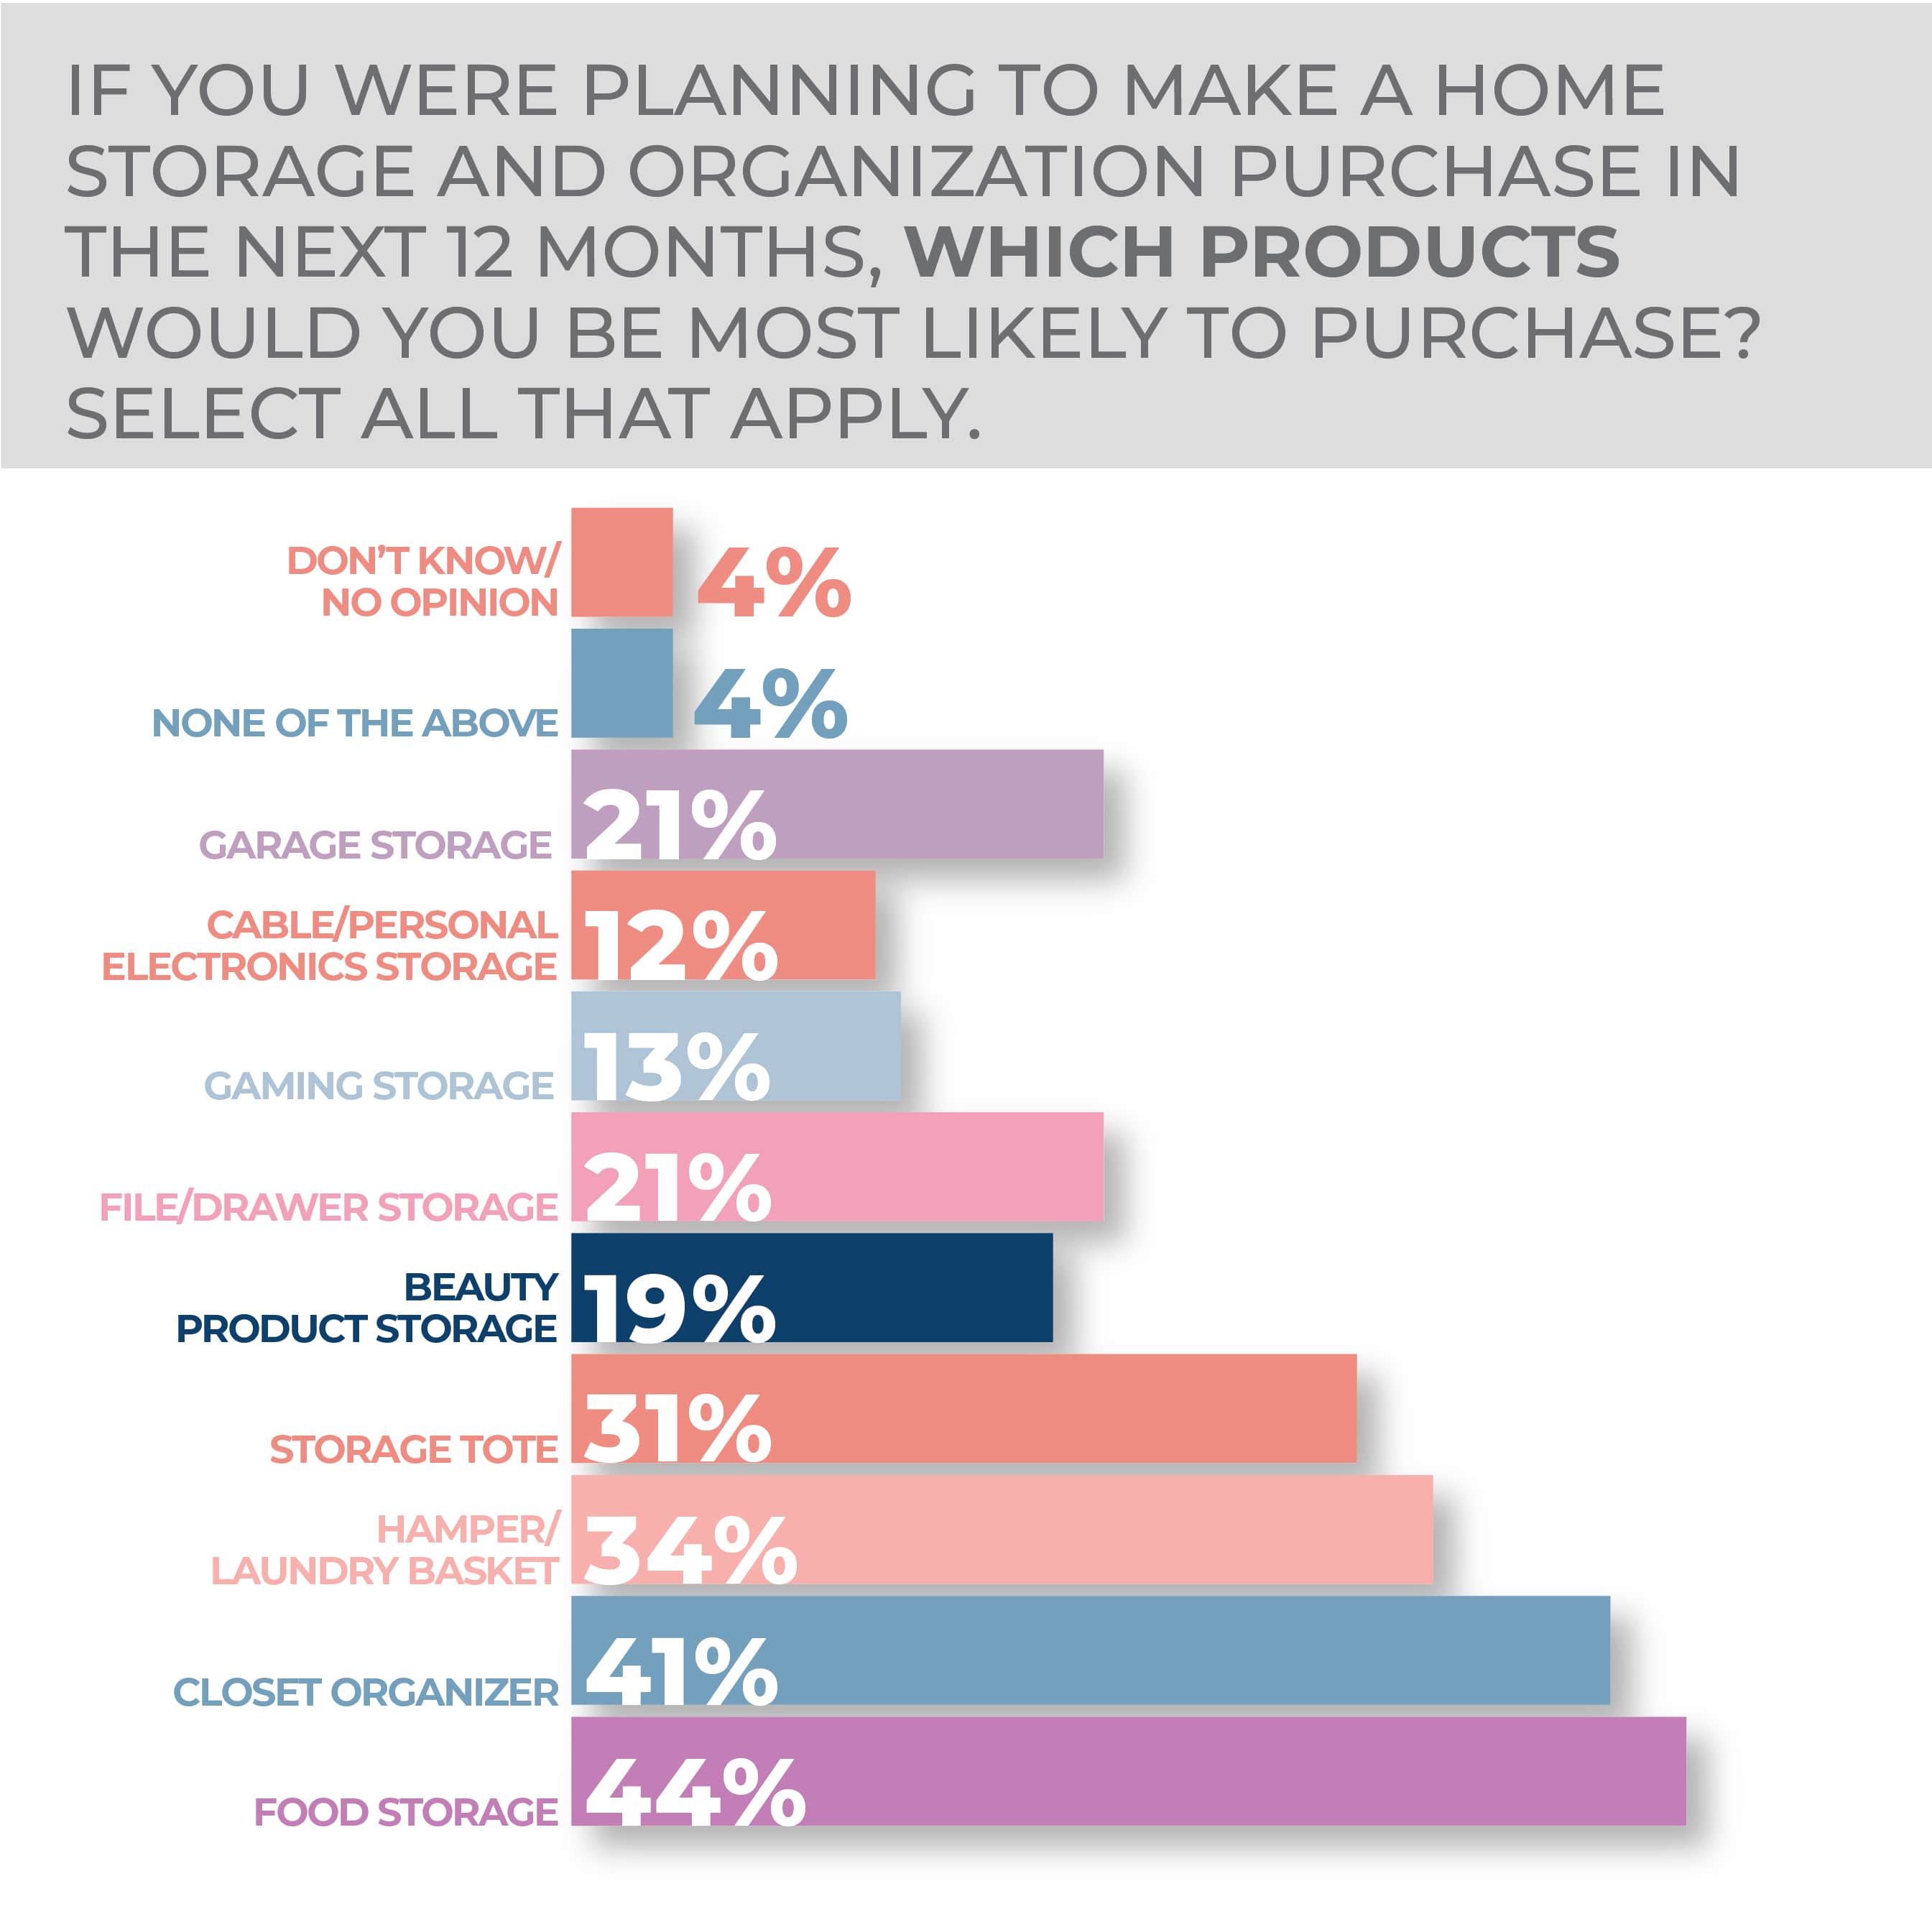
As for segment preference, 44% of consumers said they were likely to purchase food storage products, 41% said closet organizers and 34% said hampers/laundry baskets. Of the top three, the only real shift was in food storage, but that was up just three points in the survey year over year. Storage totes came in at 31% essentially flat year over year and kitchen counter/pantry organizers at 28% down three points from the before survey. File and drawer storage and garage storage both came in at 21%, again essentially flat year over year, while beauty product storage was flat at 19%, desk organizers were down three points to 18%, gaming storage was also flat at 13%, and cable/personal electronics storage slipped three points to 12%.
The main target for potential storage and organization product purchasers was an adult bedroom closet, at 23%, followed by kitchen drawers/cabinets at 17%, garage at 16%, laundry room at 10% and home office at 7%; little changed year over year.
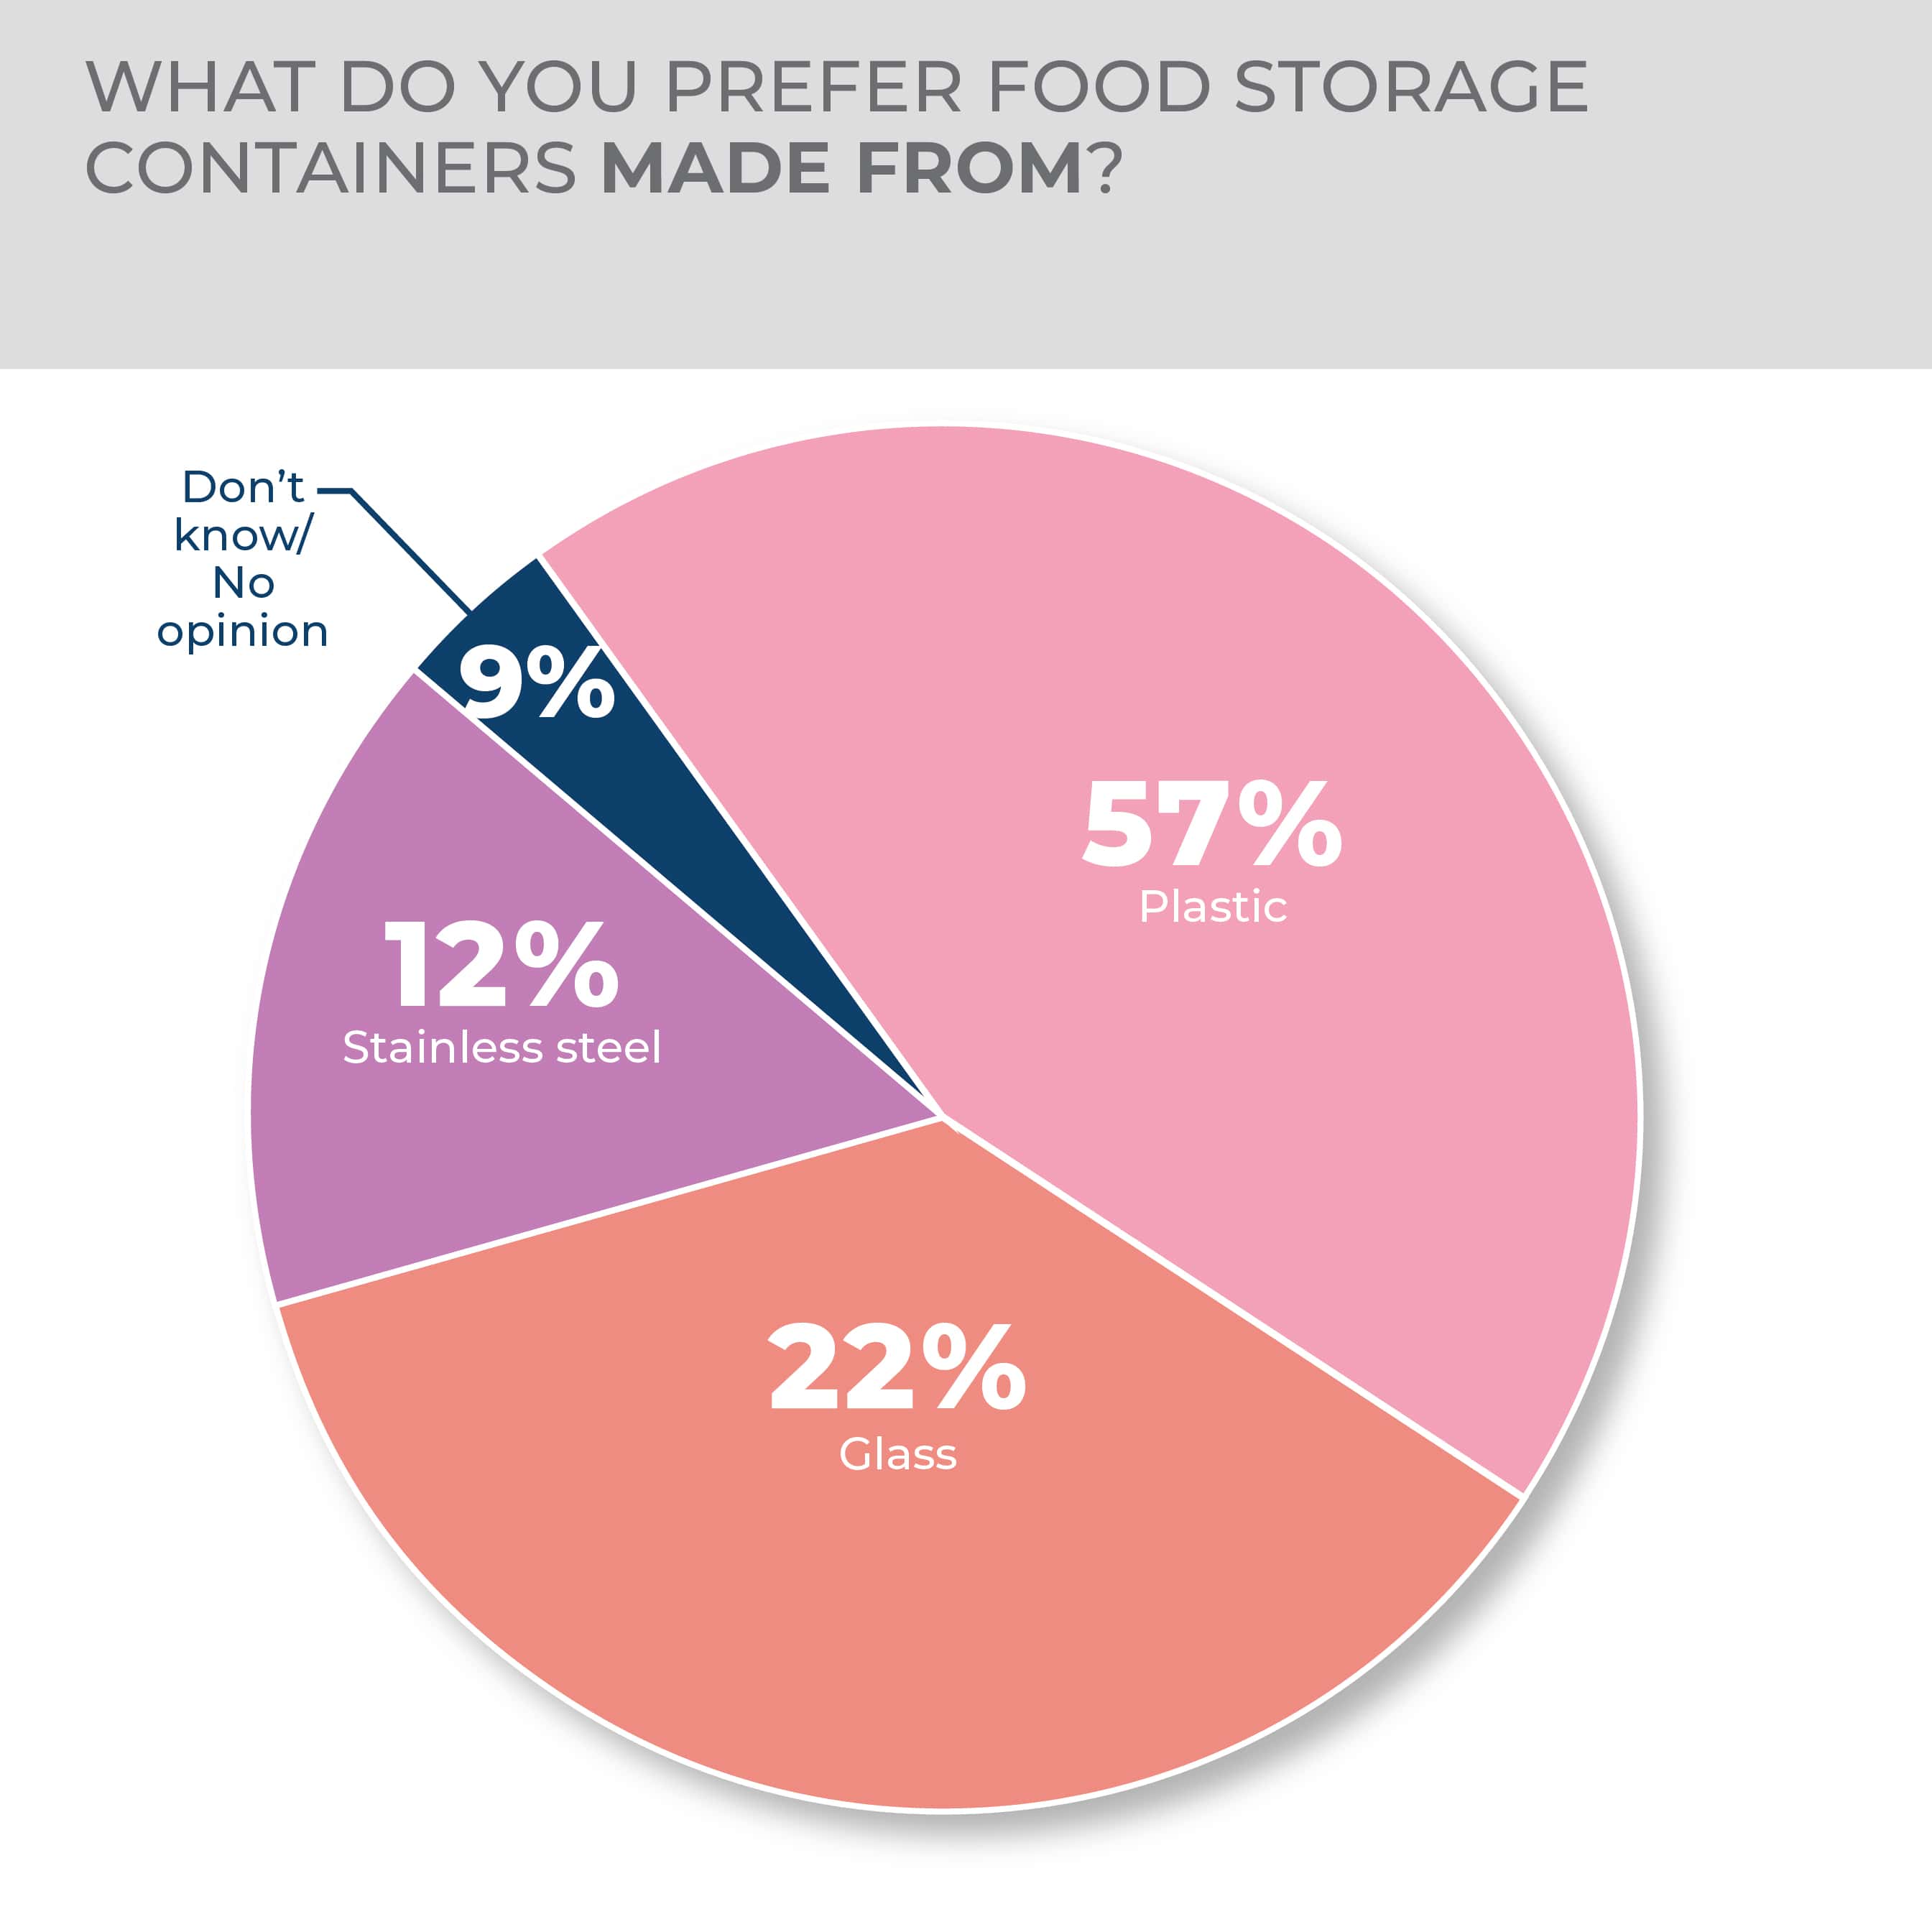
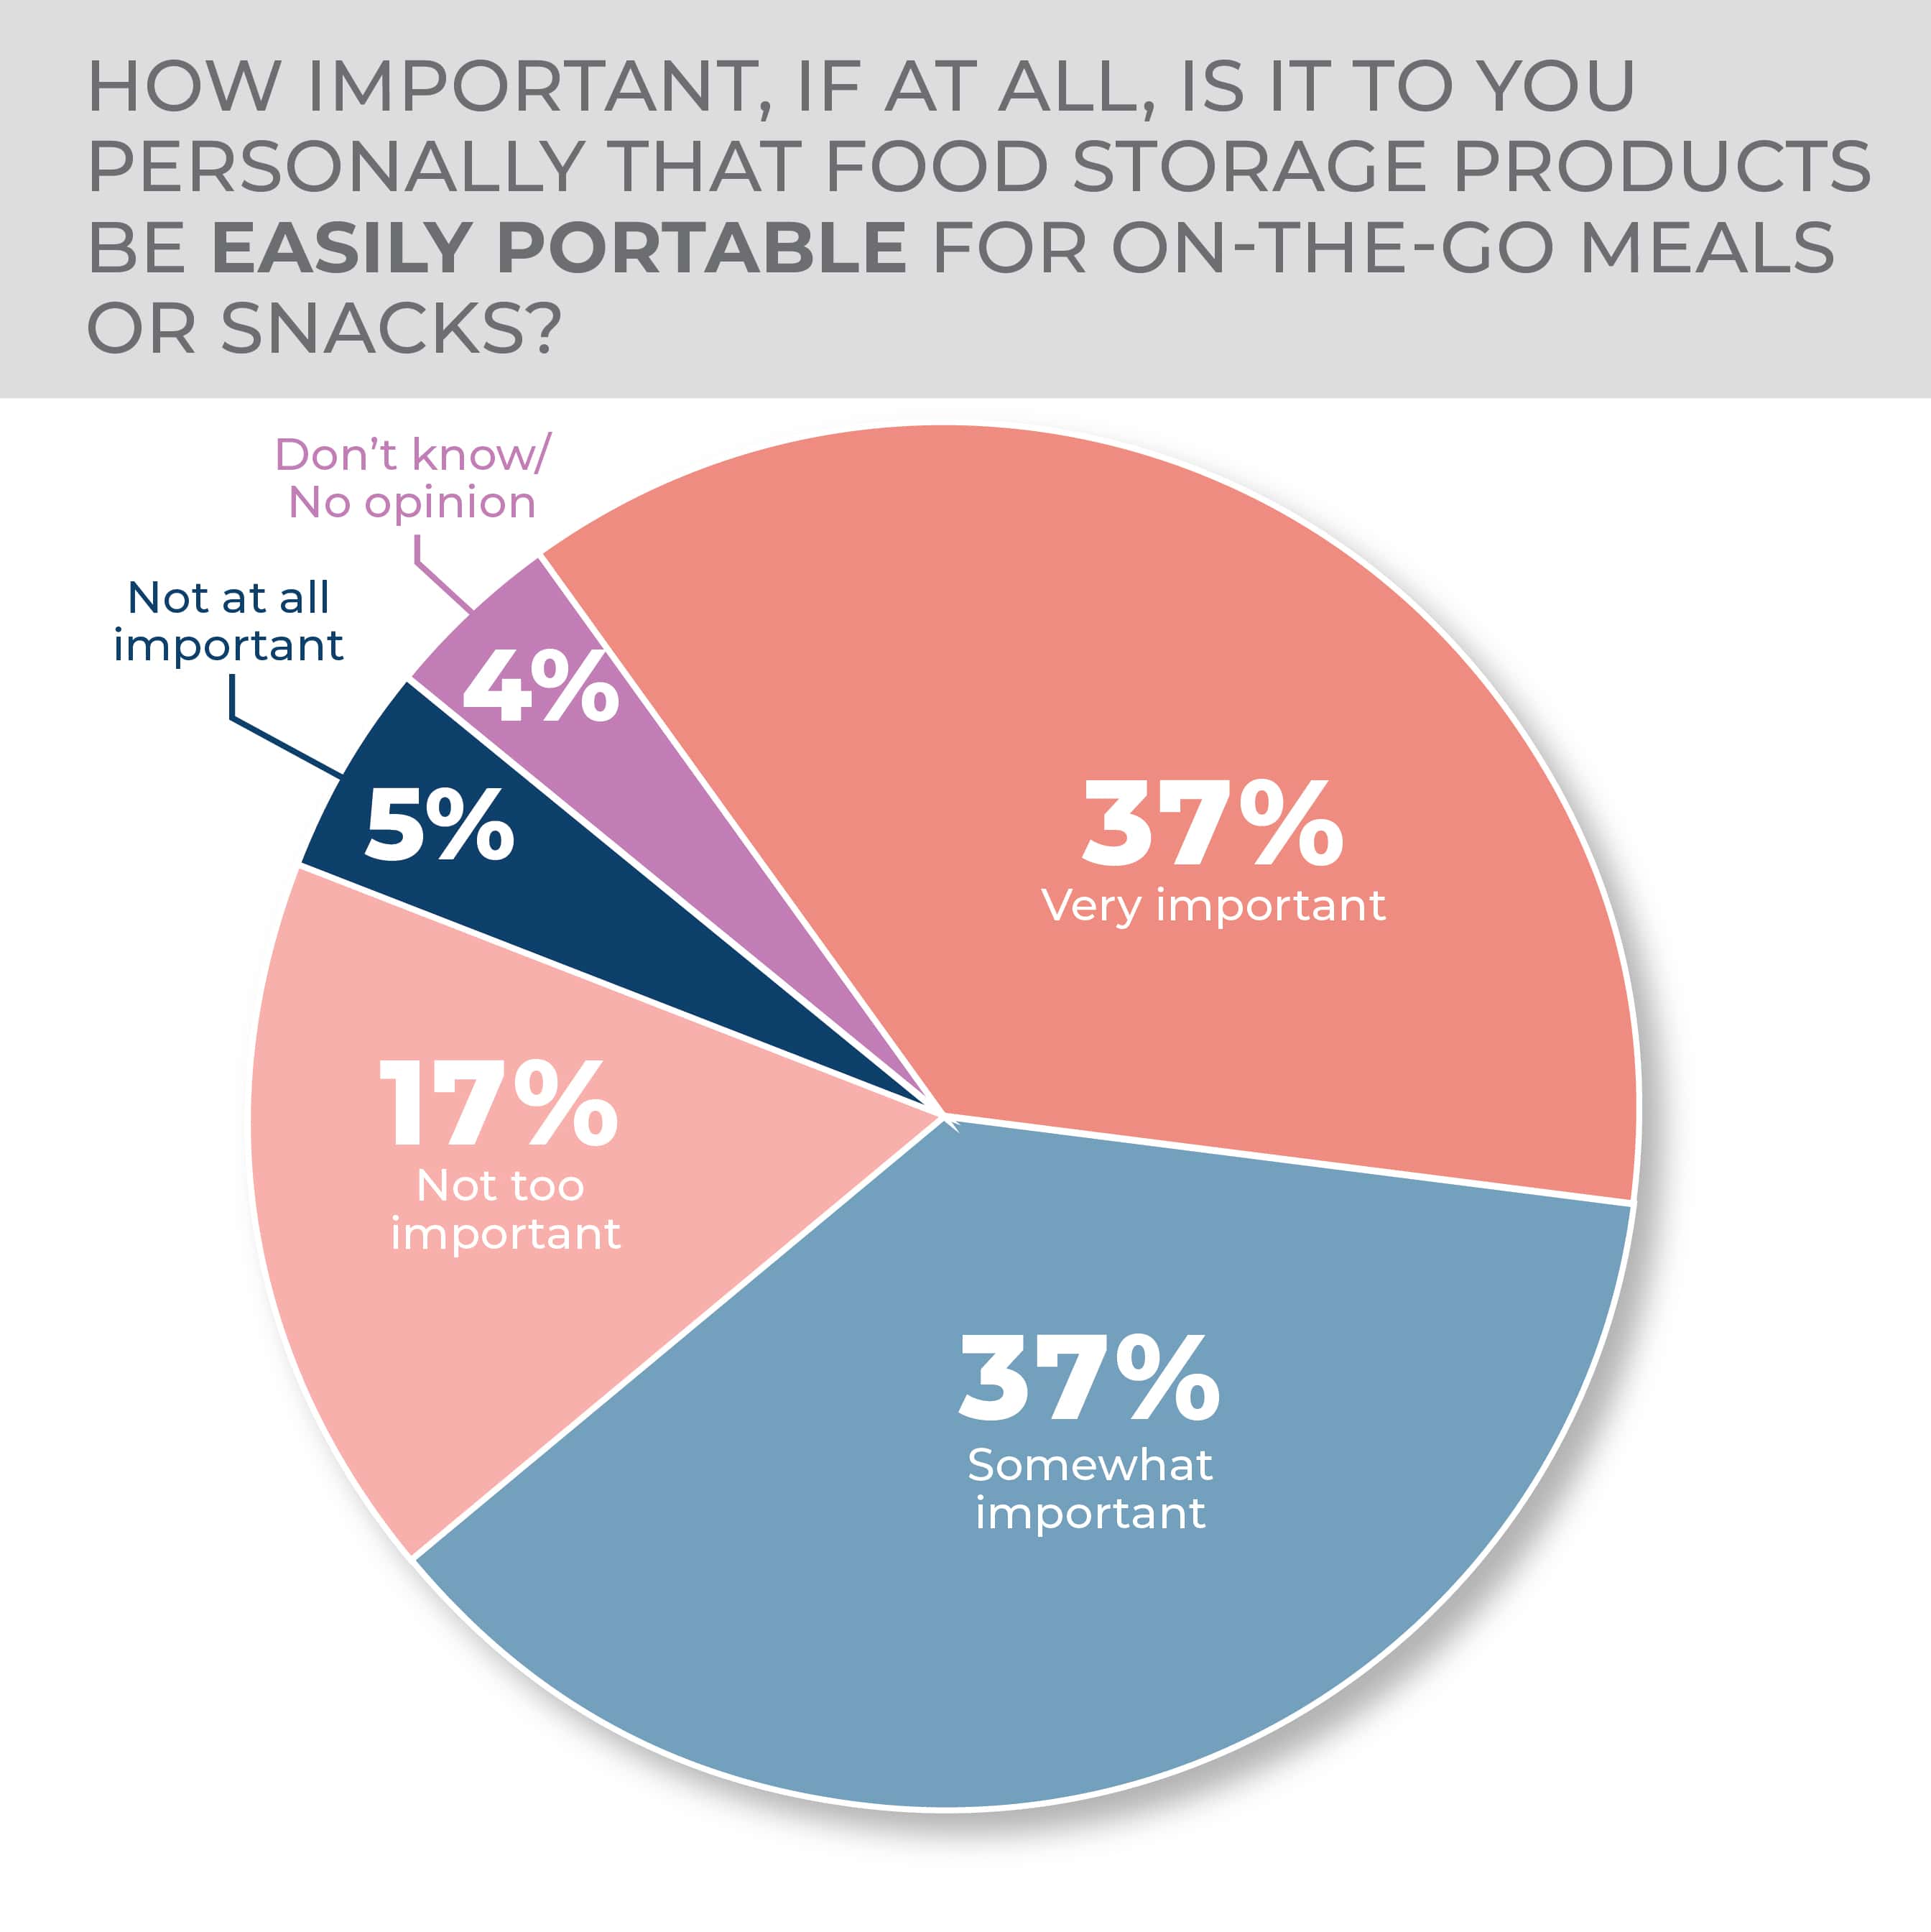
Within food storage, 57% of survey respondents said plastic was their material of choice followed by glass at 22%. Additionally, 37% of respondents said it’s very important and the same proportion said it was somewhat important that food storage be designed for portability.
As for gender, women are more interested in purchasing home storage and organization products over the year ahead with 23% very likely and 36% somewhat likely to do so, versus 18% and 32%, respectively, for men. The top age bracket for potential purchase is 18-34-year-olds, at 30% very likely and 39% somewhat likely to buy followed by 35-44-year-olds, at 27% and 37%, respectively.
Southerners and Westerners are close on their likelihood to purchase, at 22% very and 34% somewhat for the former and 21% very and 36% somewhat, for the latter. Northeasterners came in at 20% very and 32% somewhat likely to purchase while Midwesterners came in at 18% and 33%, respectively.
More Storage & Organization Findings:
Luggage & Travel Accessories
Luggage and travel accessories have faced a demand challenge over the past couple of years, as the COVID-19 pandemic kept people at home, but their prospects are brightening.
Travel remains an affected area of the economy. Consumers have begun traveling again, although with costs and inconveniences associated with air travel getting a lot of attention, gasoline prices that have been high enough to keep people at home and COVID still raising concerns for some. Over time, however, the desire to travel has been gaining.
In the HomePage News 2023 Consumer Outlook Survey, 18% of respondents stated that they expect to take one to three business trips over the next year, 12% said four to five, 6% said five to nine and 3% said 10 or more, with 55% saying none. Personal travel is a different matter with 54% of consumers saying they anticipate one to three trips, 19% saying four to five, 9% saying five to nine and 5% saying 10 or more. Only 10% of respondents said they would make no personal trips at all. Although the business trip expectation is down several points year over year, the personal trip expectation is up slightly, especially in the case of one to three trips.
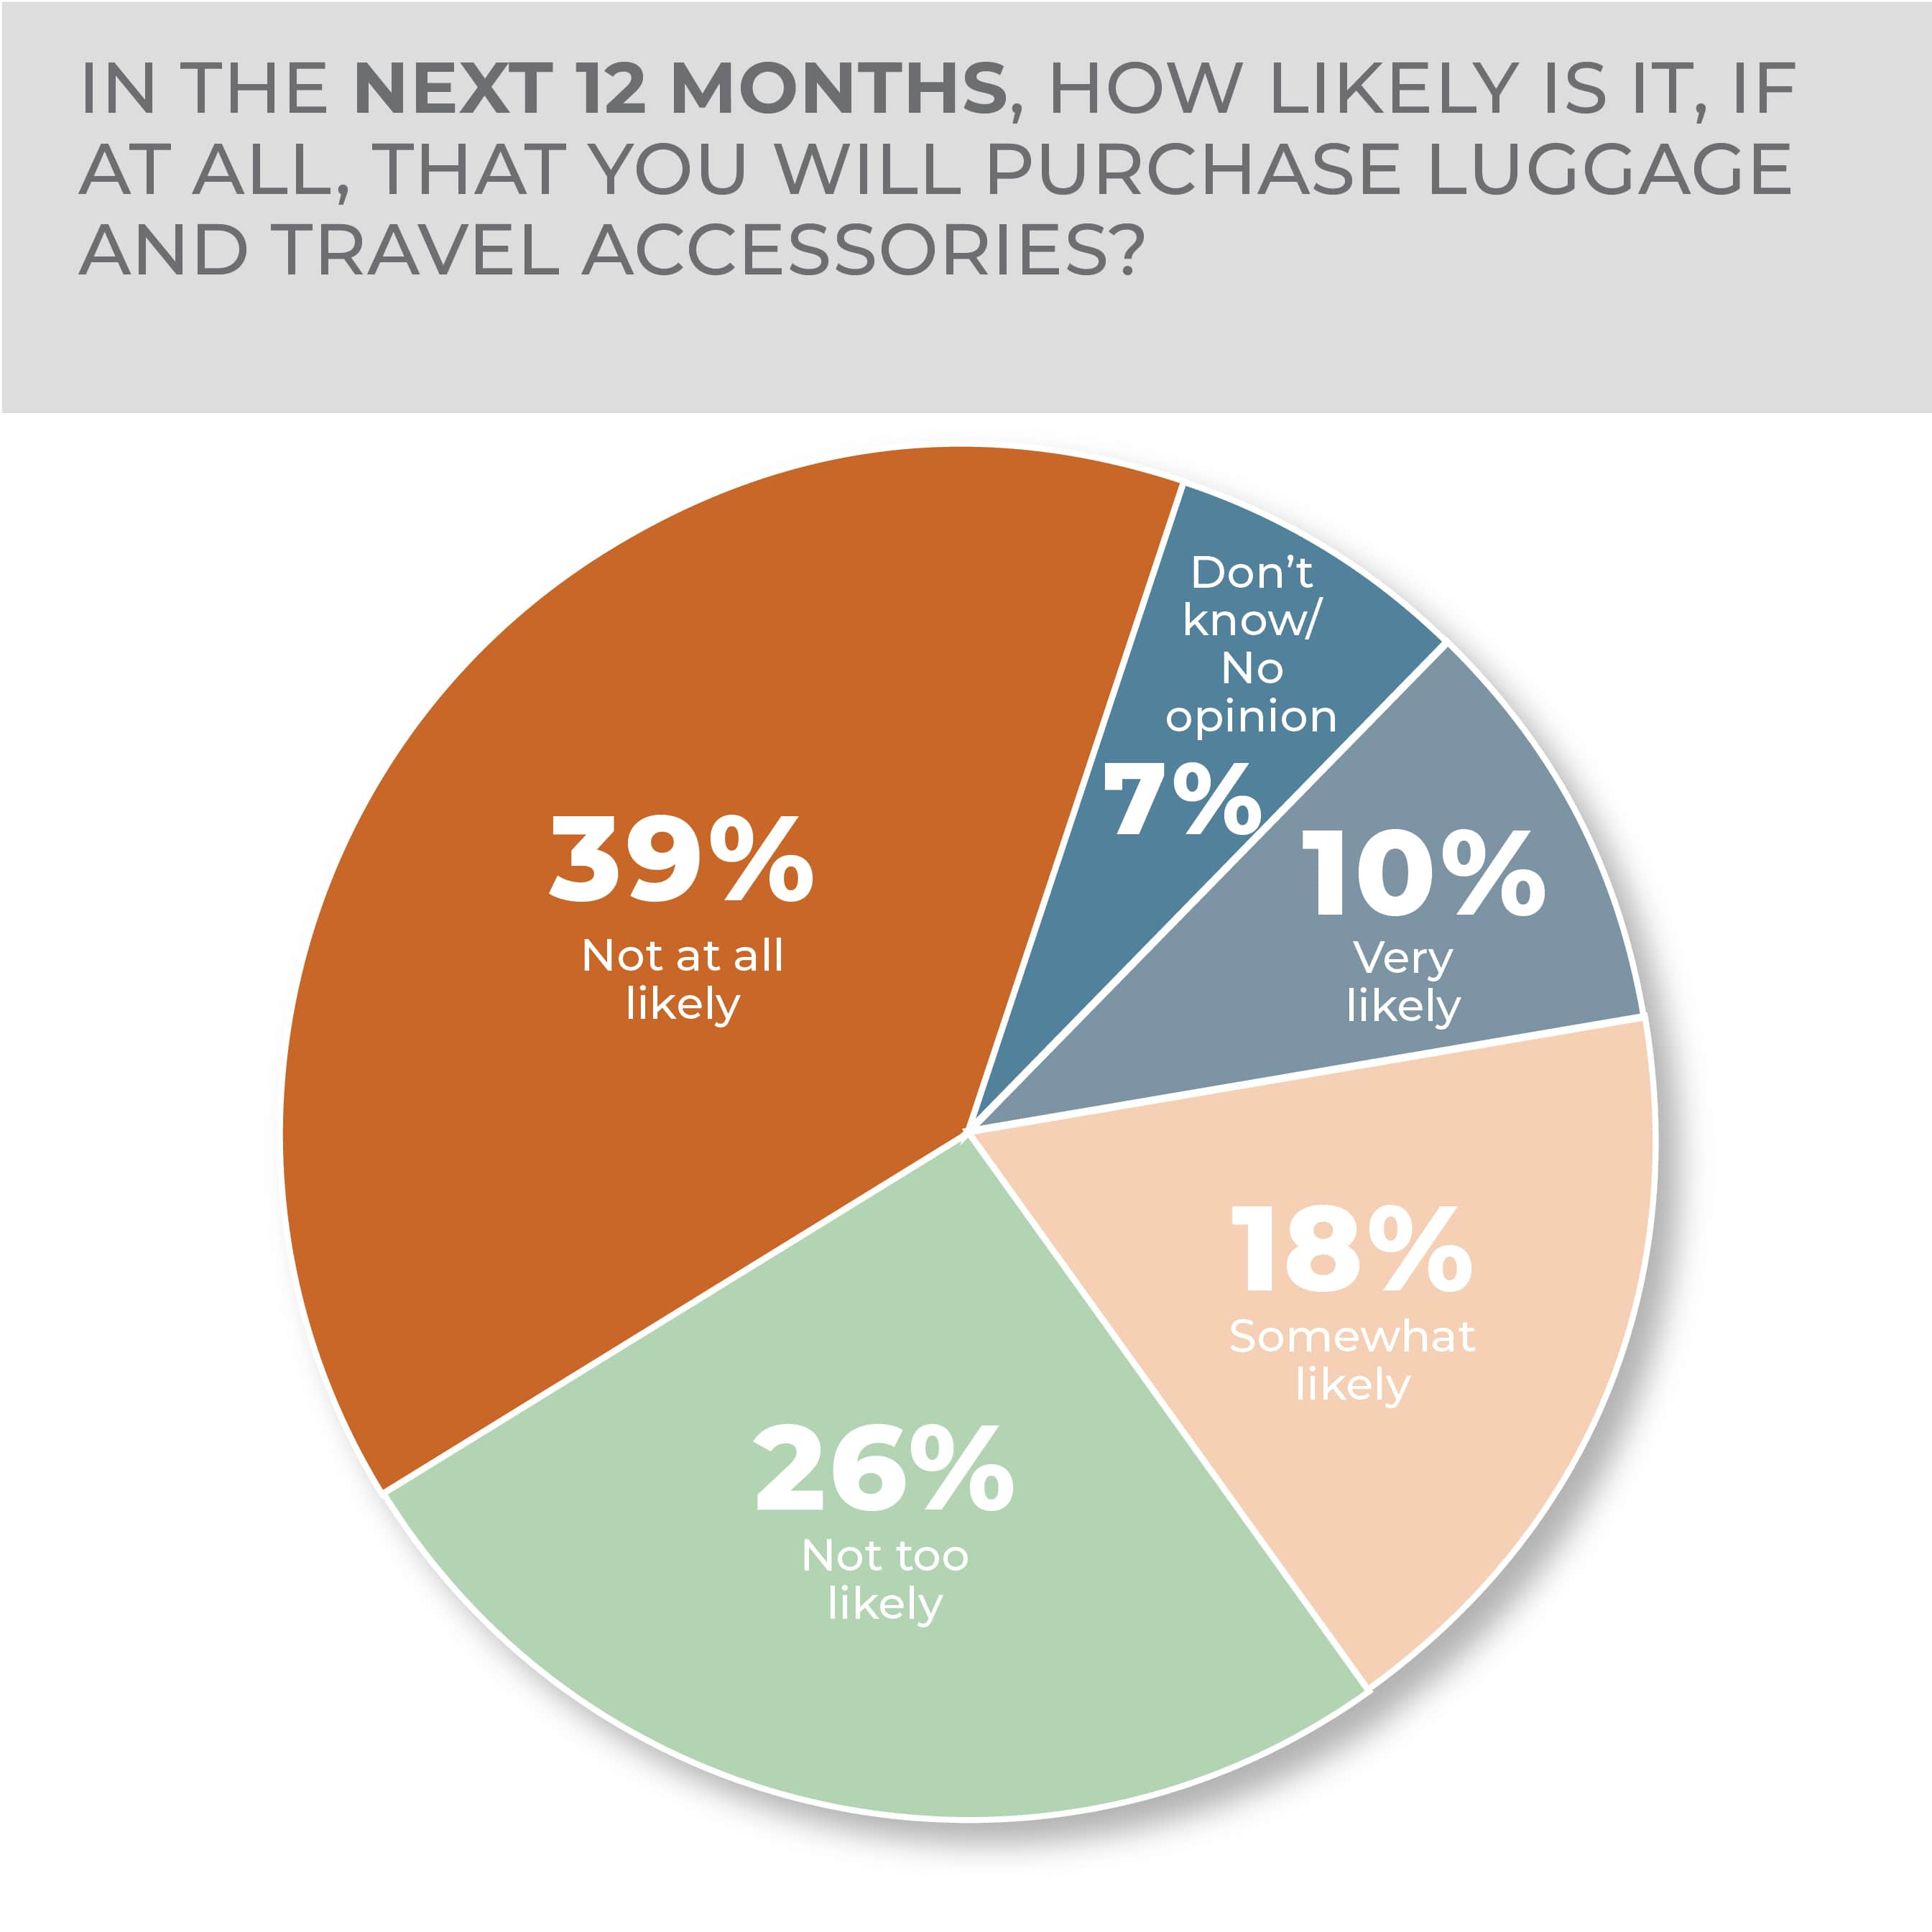
More than a quarter of consumers said they may be buying into the luggage and travel accessory category over the next year or so, with 10% saying they very like would and 18% saying they somewhat likely would. That’s down slightly from a year earlier when 13% of consumers looked forward to purchasing in the category with 17% saying they were likely to do so.
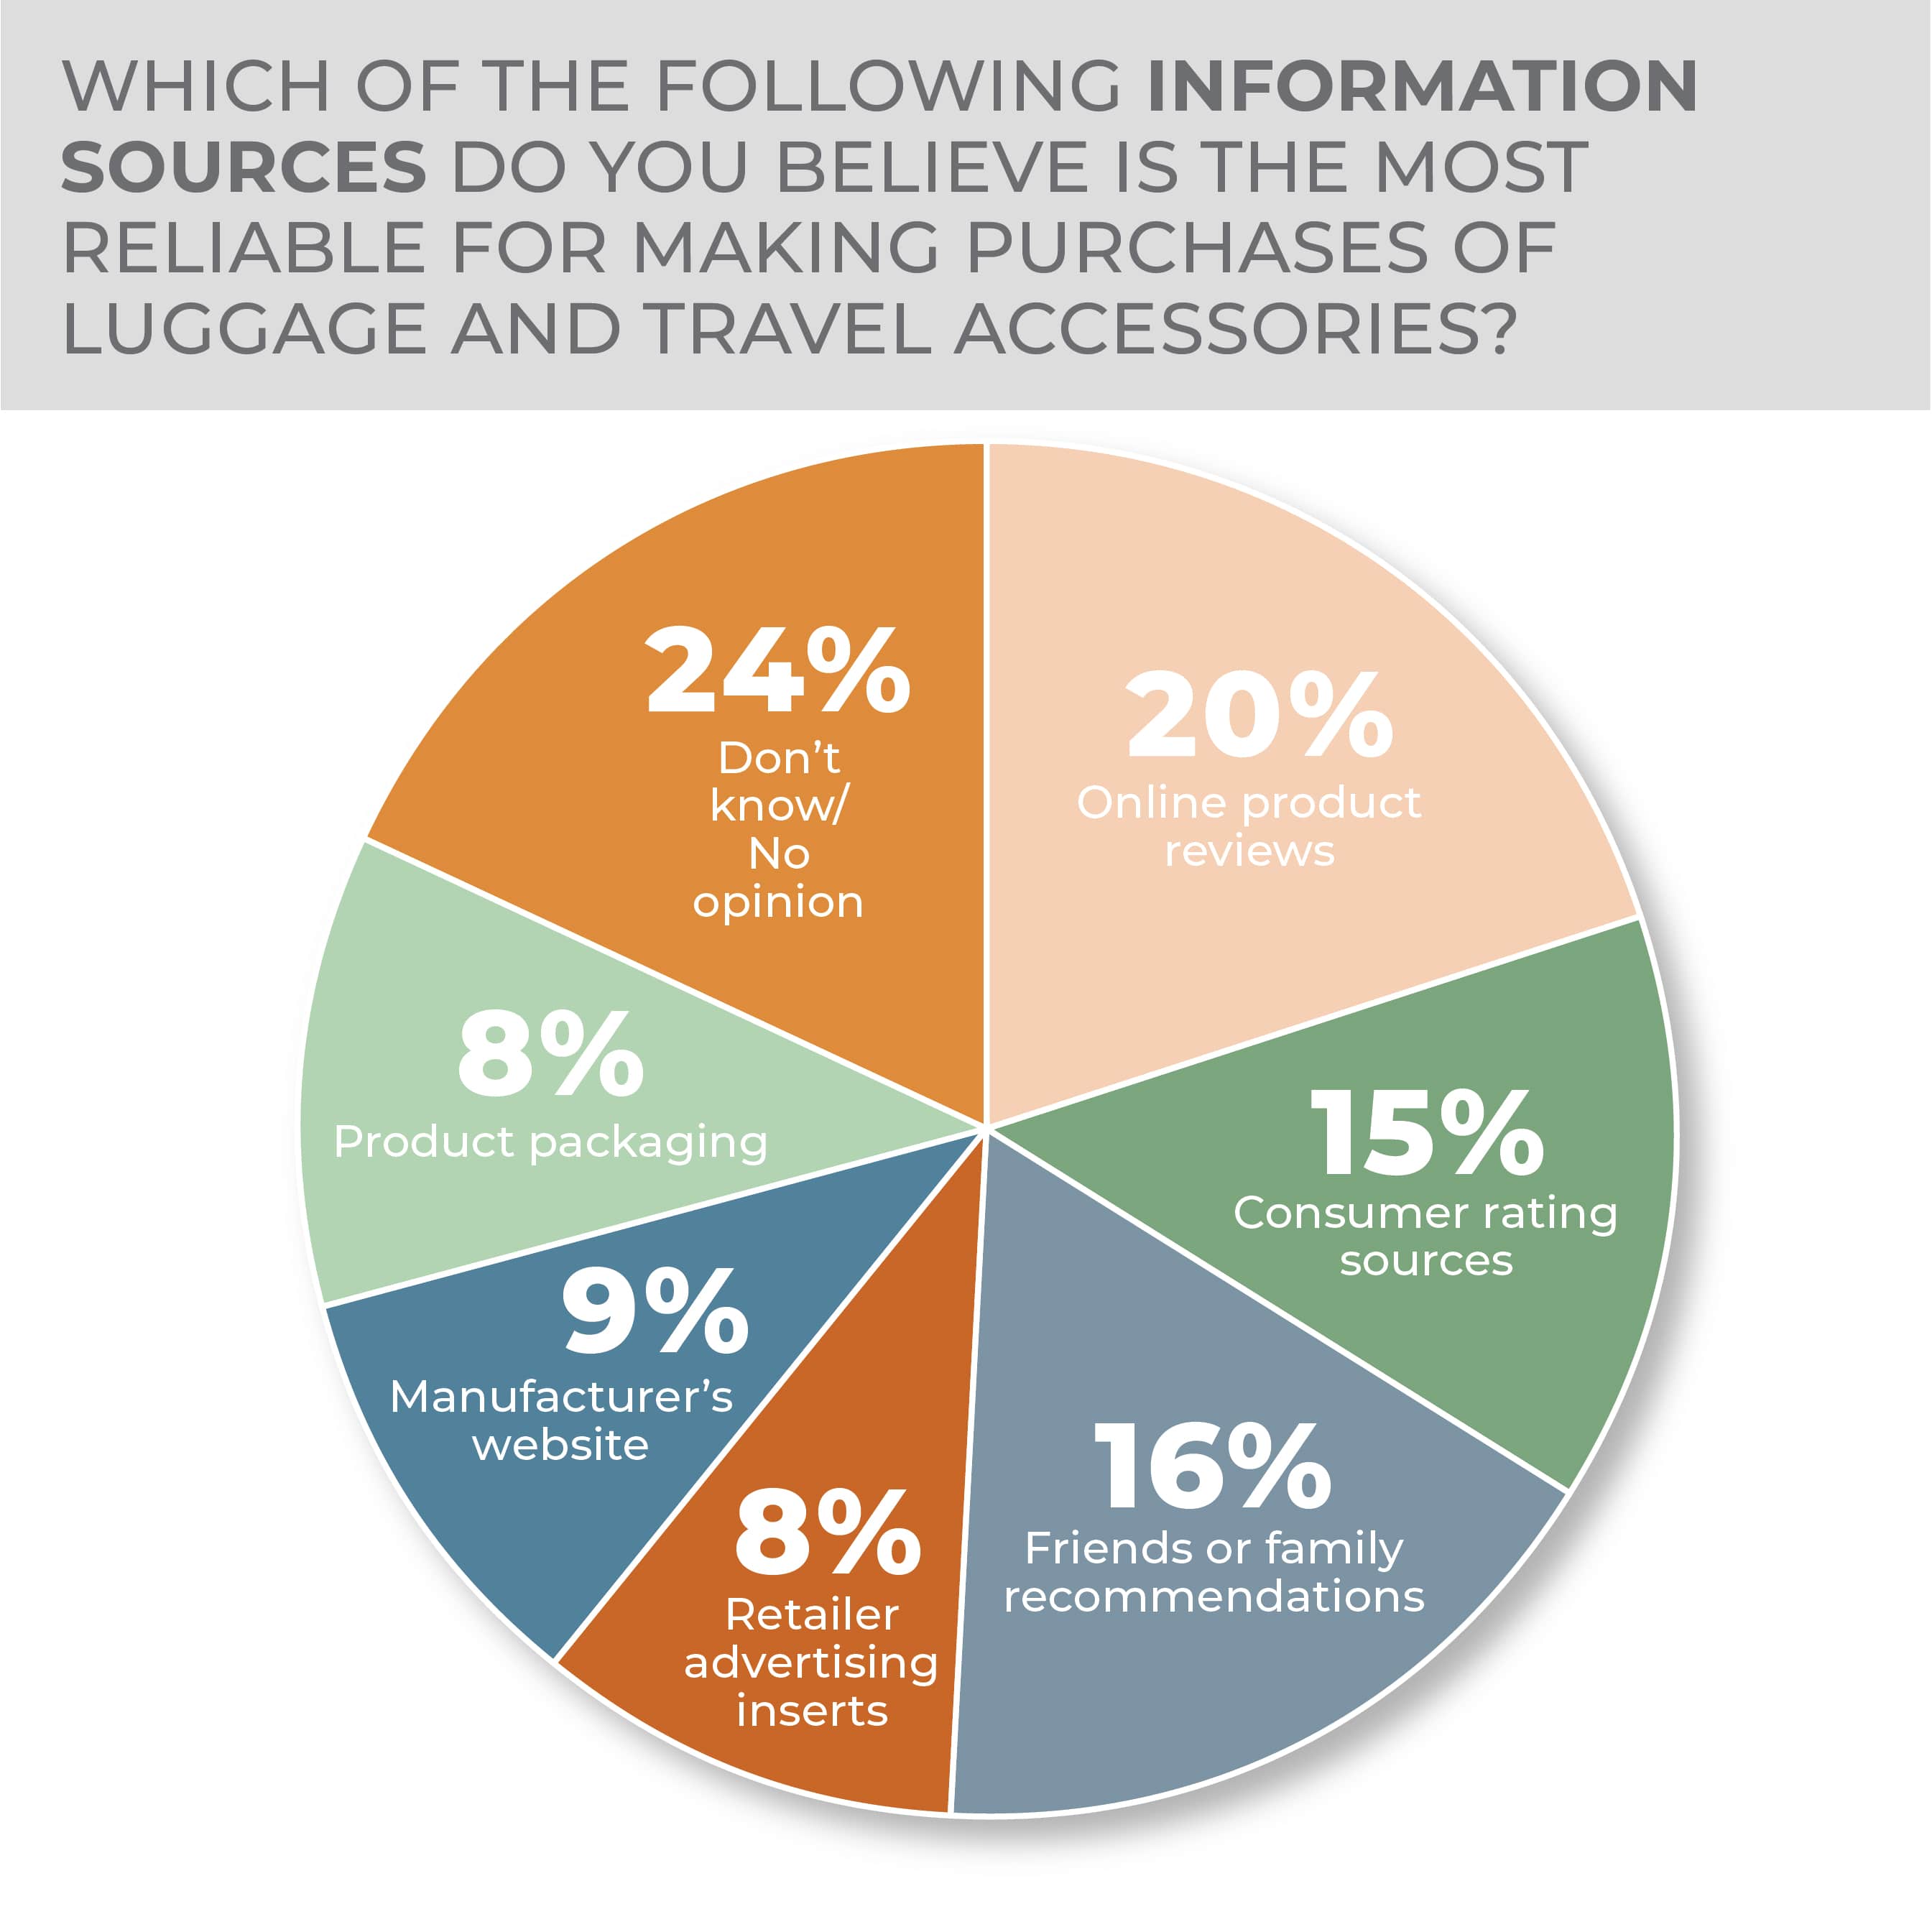
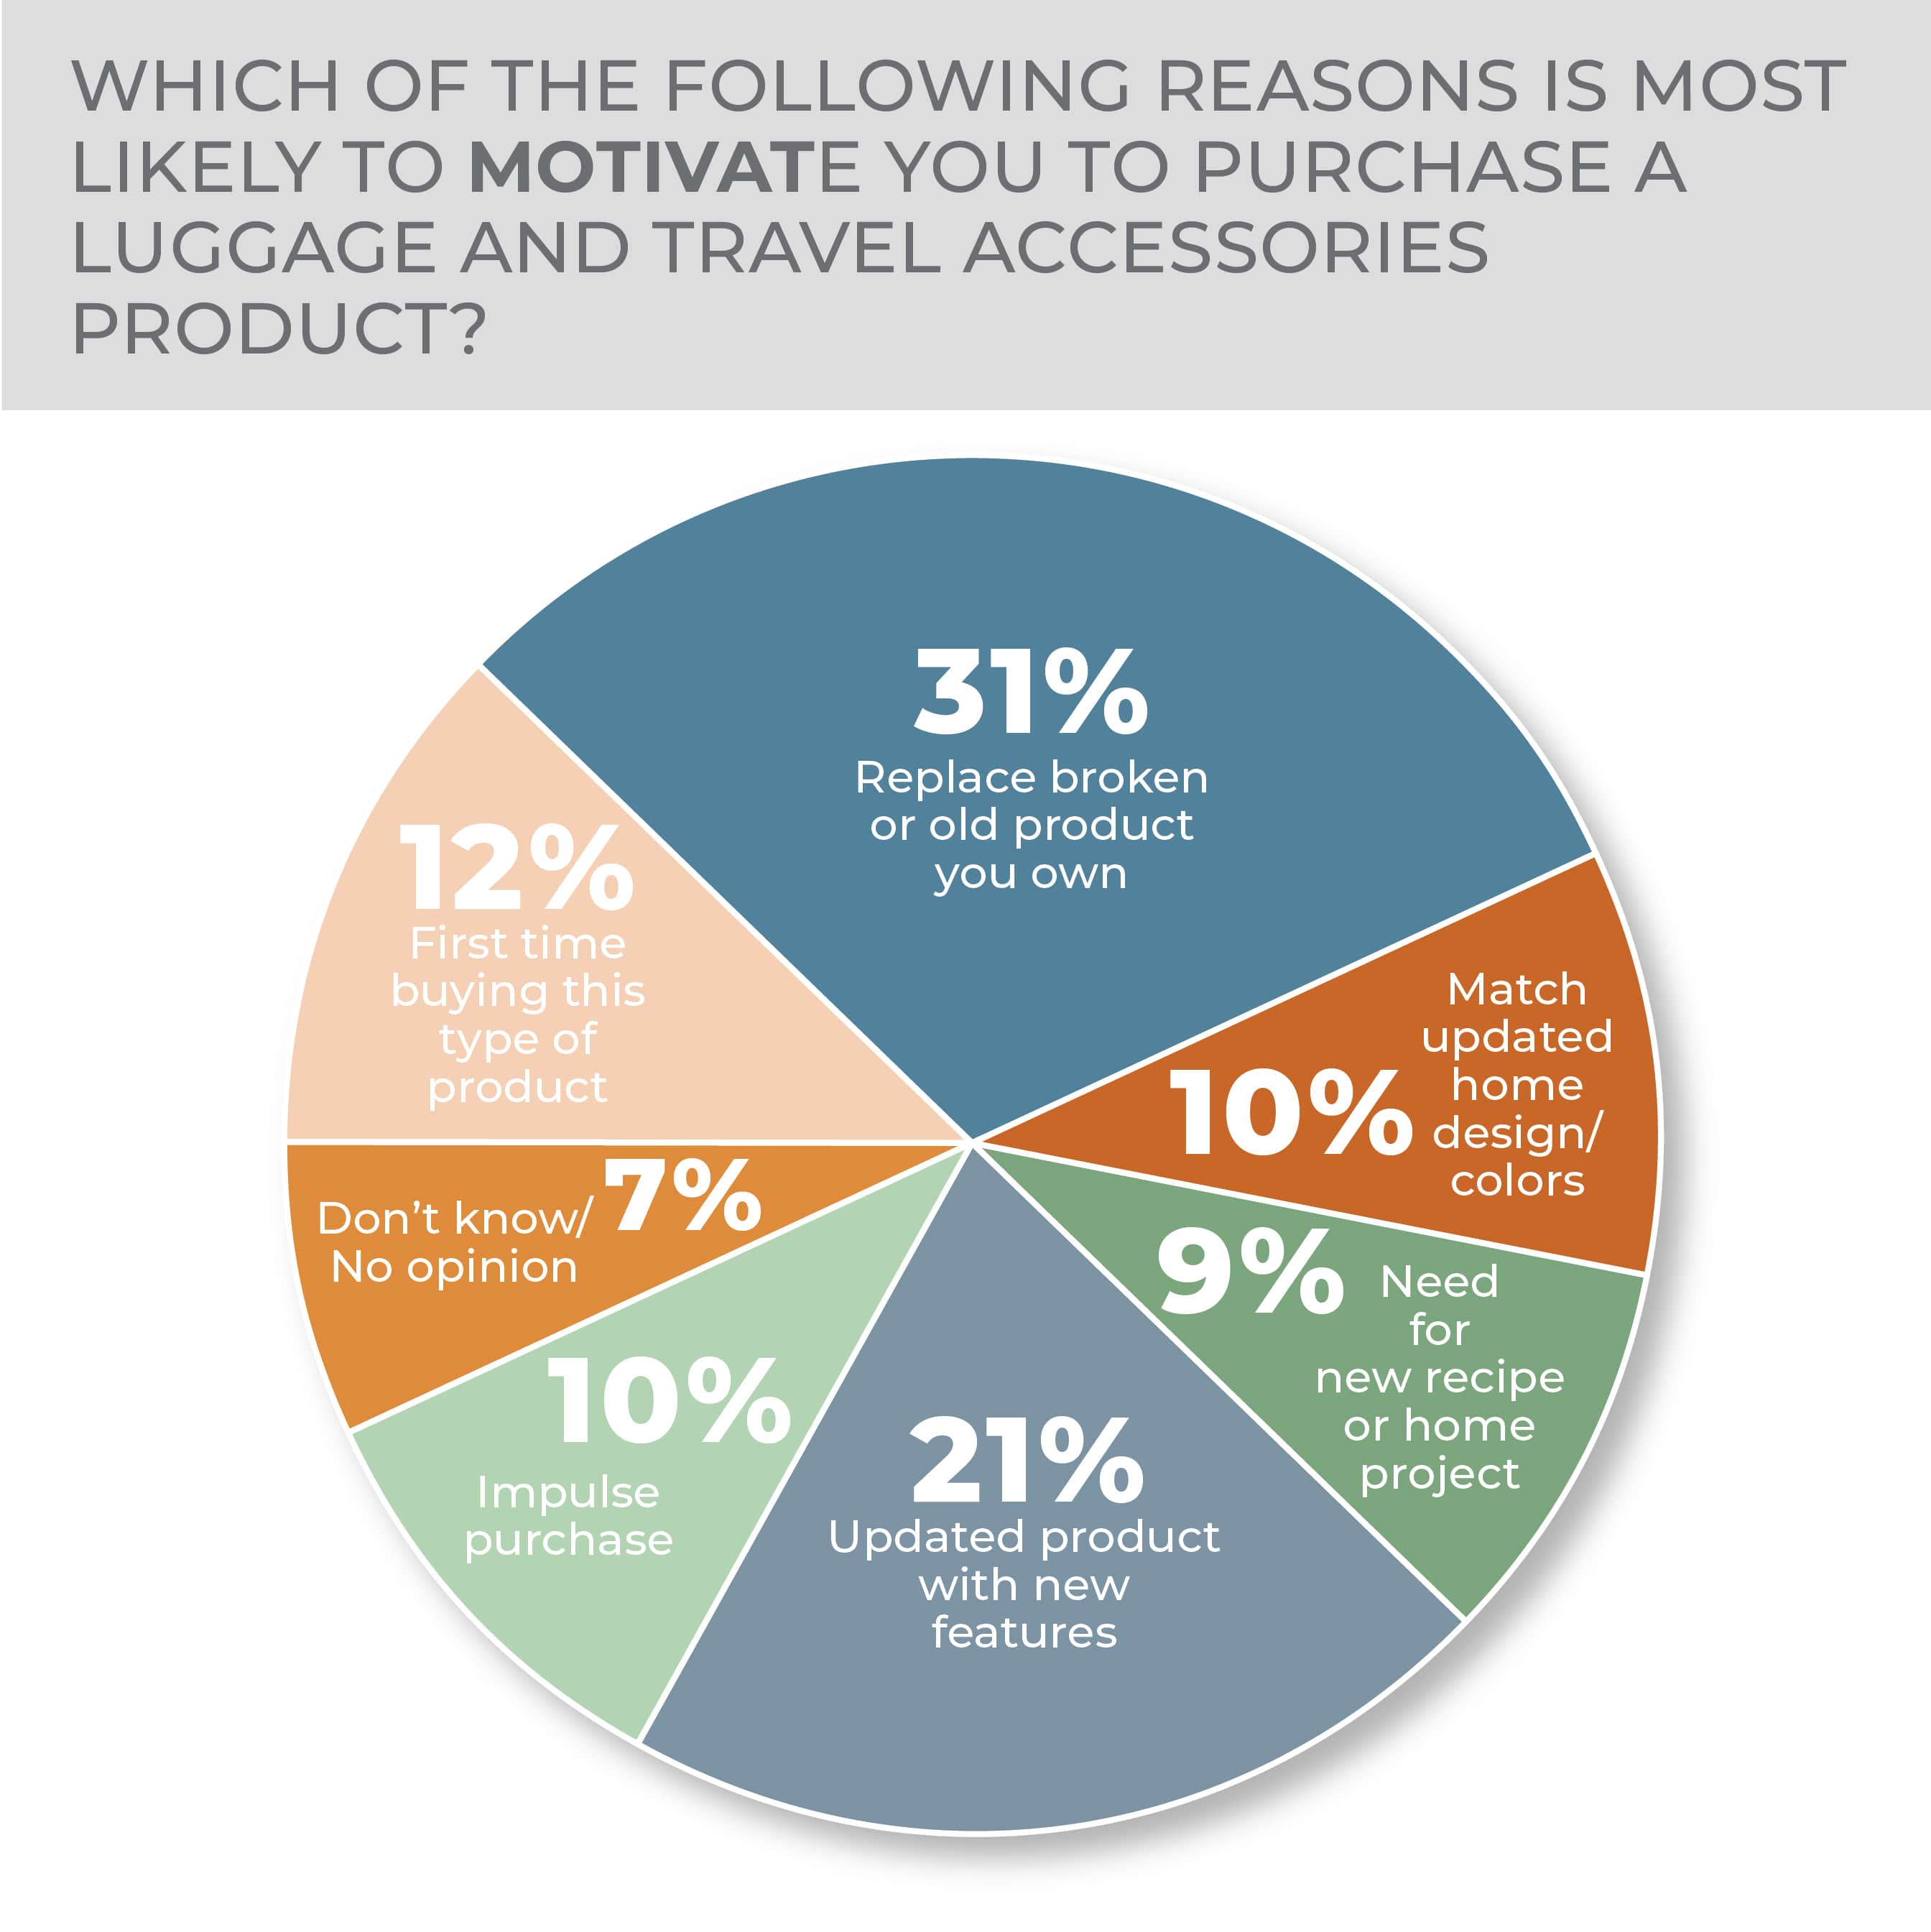
The reason a survey respondent might purchase in the category has changed little year over year, when, in both cases, replacement and new features were the main reasons followed by first-time buying. Almost a quarter of respondents said they weren’t sure where the best place to get product information was, up from 18% a year earlier. Yet, the top three sources remained the same: online reviews, friend or family recommendations and consumer ratings.
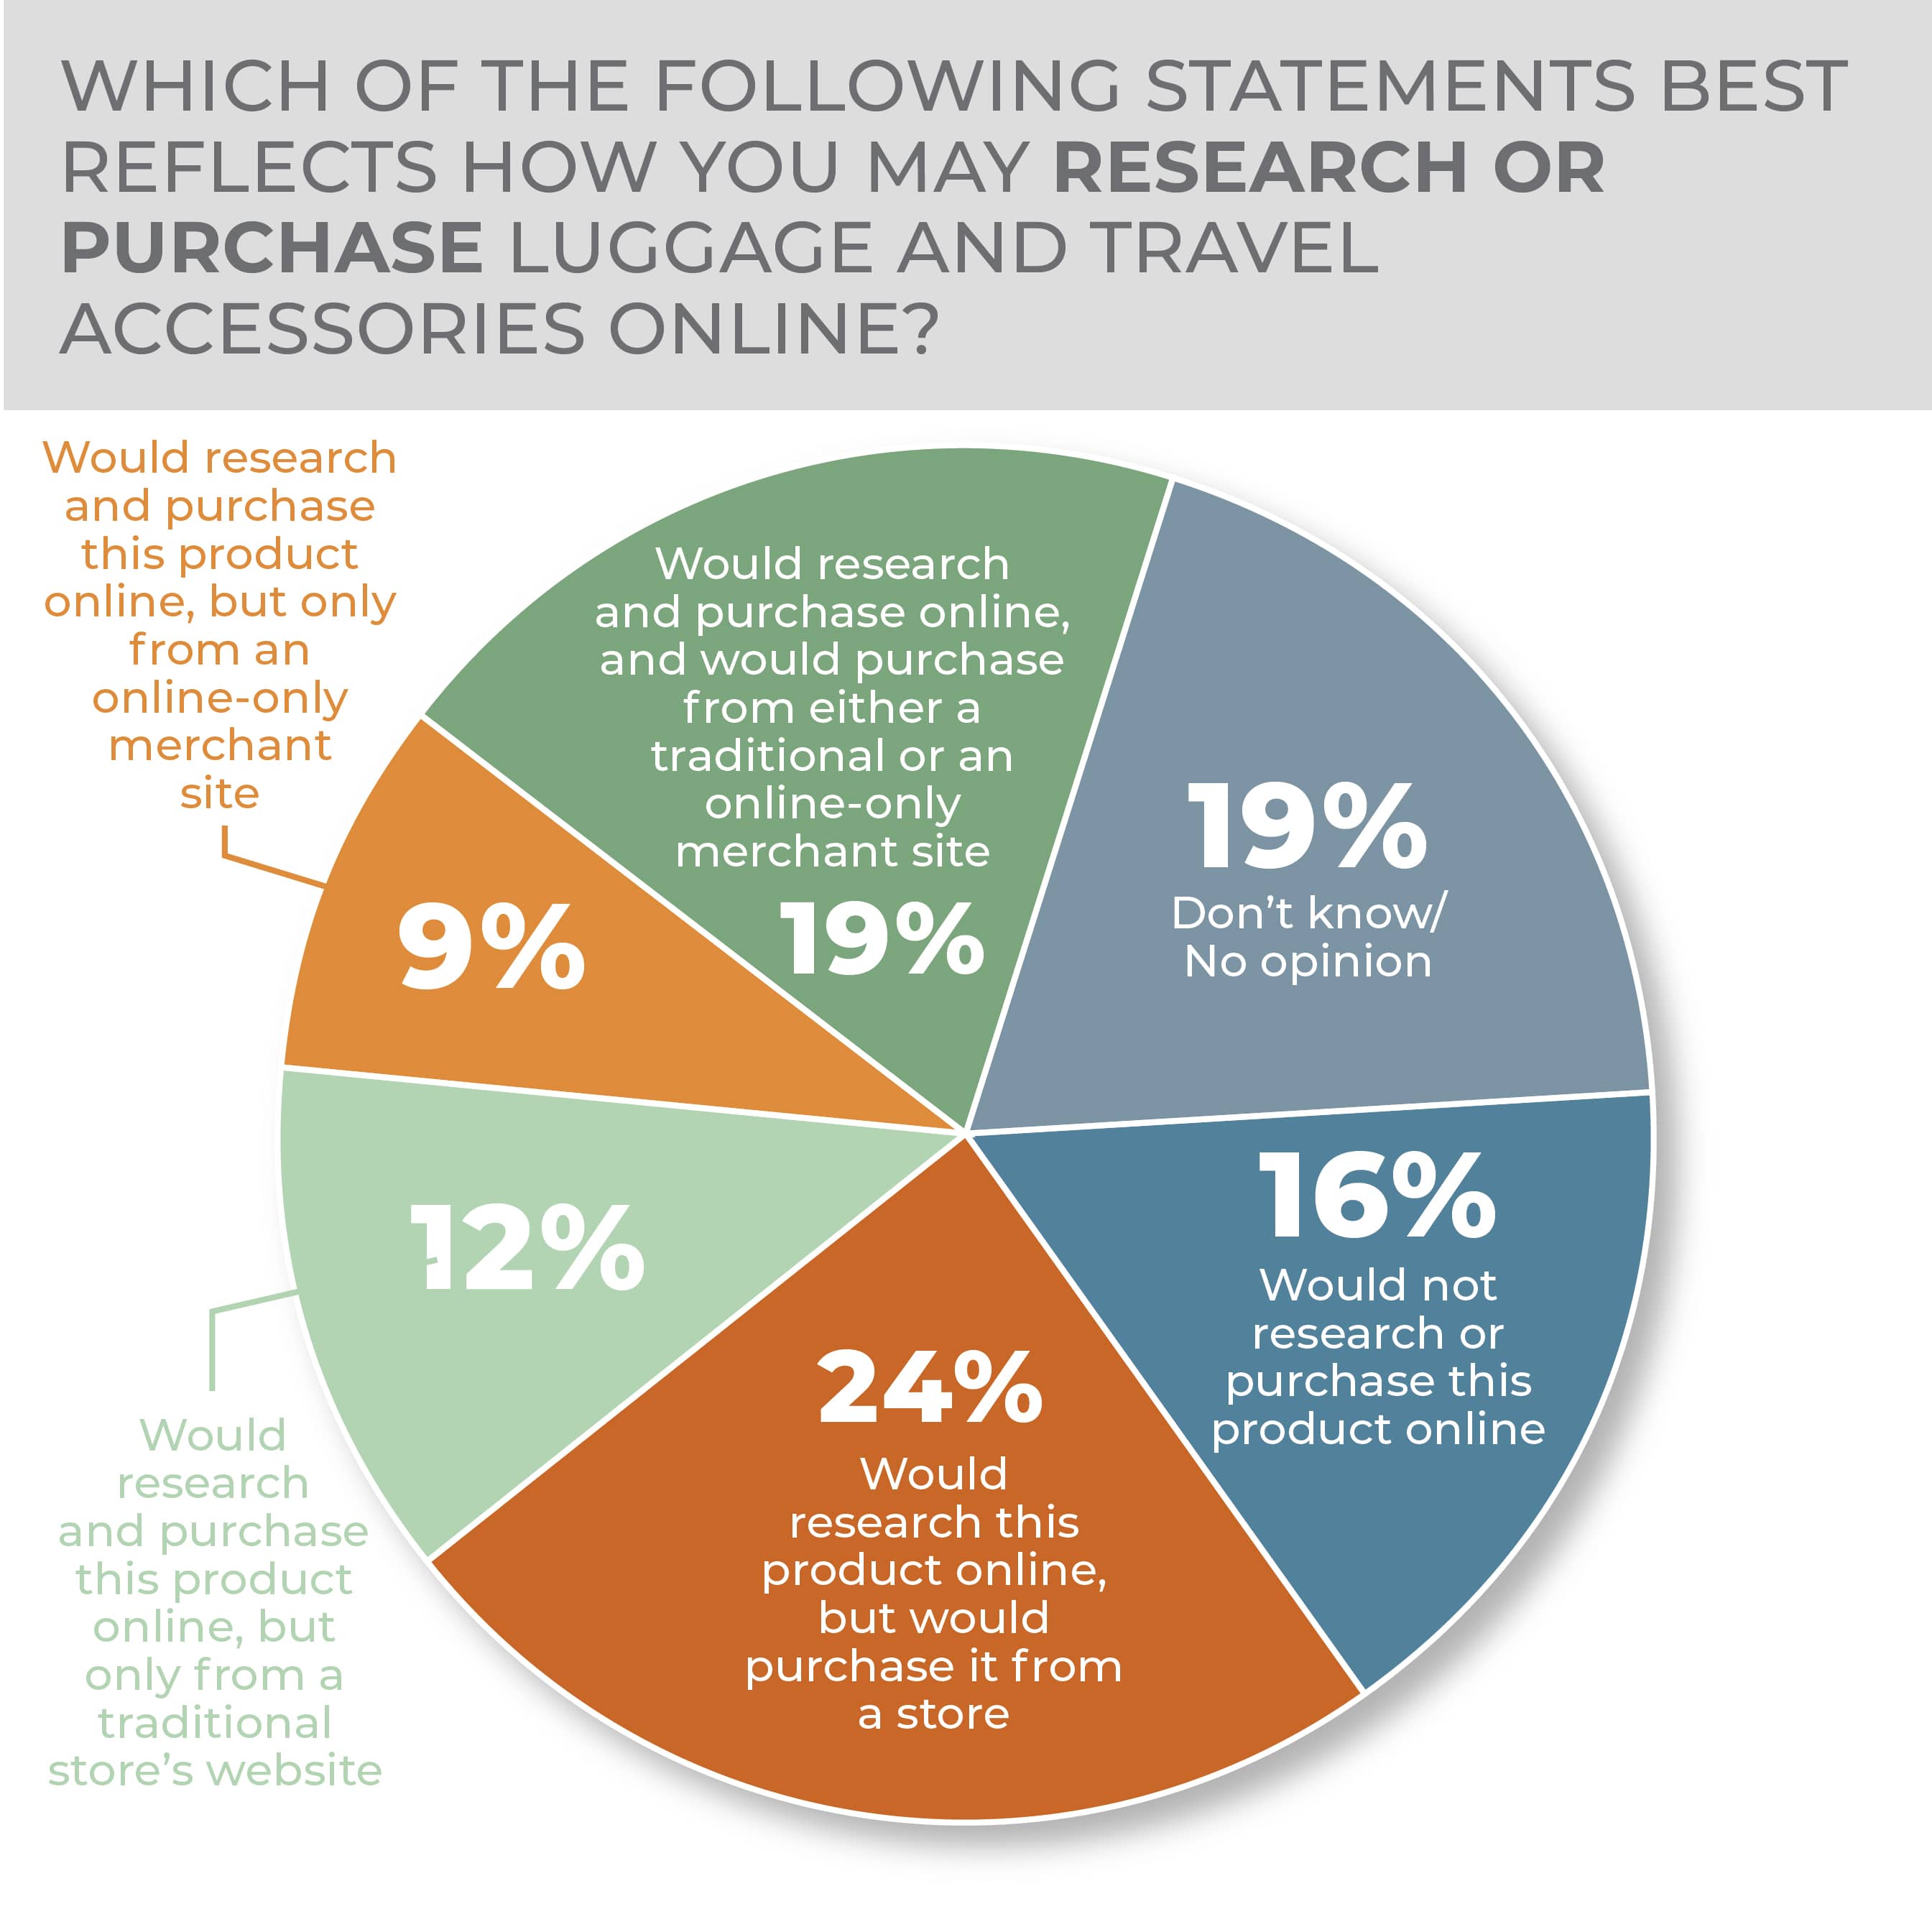
Luggage is a category where people tend to research online and buy in-store, at 24% in this year’s survey and almost flat from a year ago. Given that the second most favored response, would research and purchase online and buy from either a traditional or online-only merchant, and the third, would not research or purchase the product online, fall in the same order year over year, the survey still suggests that consumers lean toward in-store purchases but retain flexibility. Again, the question had a large proportion of don’t know/no opinion responses in this year’s survey and the one before, at 19% and 20% respectively, which is evidence that many consumers may not feel sure of how to purchase in the category.
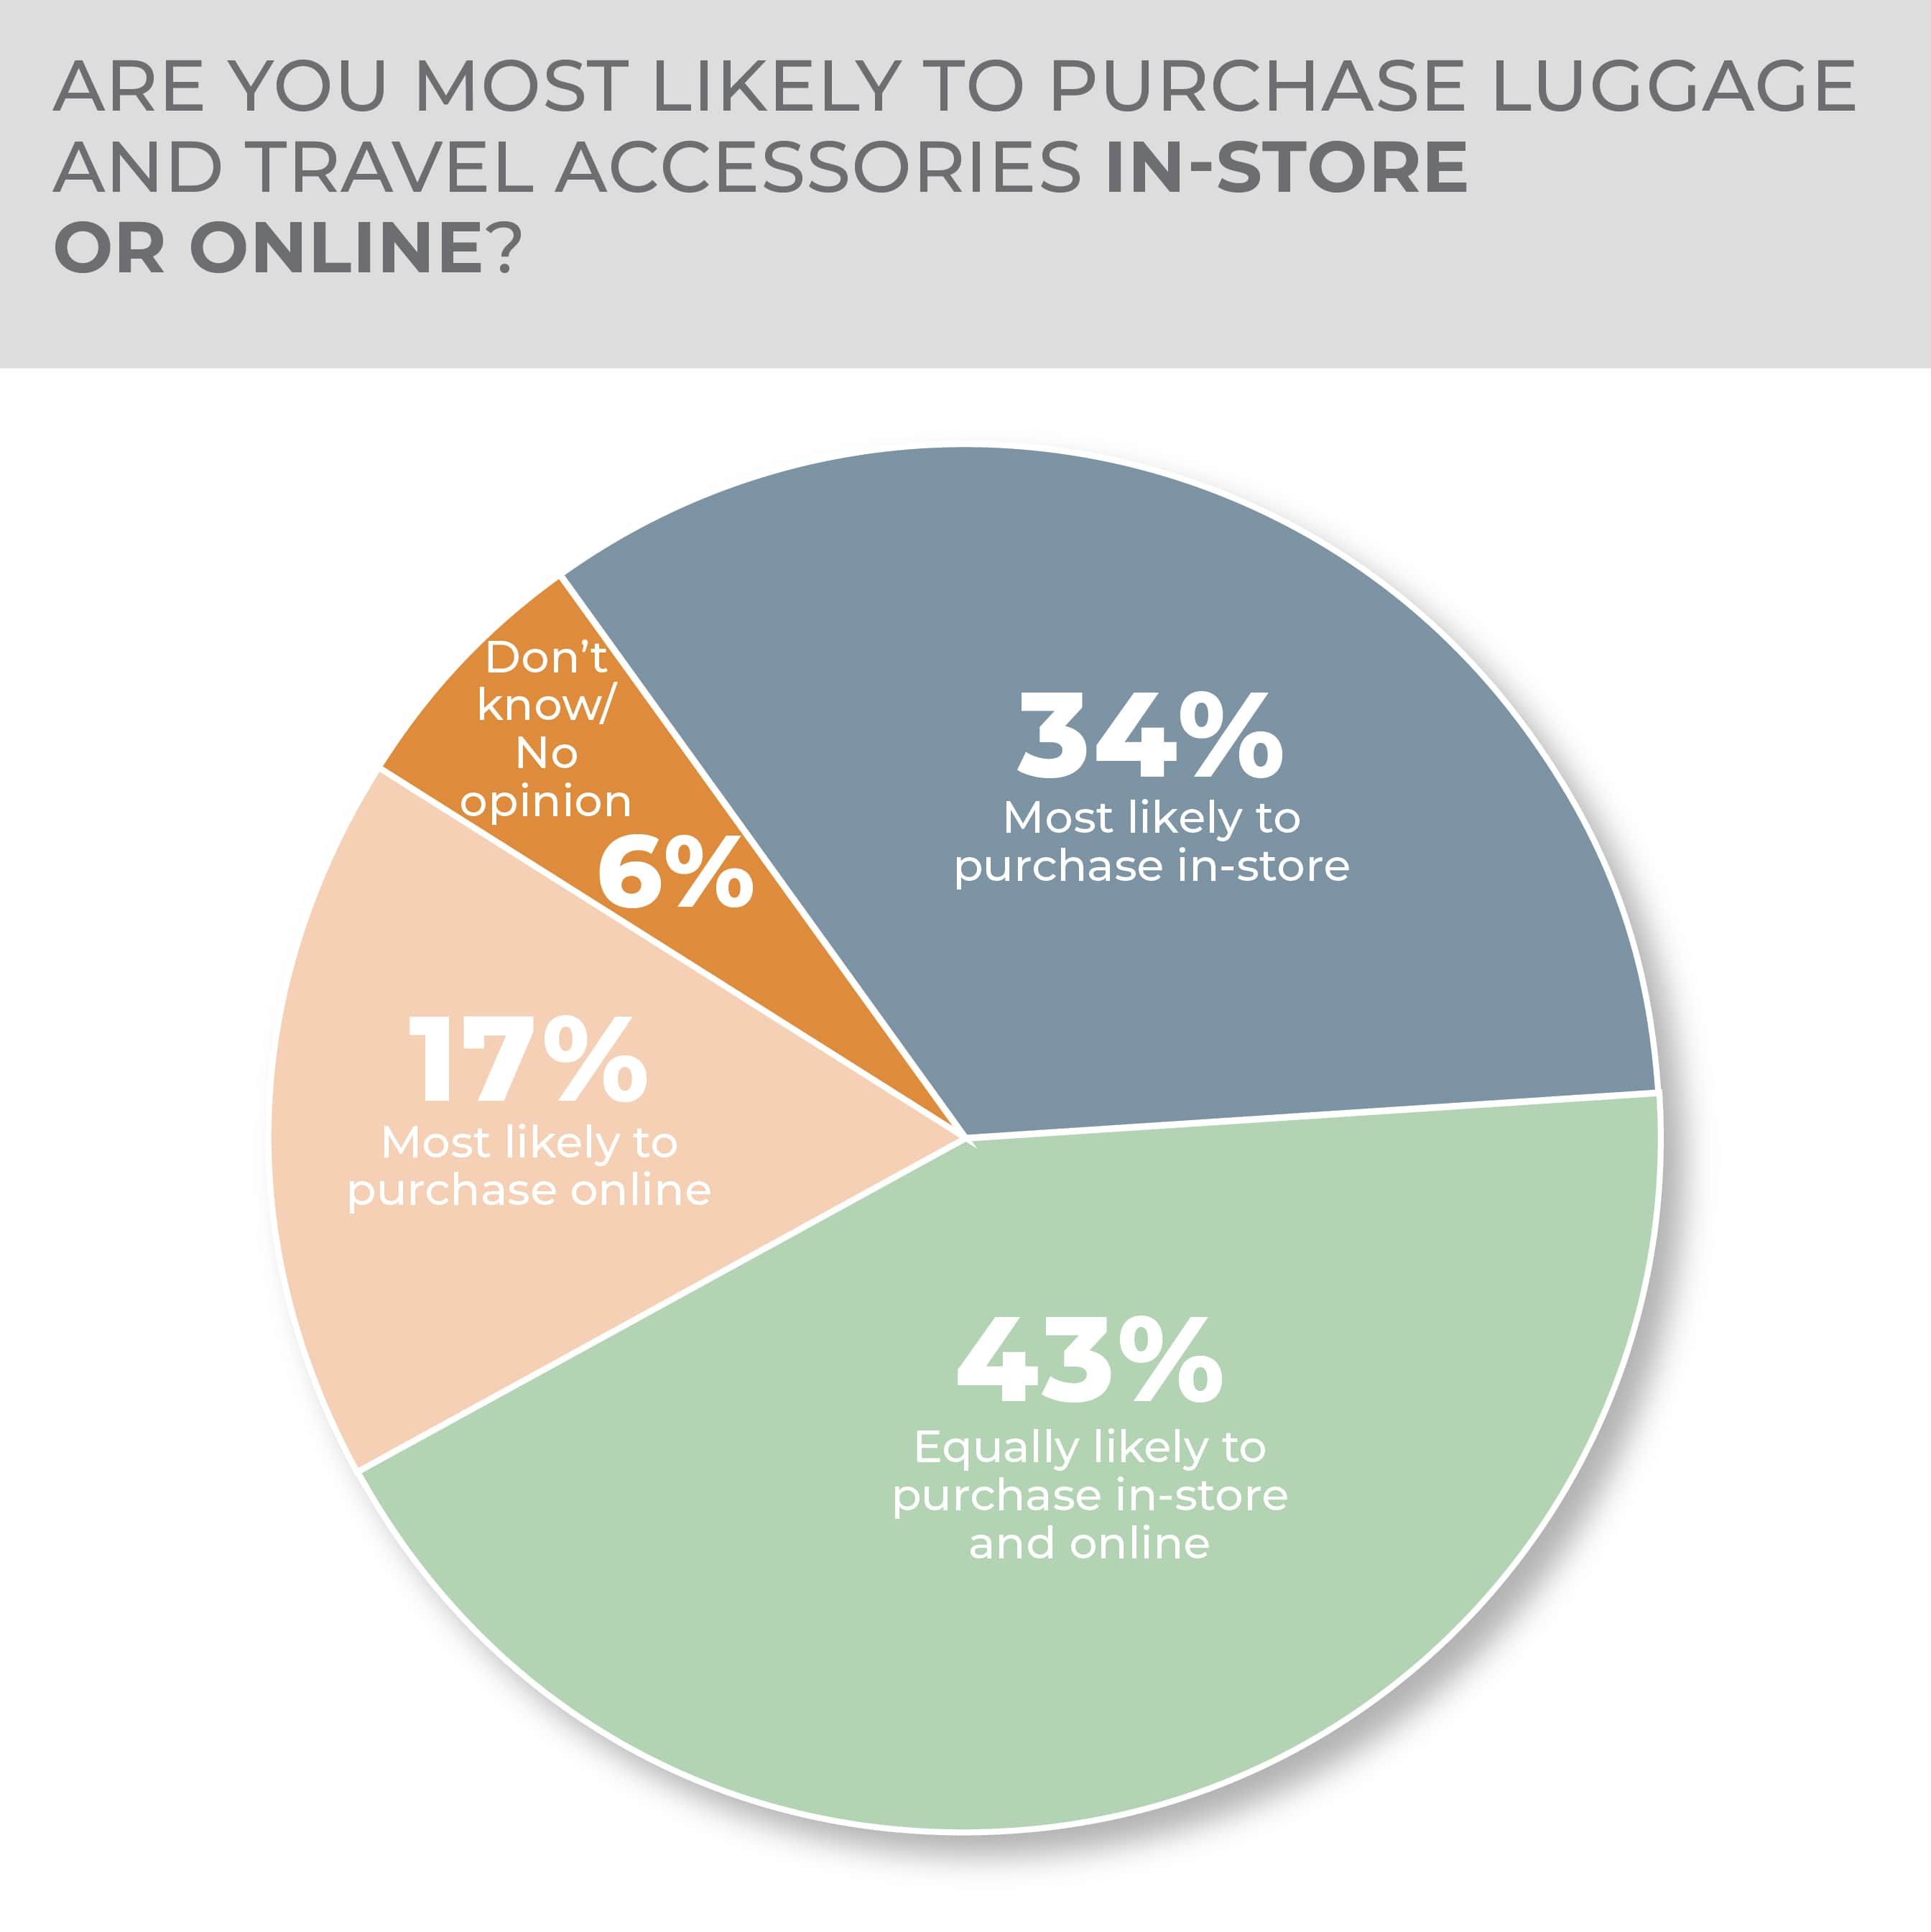
When directly asked where they are most likely to purchase luggage, a third of respondents said in-store and 43% said in-store or online. Only 17% said online, which gives the impression that the category has opportunities to make digital sales more attractive to consumers.
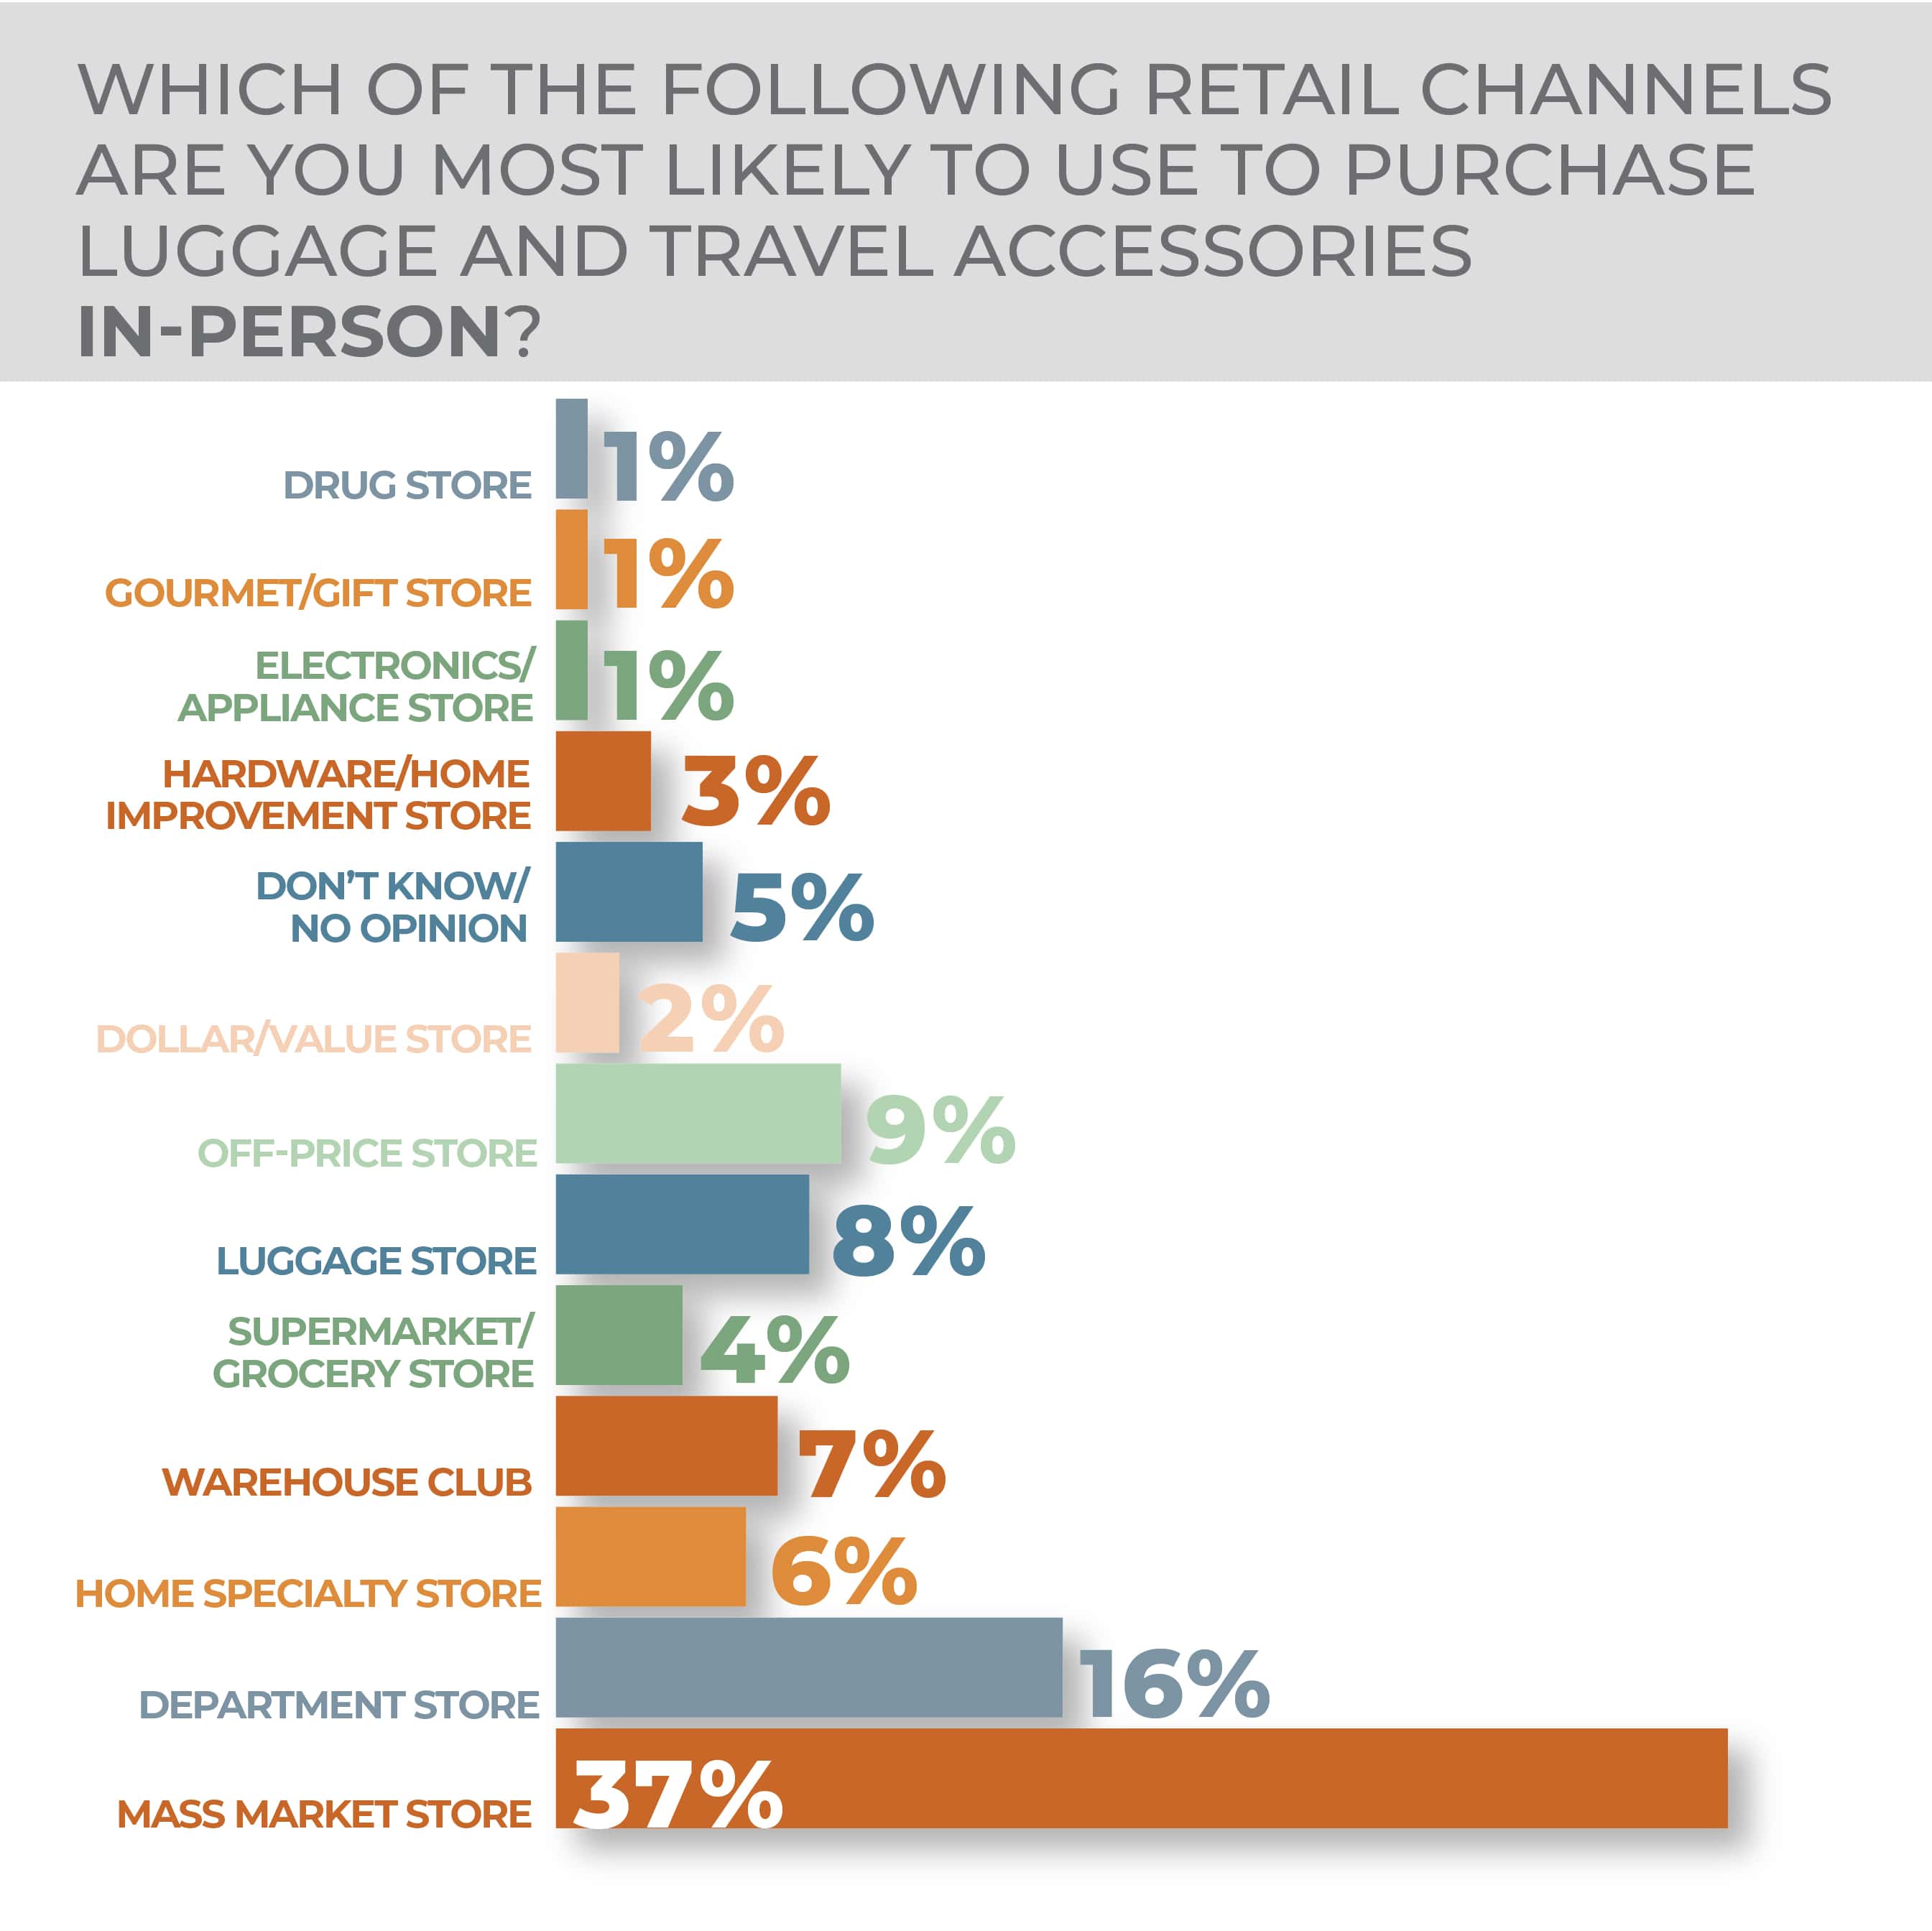
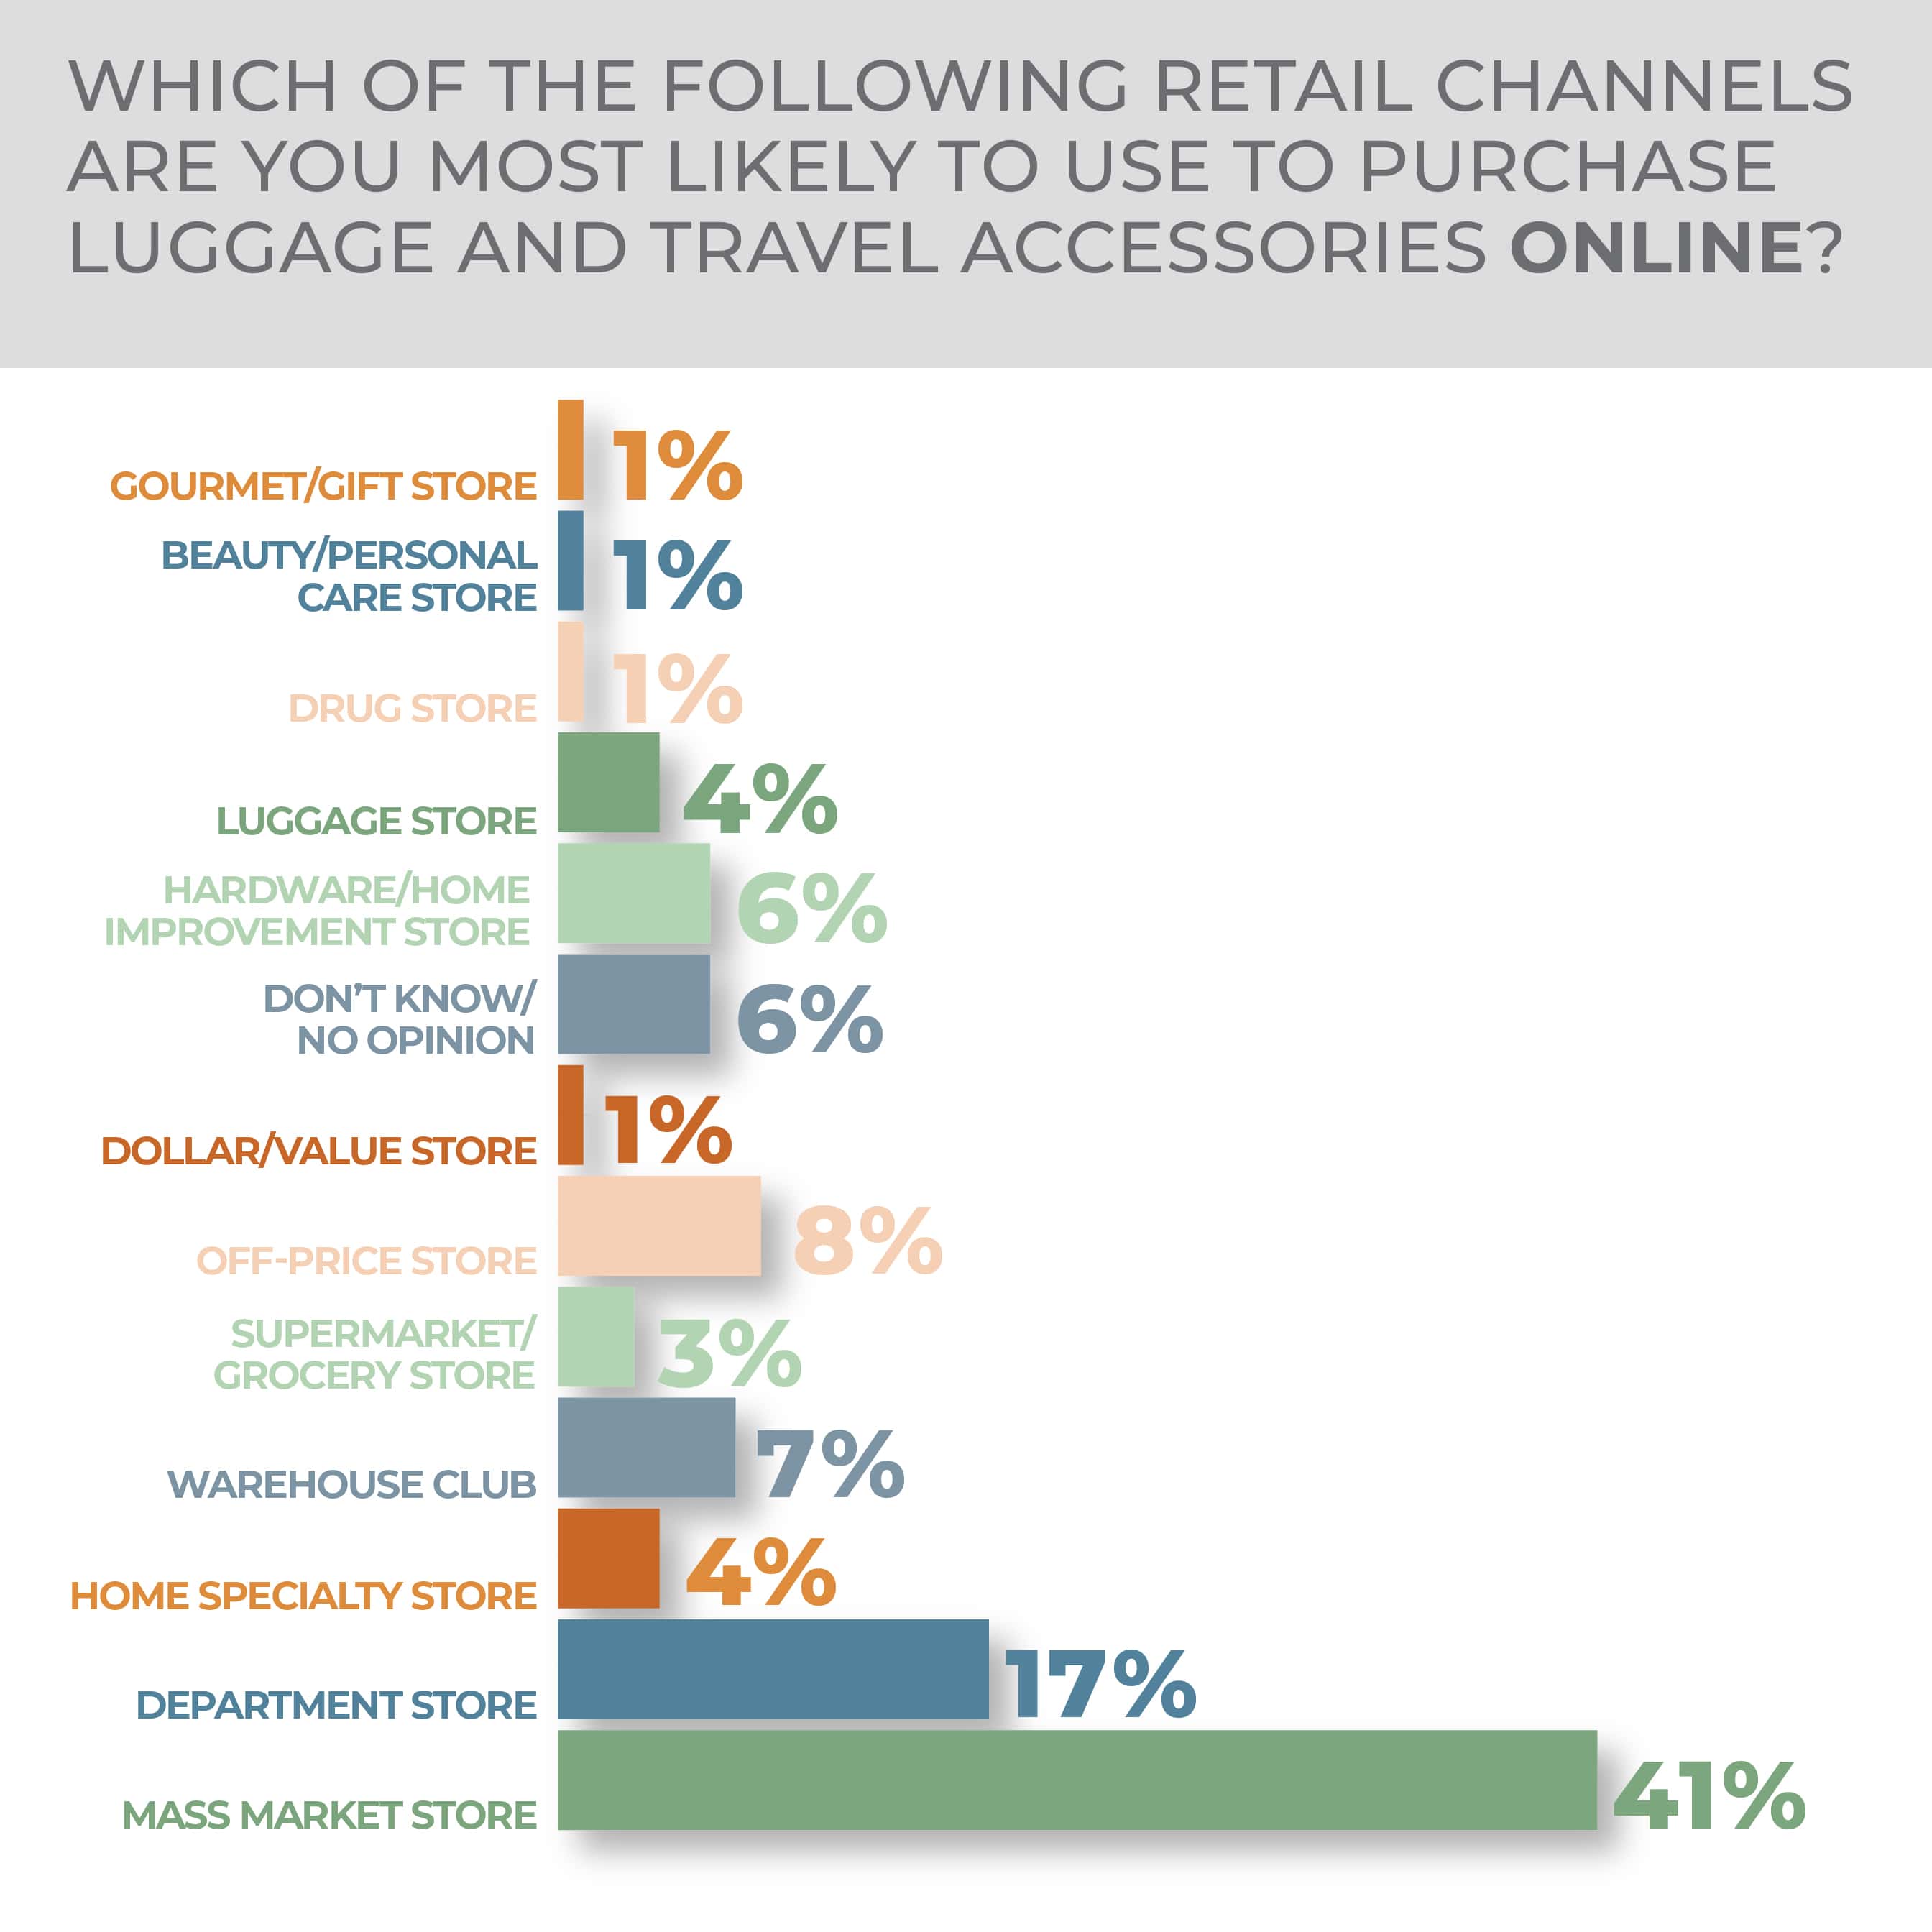
Even if there is some purchasing uncertainty in the category, just 8% of survey respondents said they would go to a luggage store to purchase in person. Mass market stores at 37% and department stores at 16% are the favored destinations for a store visit. Online, luggage stores are an even less popular destination, only targeted by 4% of respondents, with mass market and department stores, at 41% and 17% respectively, the foremost choices.
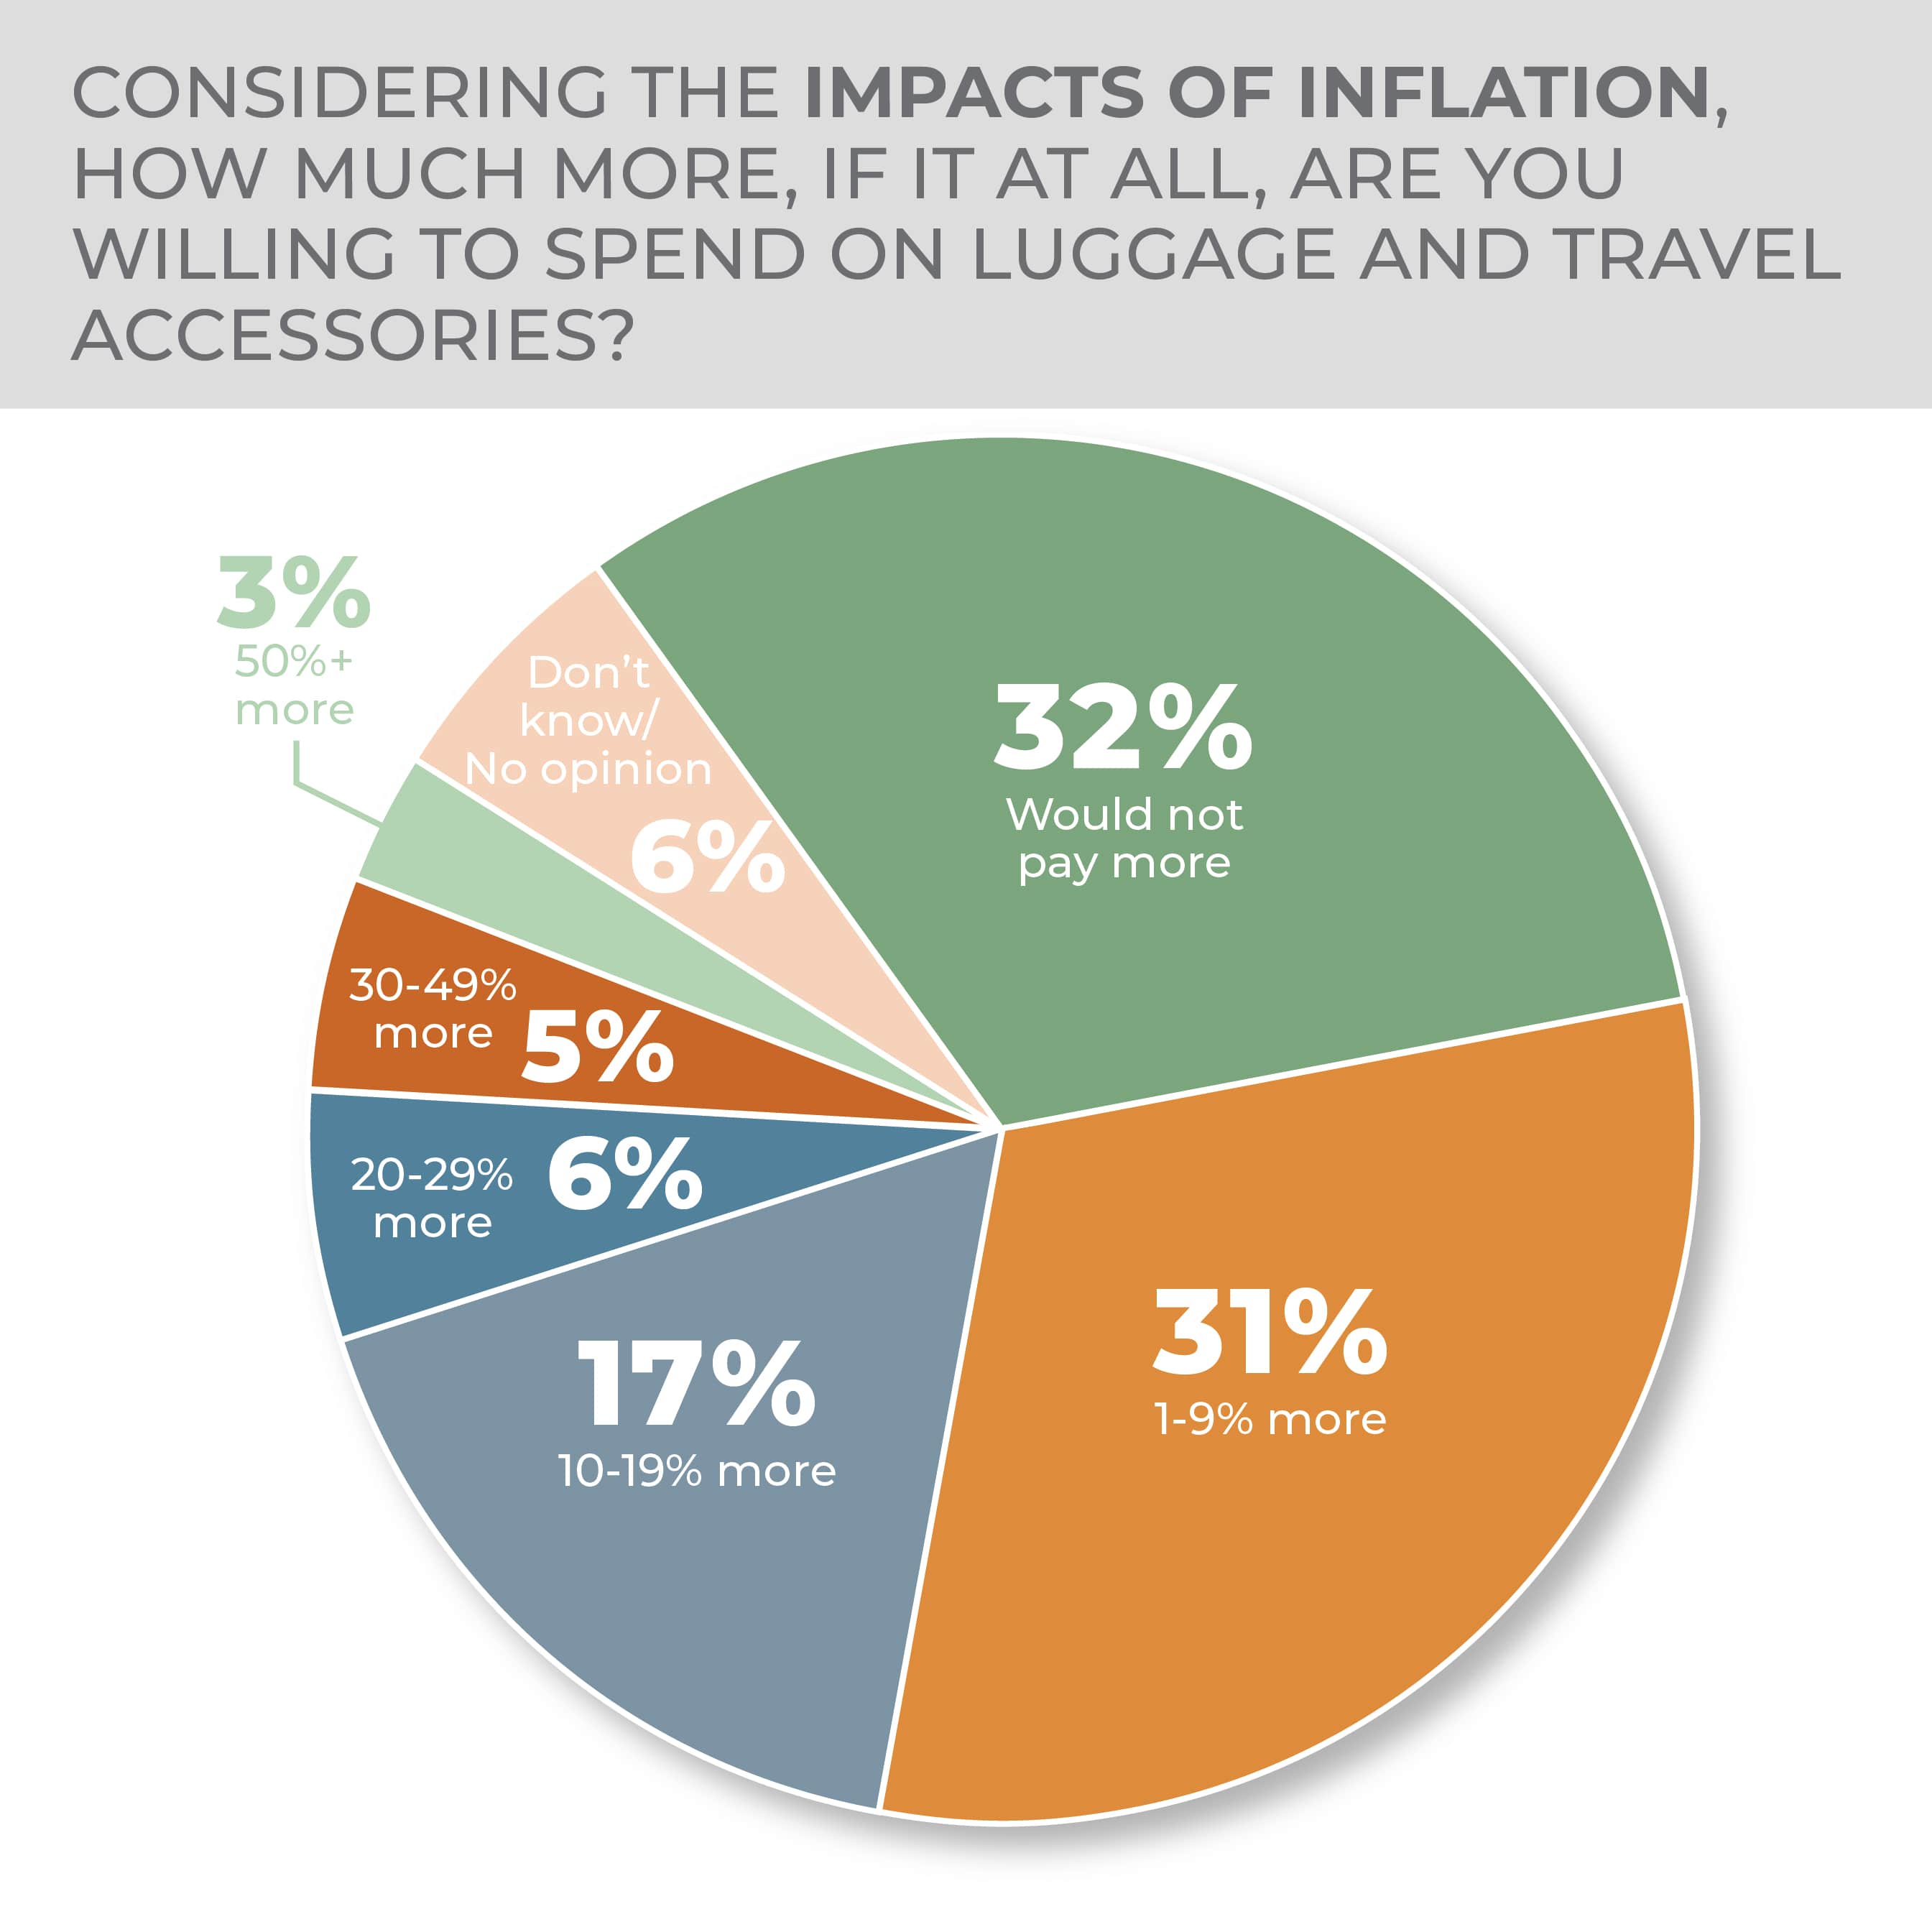
When it comes to inflation, about a third of consumers would not pay more for luggage and 31% said they would only pay 1% to 9% despite inflation, with 10% to 19% at 17%, which reflects that sellers are going to have a hard time getting consumers to spend substantially more in the category.
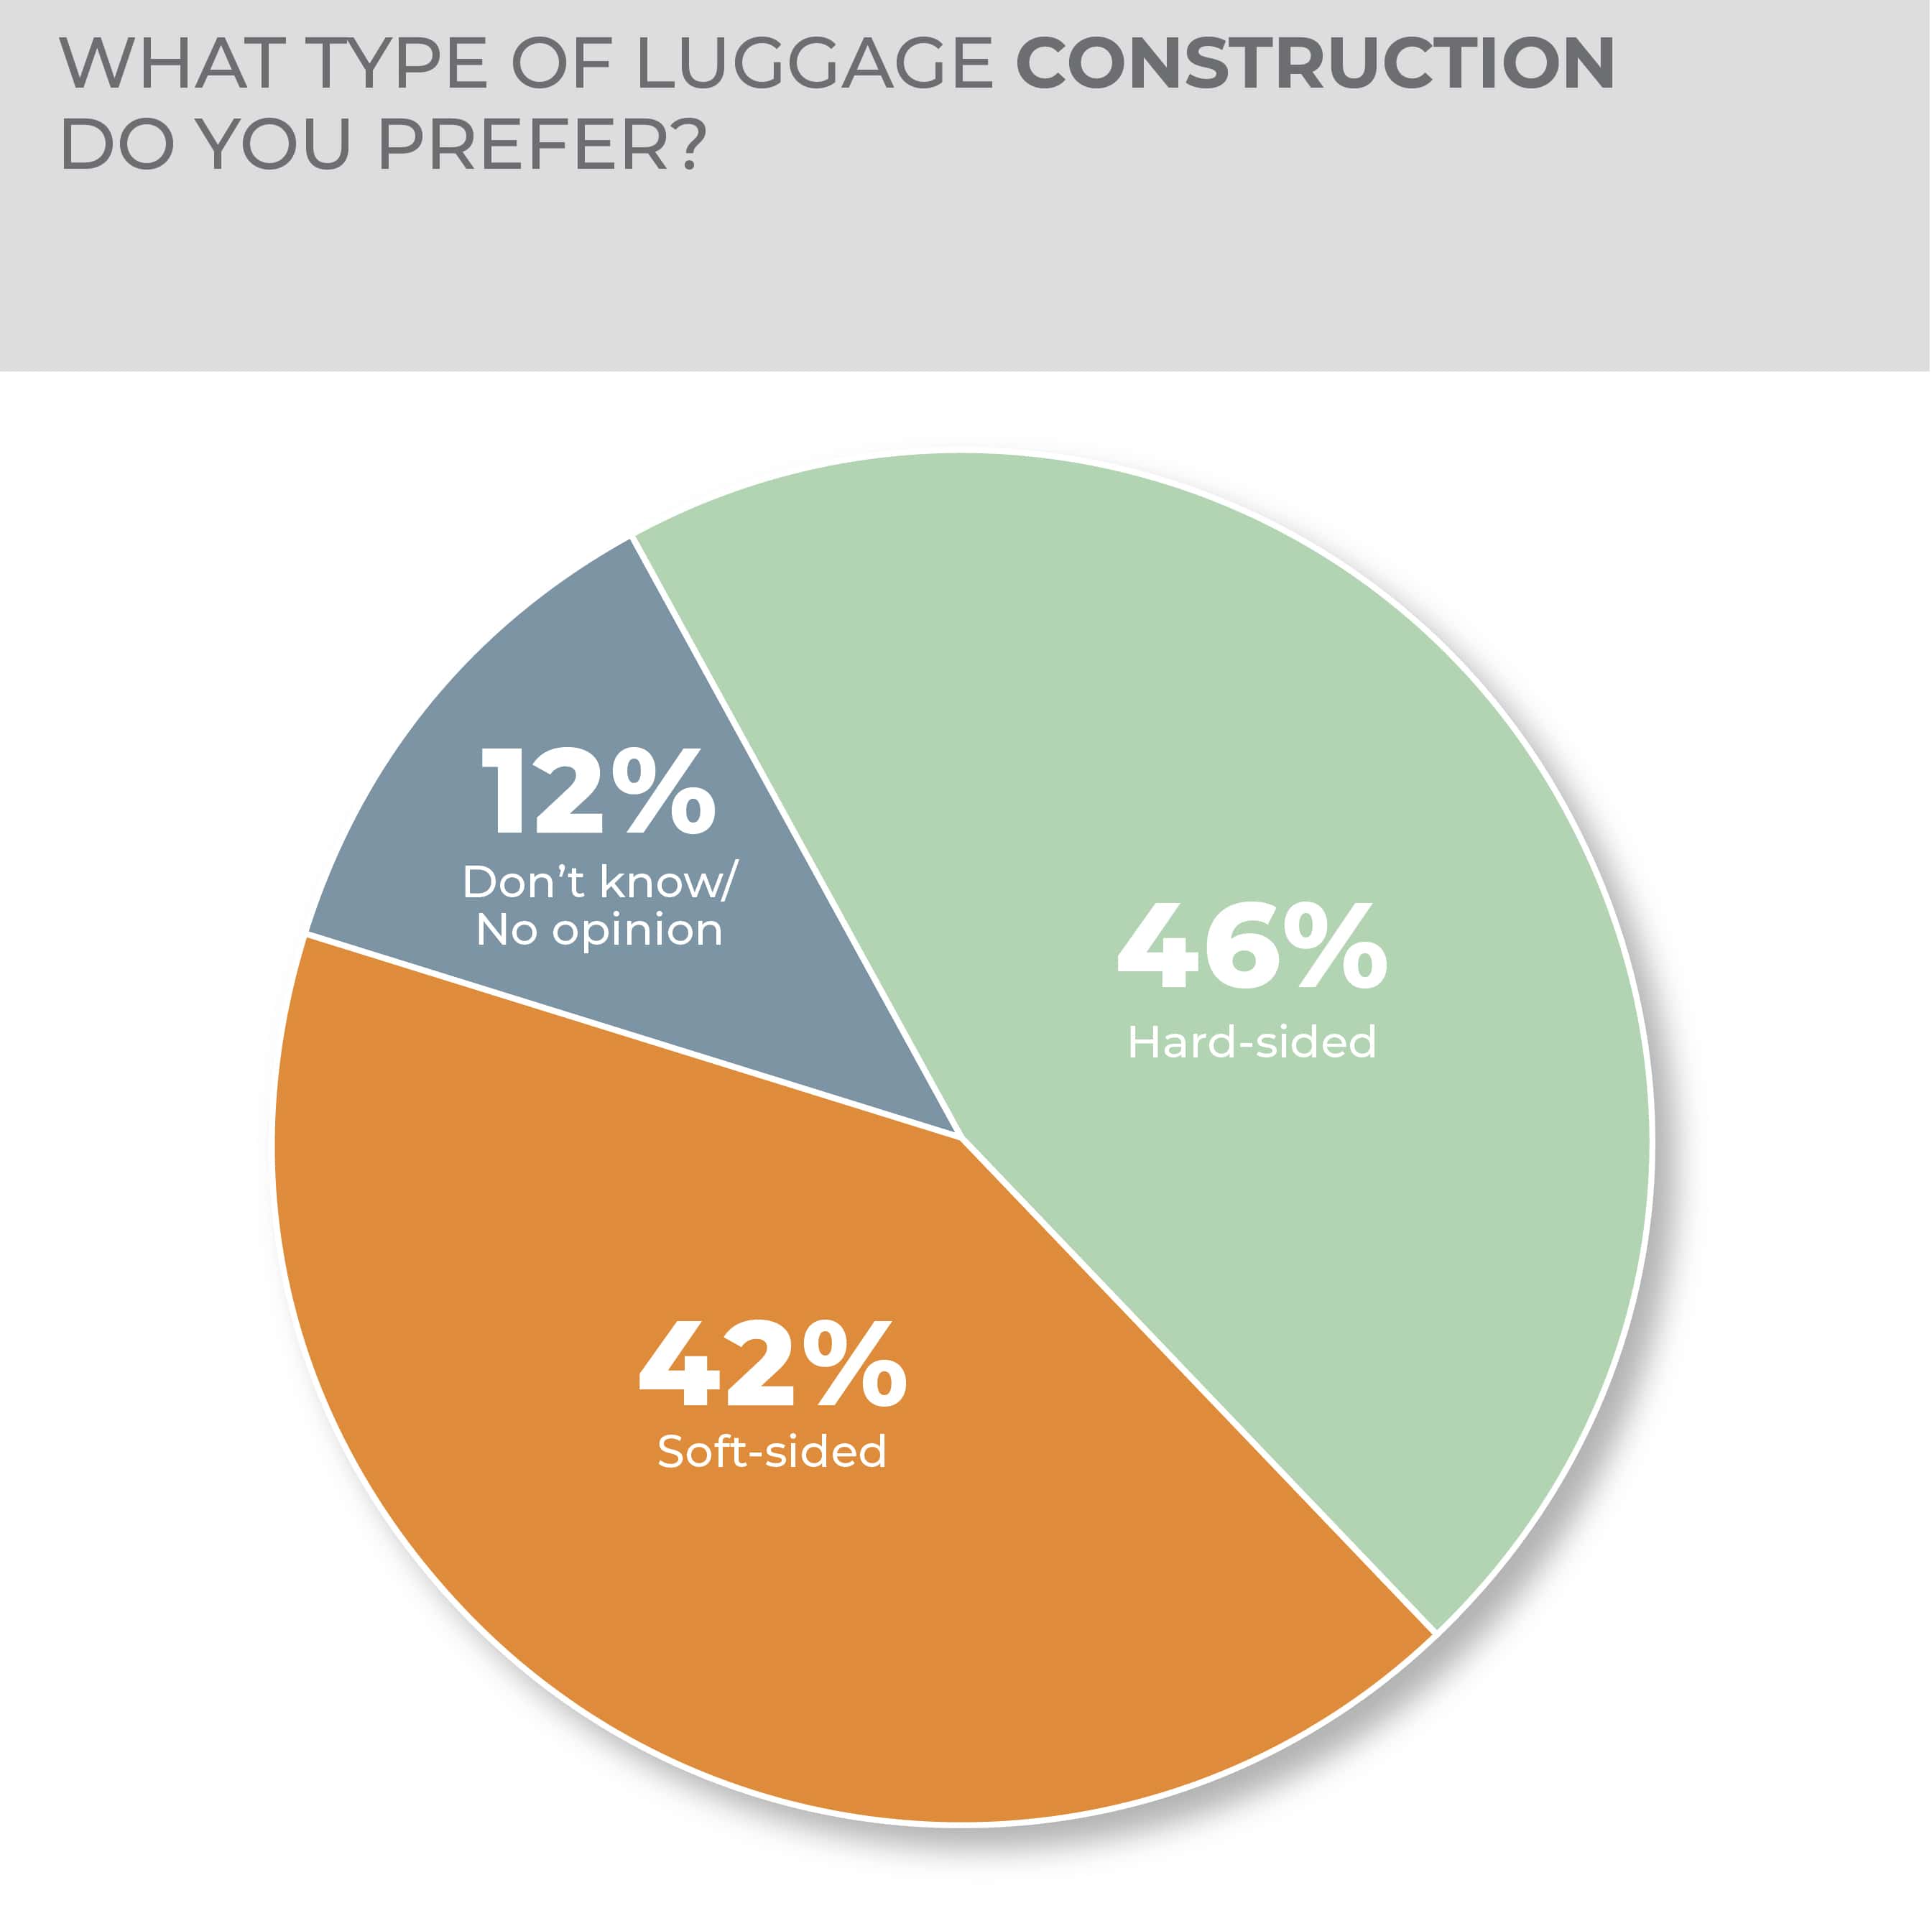
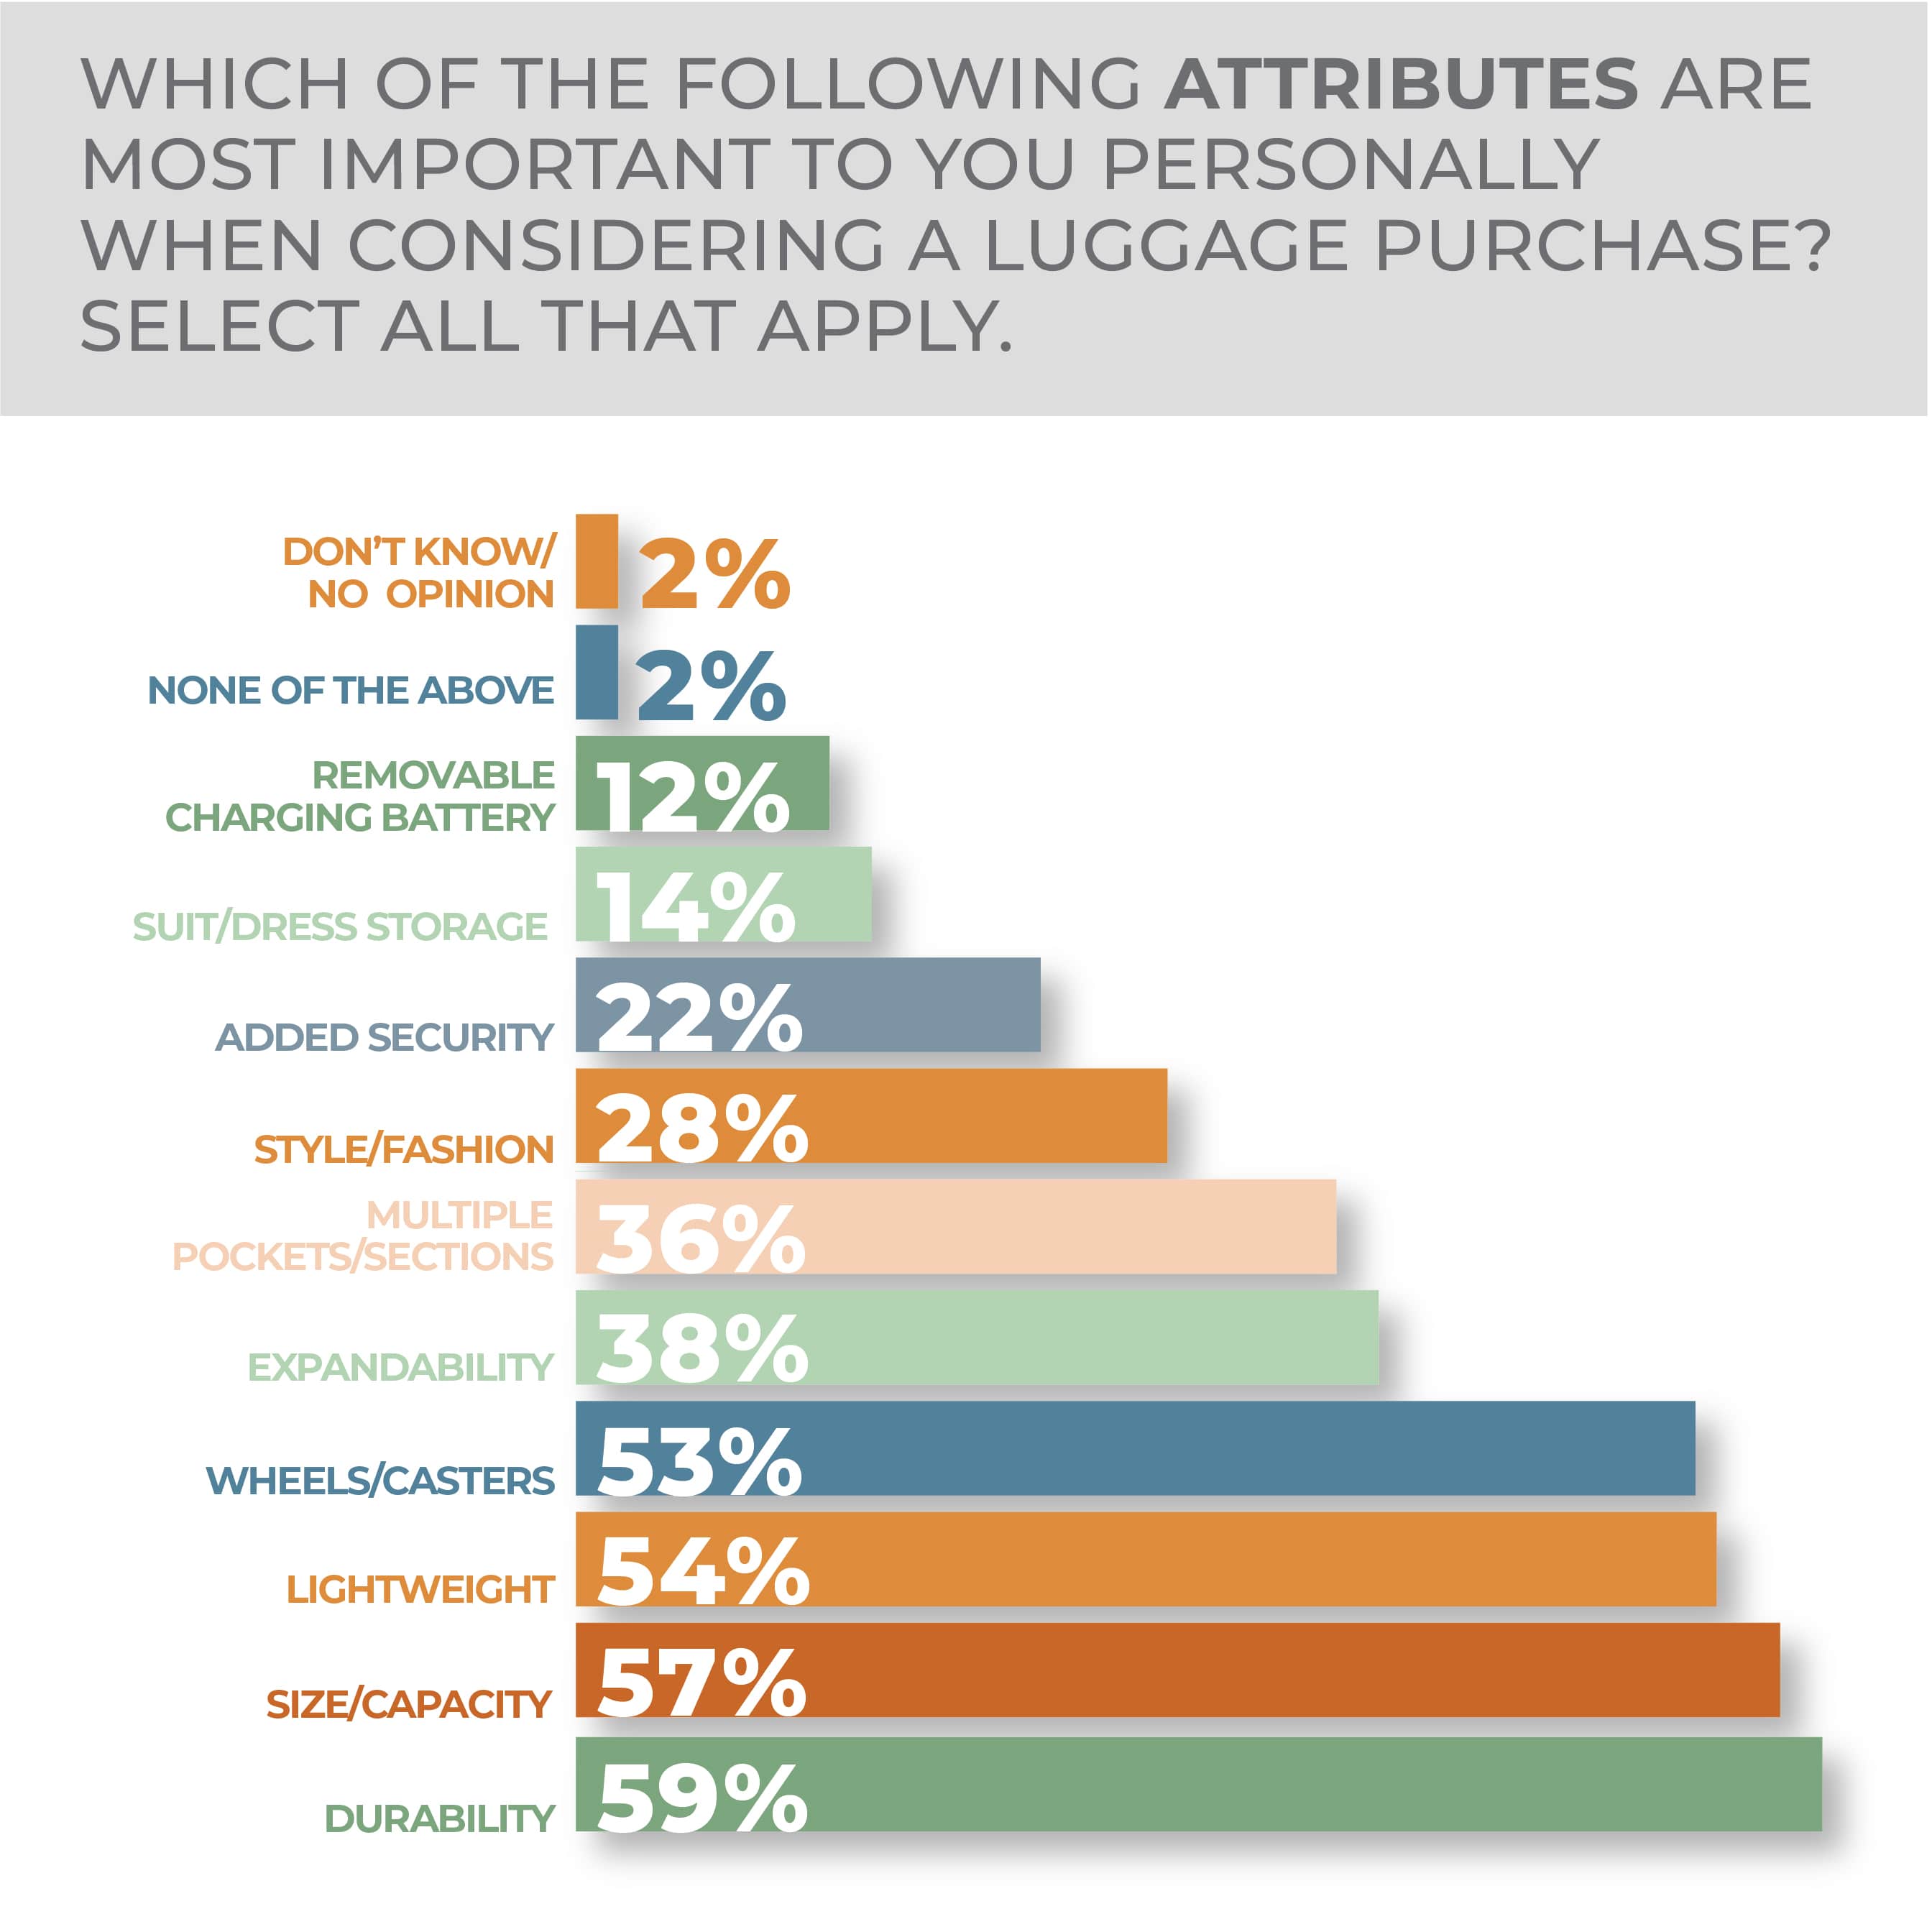
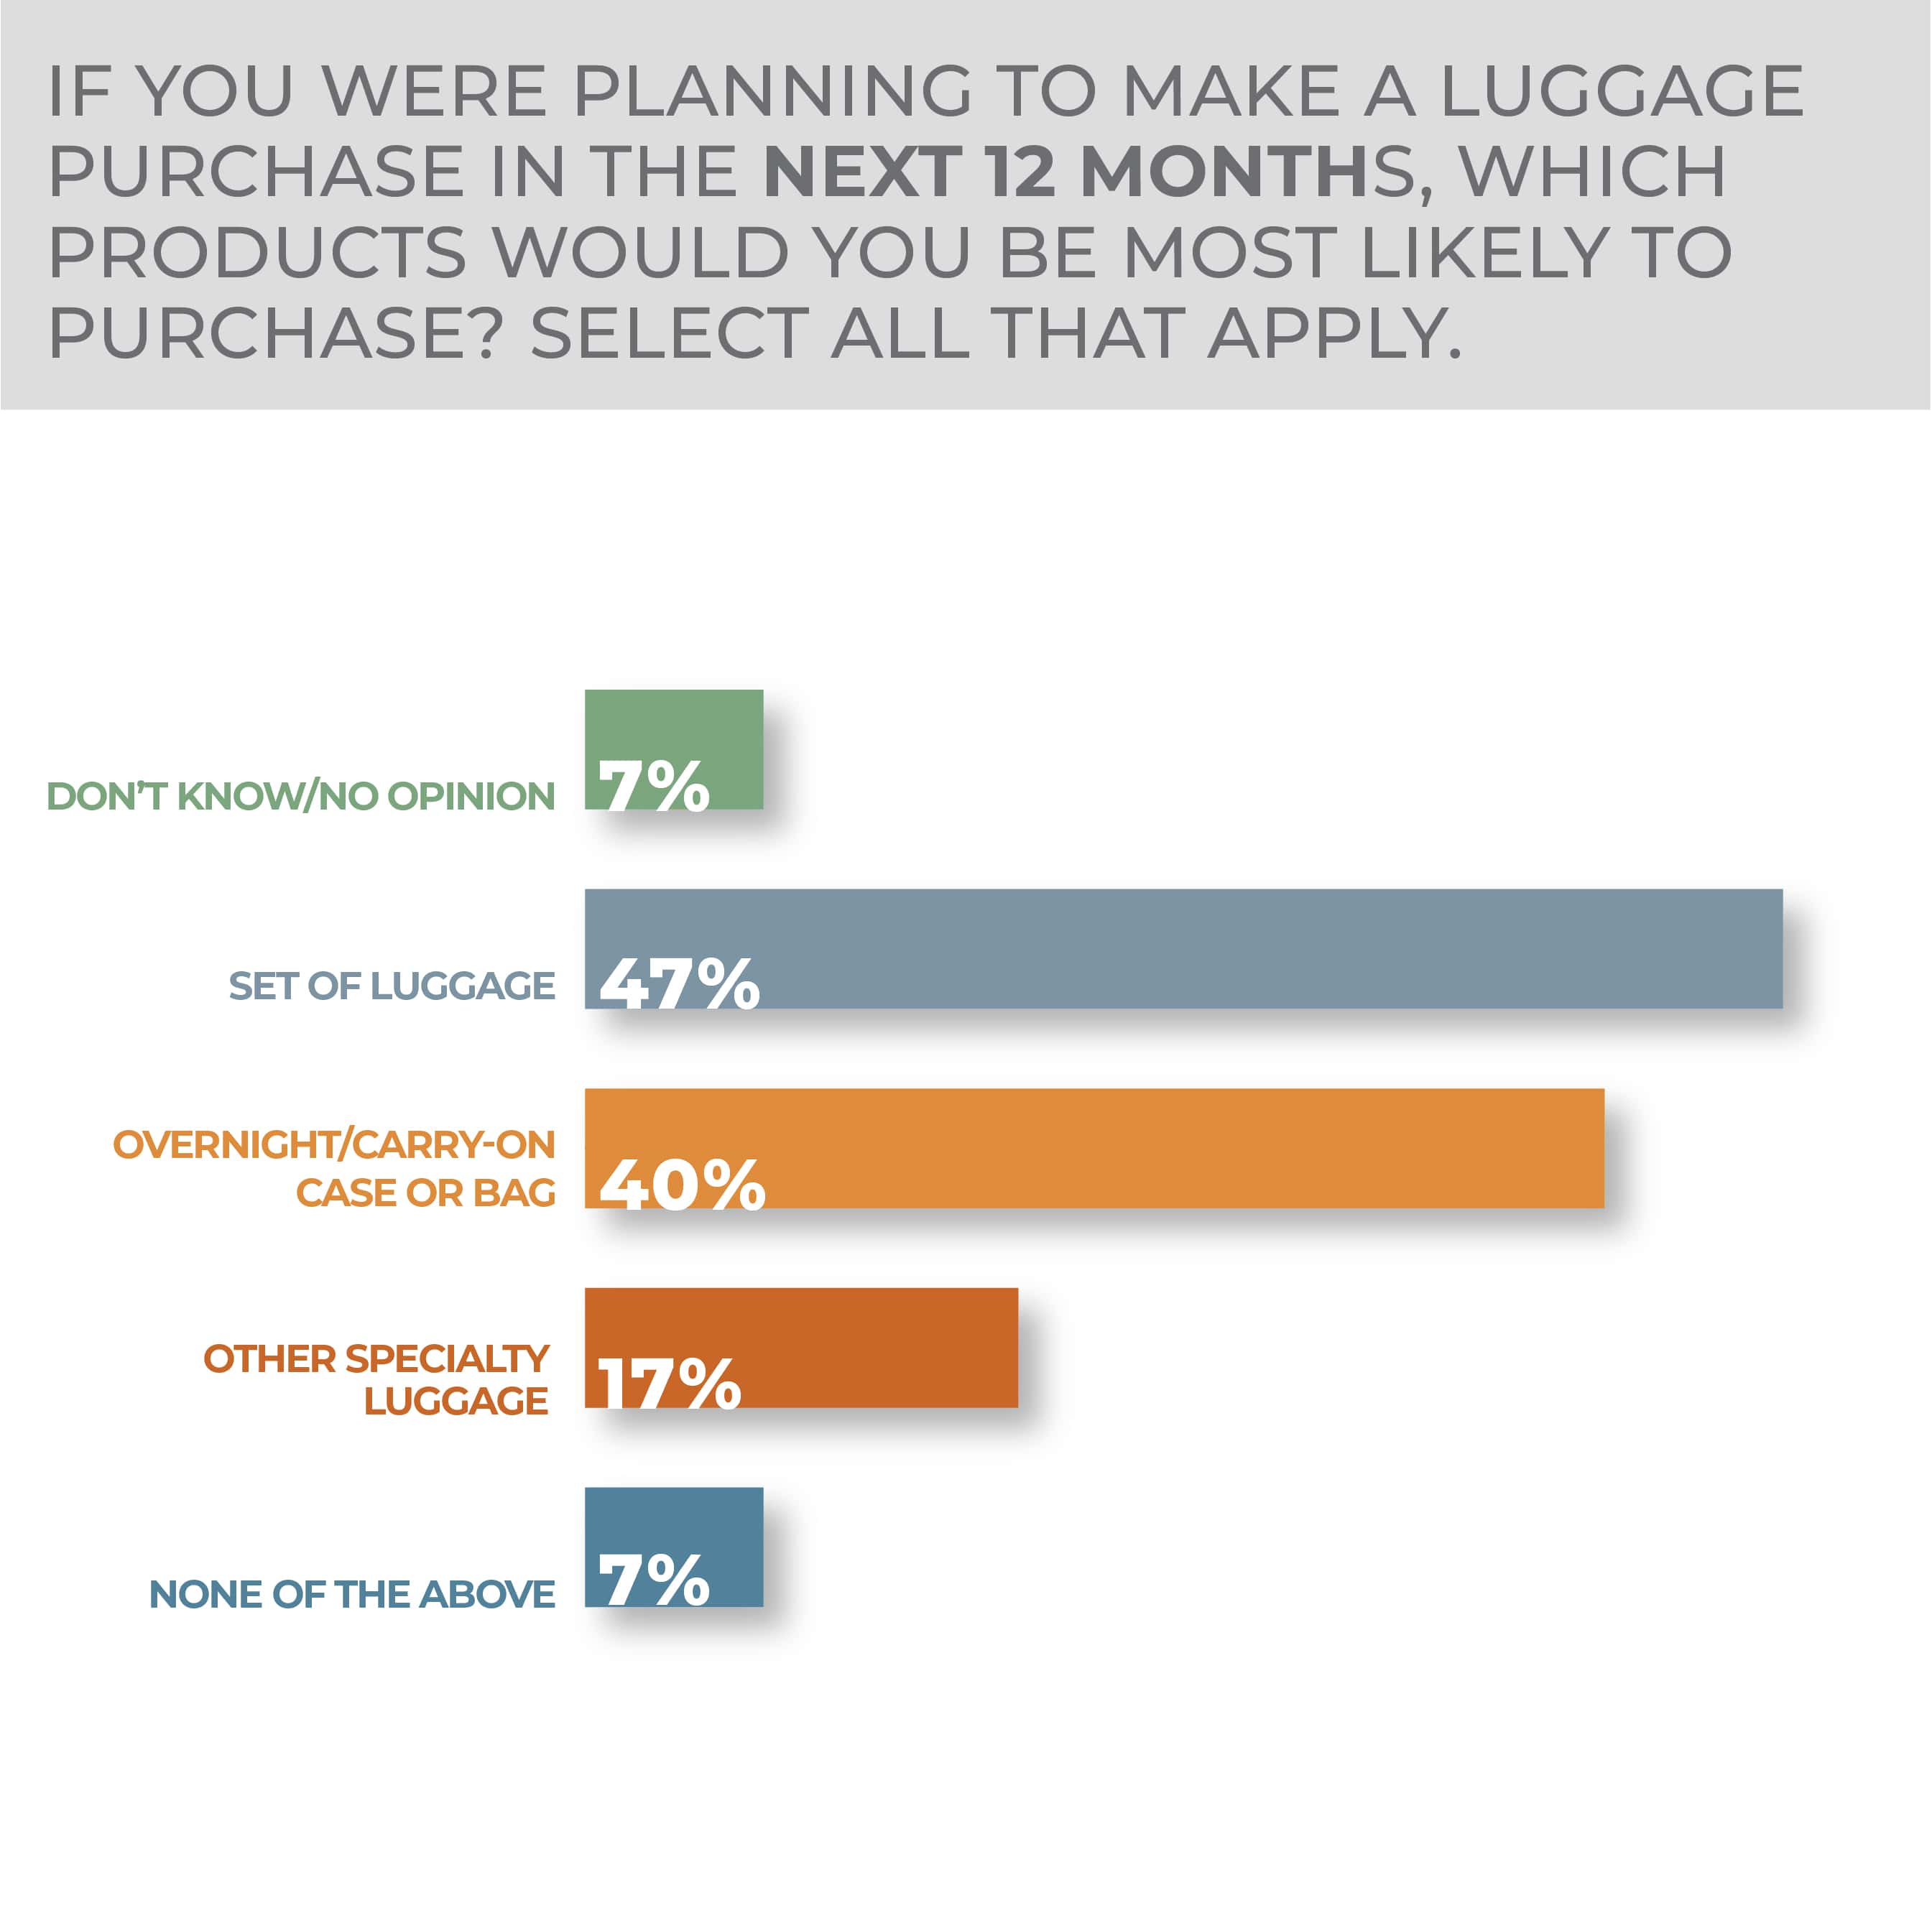
Potential luggage purchasers put some emphasis on sets, with 47% interested while overnight/carry-on bags sat at 40%. Hard-sided luggage is only slightly more popular than soft-sided. Although durability and capacity are top priorities for potential luggage and travel accessories buyers, at 59% and 57%, ease of travel is almost as important, with lightweight and on wheels and casters following just behind. Expandability, multiple pockets and sections, style and fashion, added security, suit and dress storage and inclusion of a charging battery all trail.
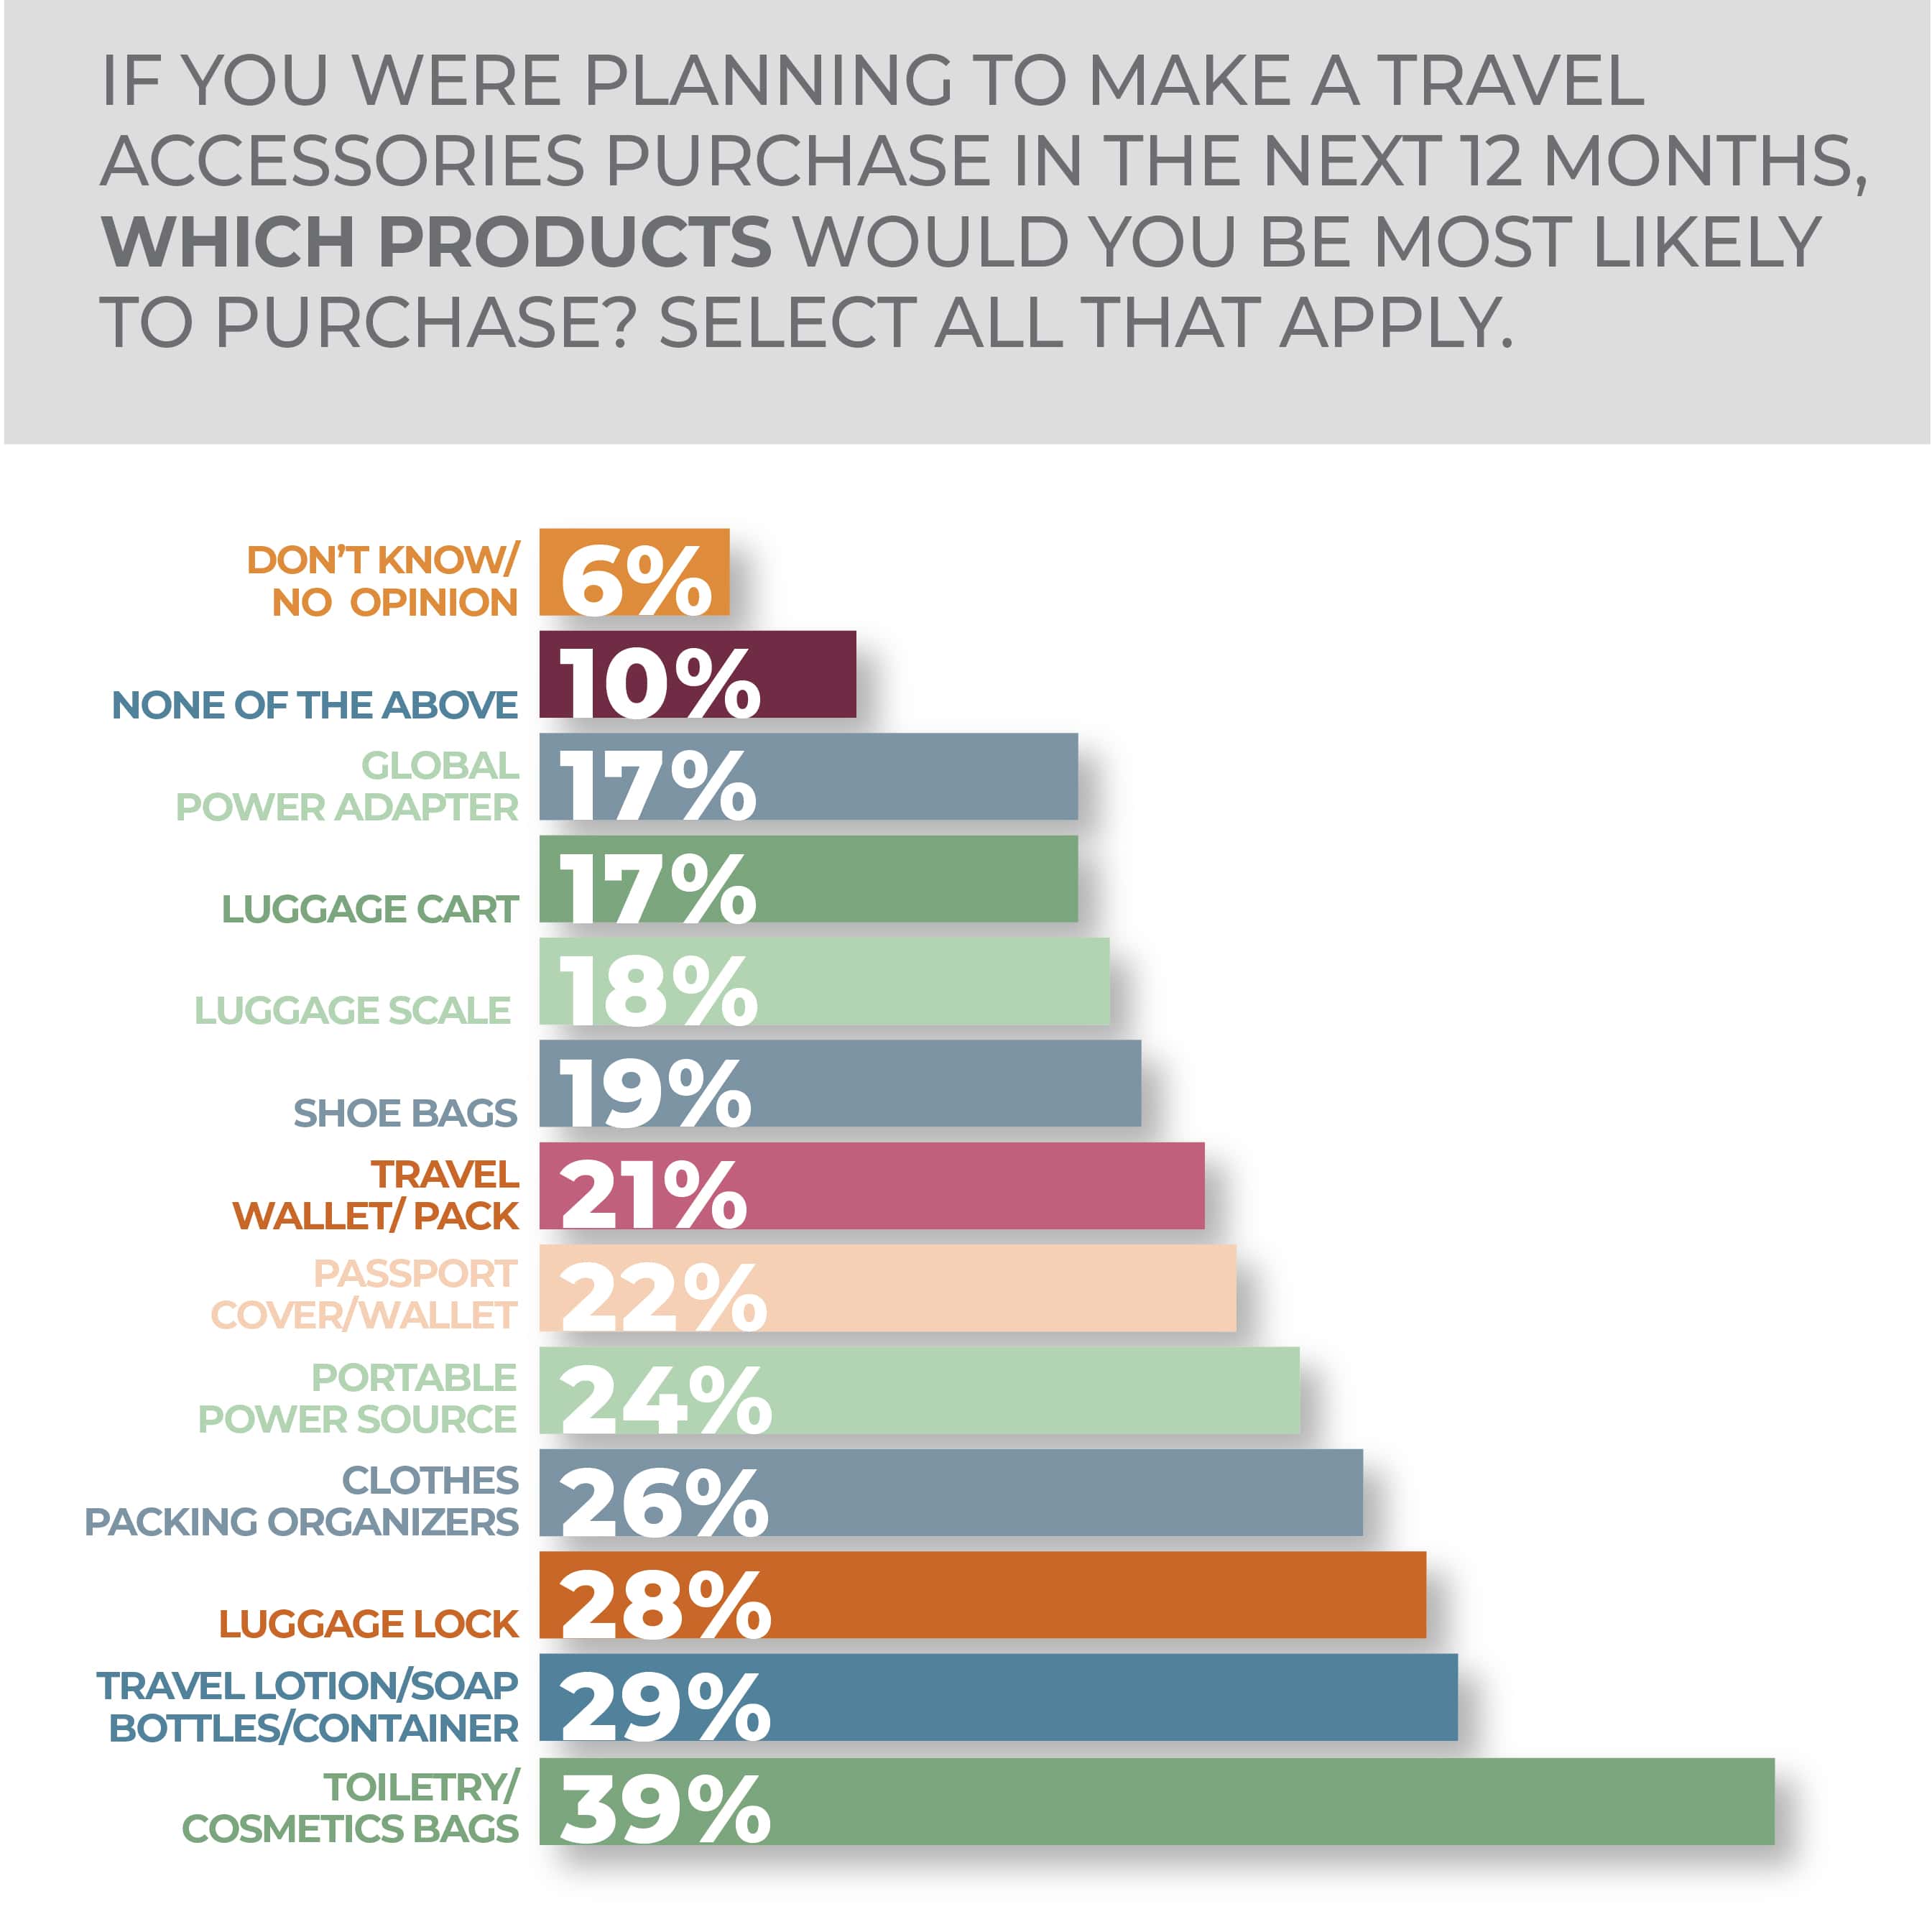
As for people thinking about buying travel accessories, toiletry and cosmetics bags are the first consideration at 39%, with a 10-point drop off to travel lotion and soap, followed closely by luggage locks, clothes packing organizers, portable power sources, passport covers and wallets, travel wallets and packs, shoe bags and luggage scales. Luggage carts and global power adapters were least likely, tied at 17%. None of the above ended up at 10% and don’t know/no opinion at 6%.
In breaking out purchasing intent, consumers 18-34 are most enthusiastic about luggage and travel accessories purchases at 18% very likely and 27% somewhat likely. Older Millennials 35-44 fall off to 13% very and 25% somewhat likely. Older groups fall off even further. Men and women come in at about the same—purchase likelihood at 9% very and 19% somewhat likely for men and 10% and 18%, respectively, for women.
By region, Northeasterners are most enthusiastic to purchase luggage and travel accessories, at 13% very and 15% somewhat likely, with Southerners at 11% and 18%, respectively, but Westerners are thinking about it, at 8% and 22%, with Midwesterners behind.
More Luggage & Travel Accessories Findings:
-
- Younger consumers, especially those 18-34, are the most inclined to make a purchase in the luggage and travel accessories category.
- Consumers continue to gravitate to in-store purchases in the luggage and travel accessories category.
Outdoor Living
Outdoor living has brought new dimensions to domestic lifestyles and, even if energized by the COVID-19 pandemic, recent gains followed on years of gradual buildup as consumers sought to get more from their homes.
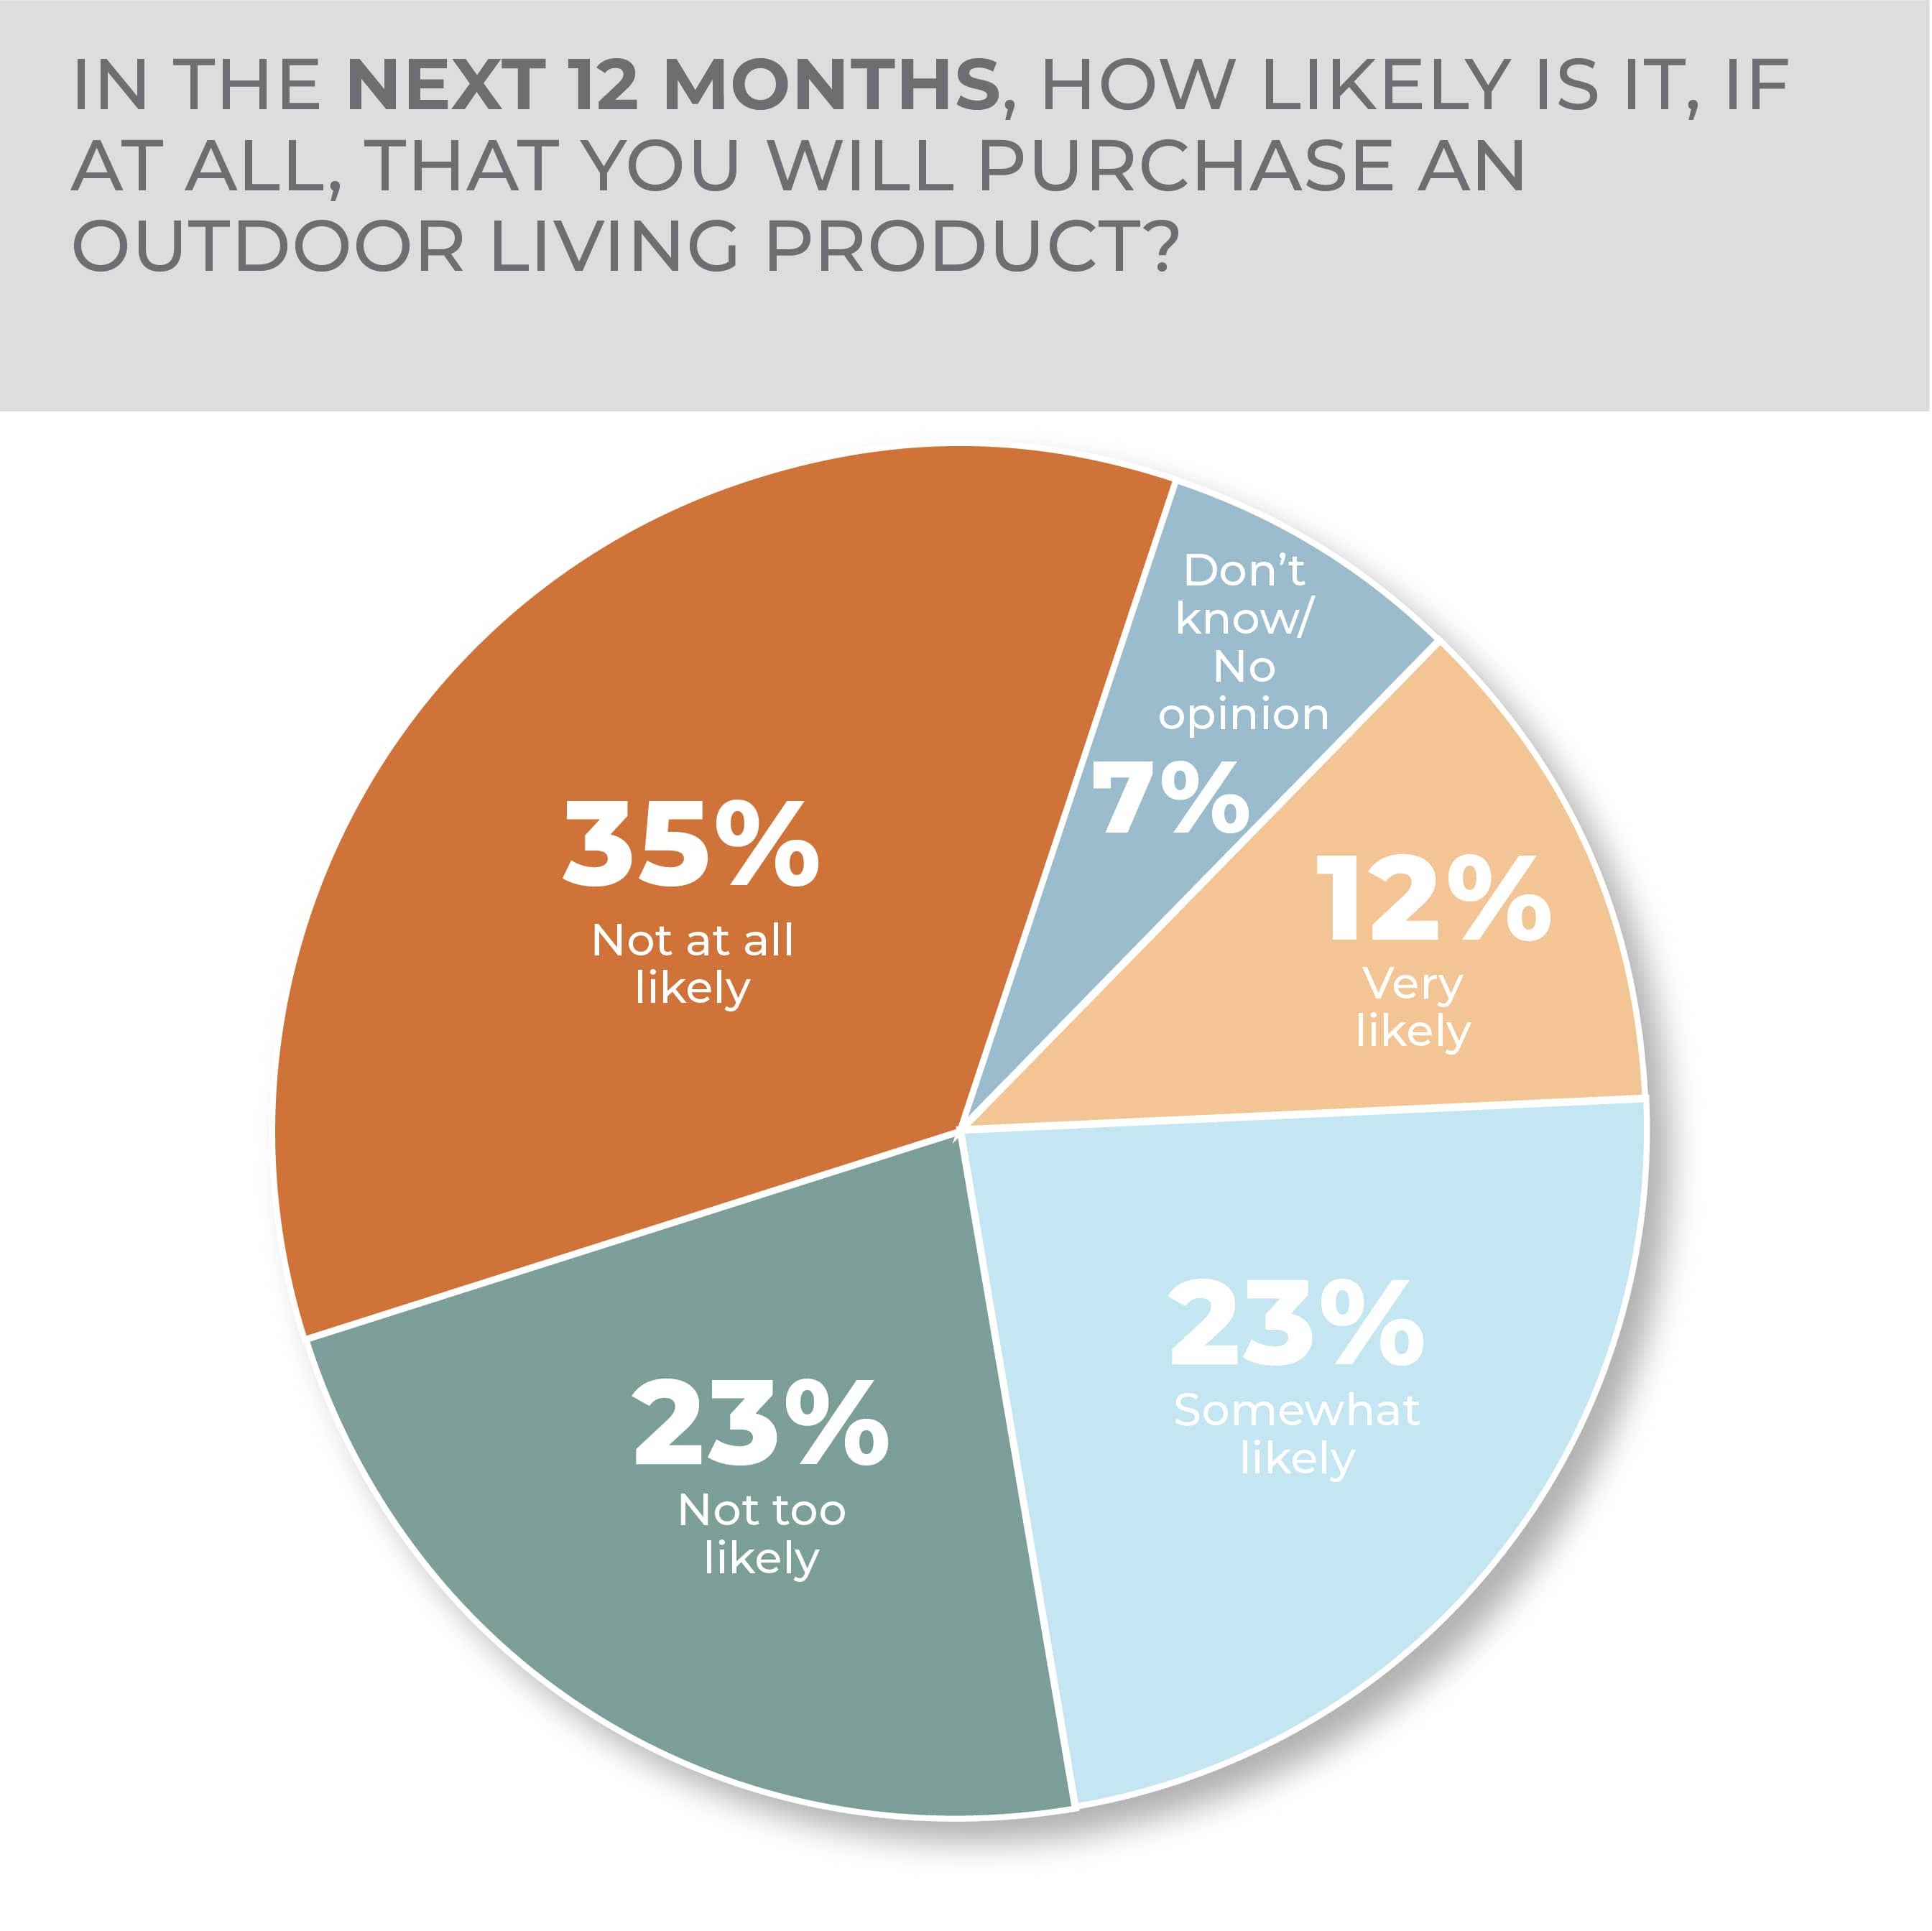
Outdoor living will be a purchasing consideration over the next several months for more than a third of consumers according to the HomePage News 2023 Consumer Outlook Survey, with 12% very likely and 23% somewhat likely to purchase, down just a bit from the 15% very likely and 23% somewhat likely to purchase the year before.
-
- Purchase intention for grills is higher than for any other outdoor living product category.
- Men are substantially more likely than women to purchase outdoor living items in the year ahead.
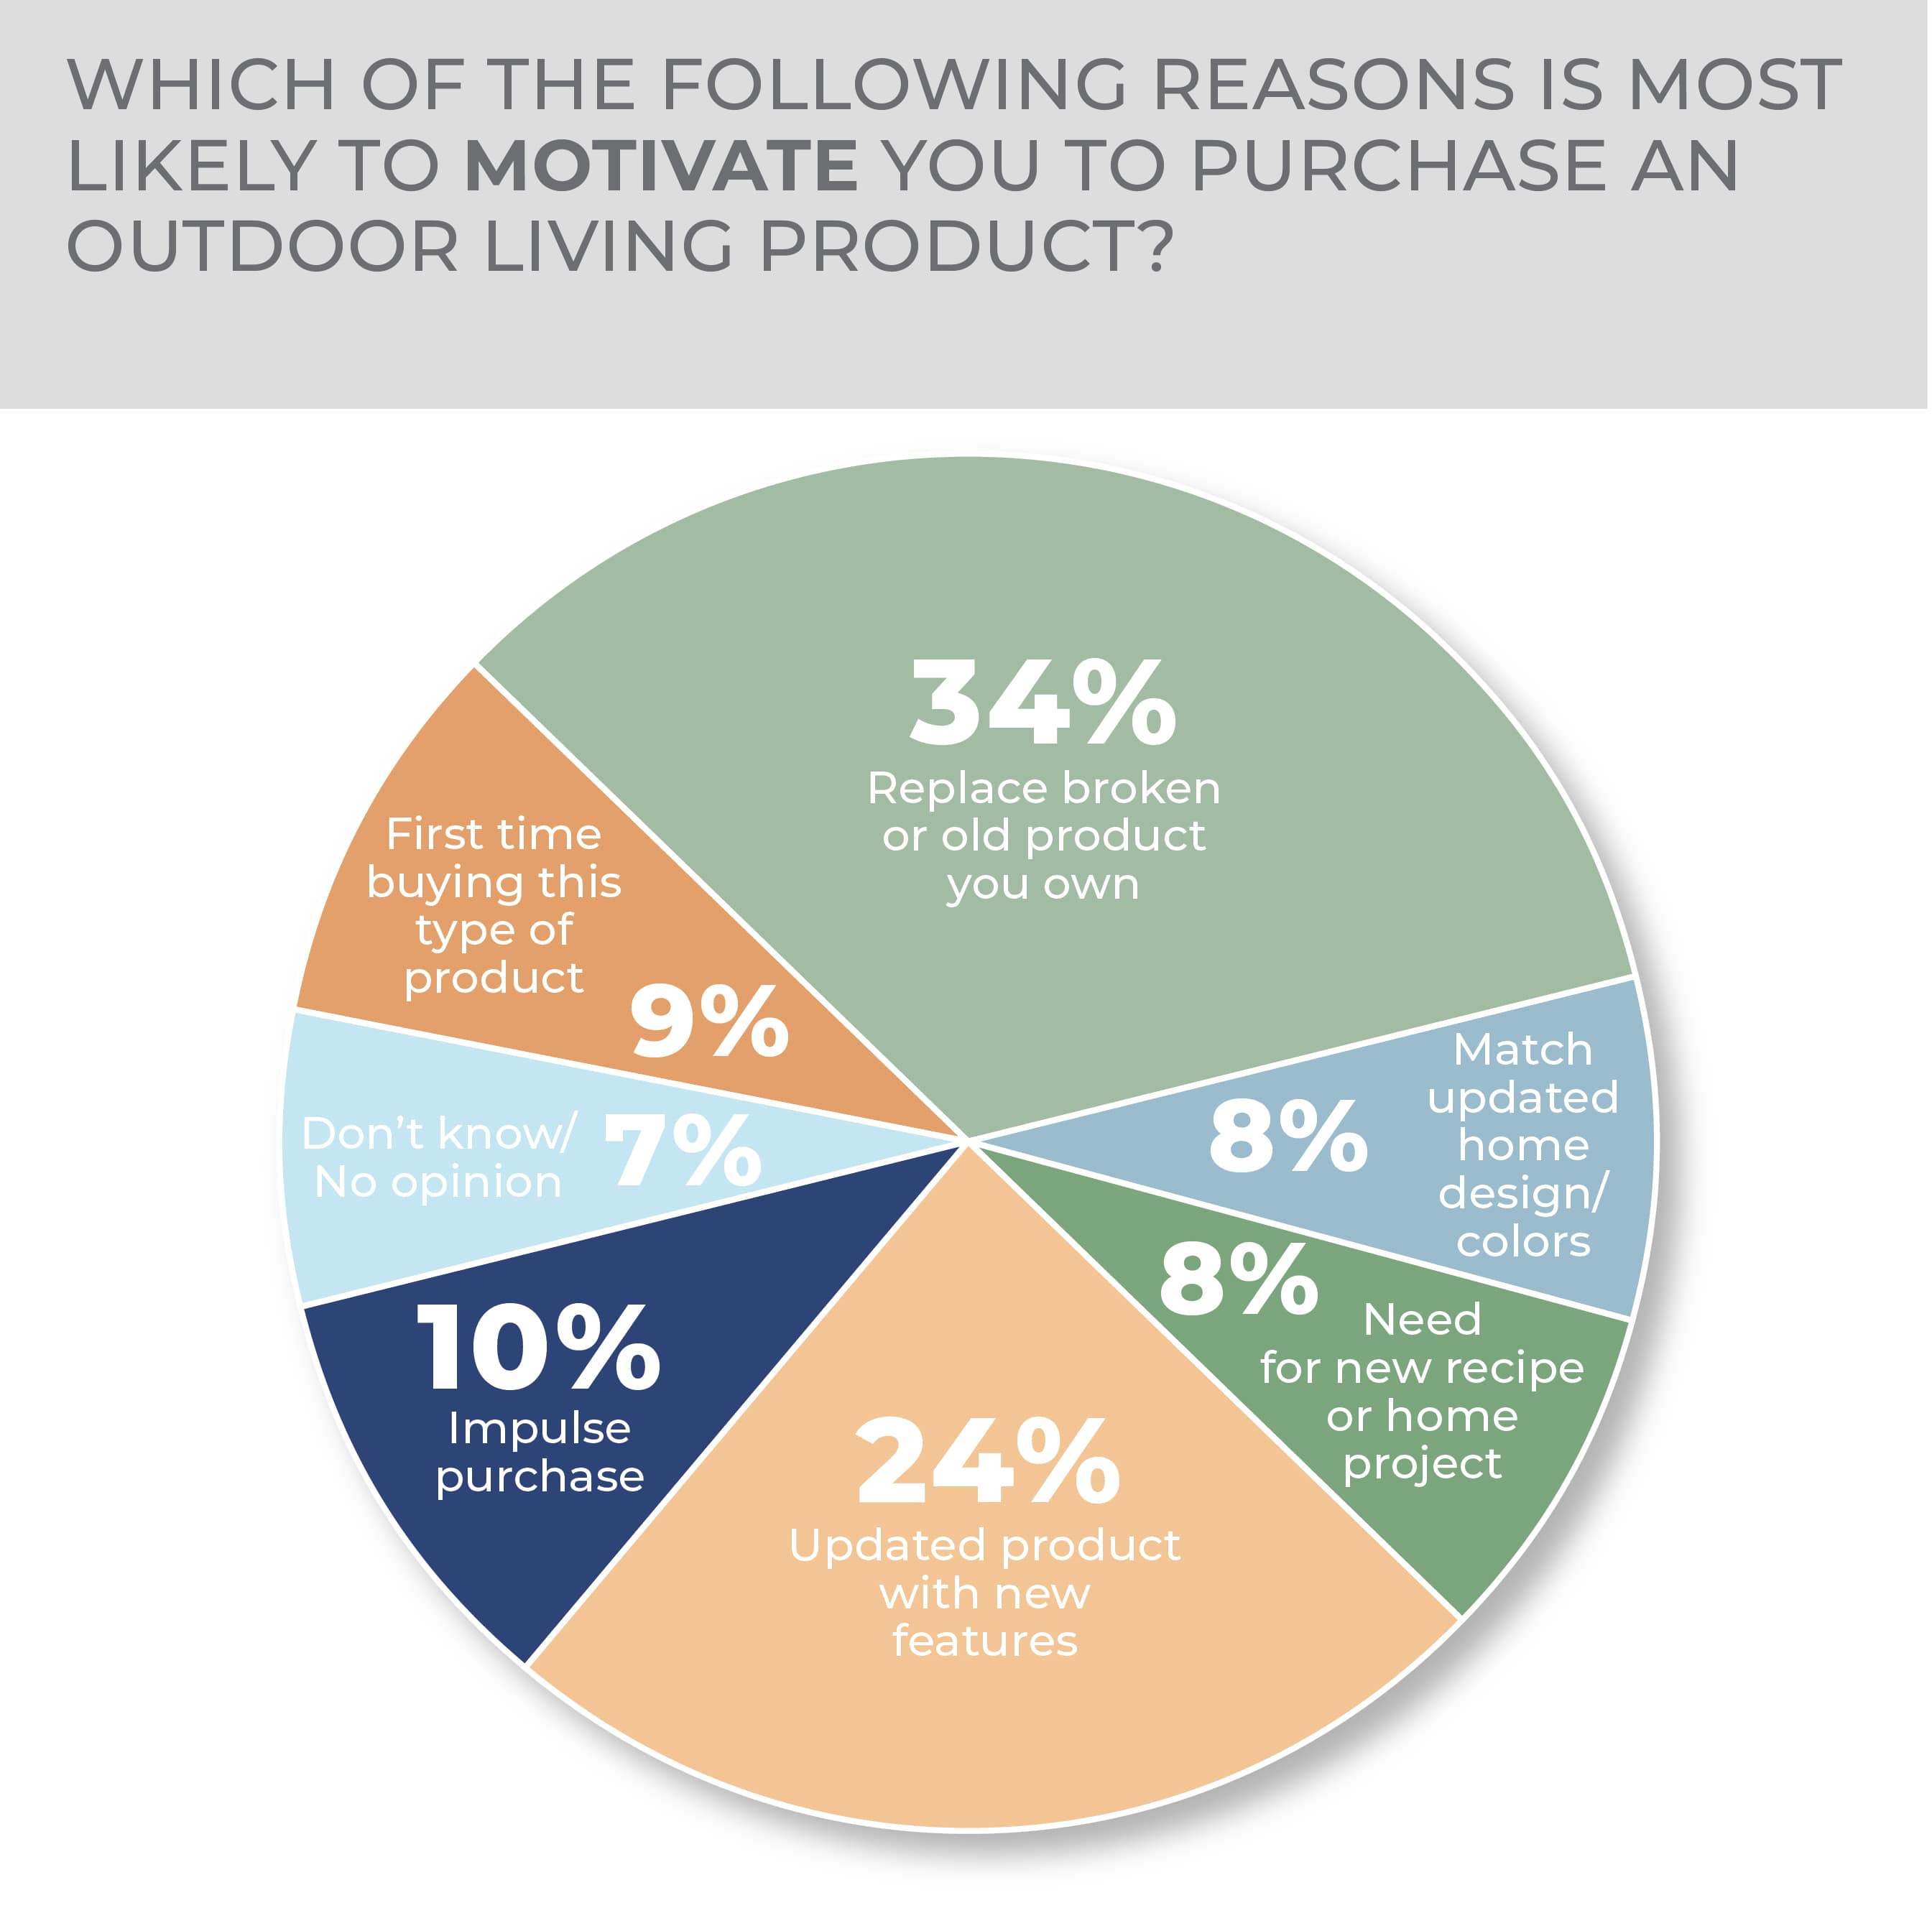
Almost a quarter of consumers responding to this year’s survey said an updated product with new features would most likely prompt an outdoor living purchase while 10% said an impulse would most likely have them purchase in the category. Those were the second and third most likely reasons after replacing a broken or old product, at 34%. In the Outlook survey a year ago, the top three reasons to buy were: replace a broken or old product at 32%, purchase an updated product with new features at 22% and buying for the first time at 13%. The switch in the responses suggests that consumers who had bought into the category are prepared to purchase again.
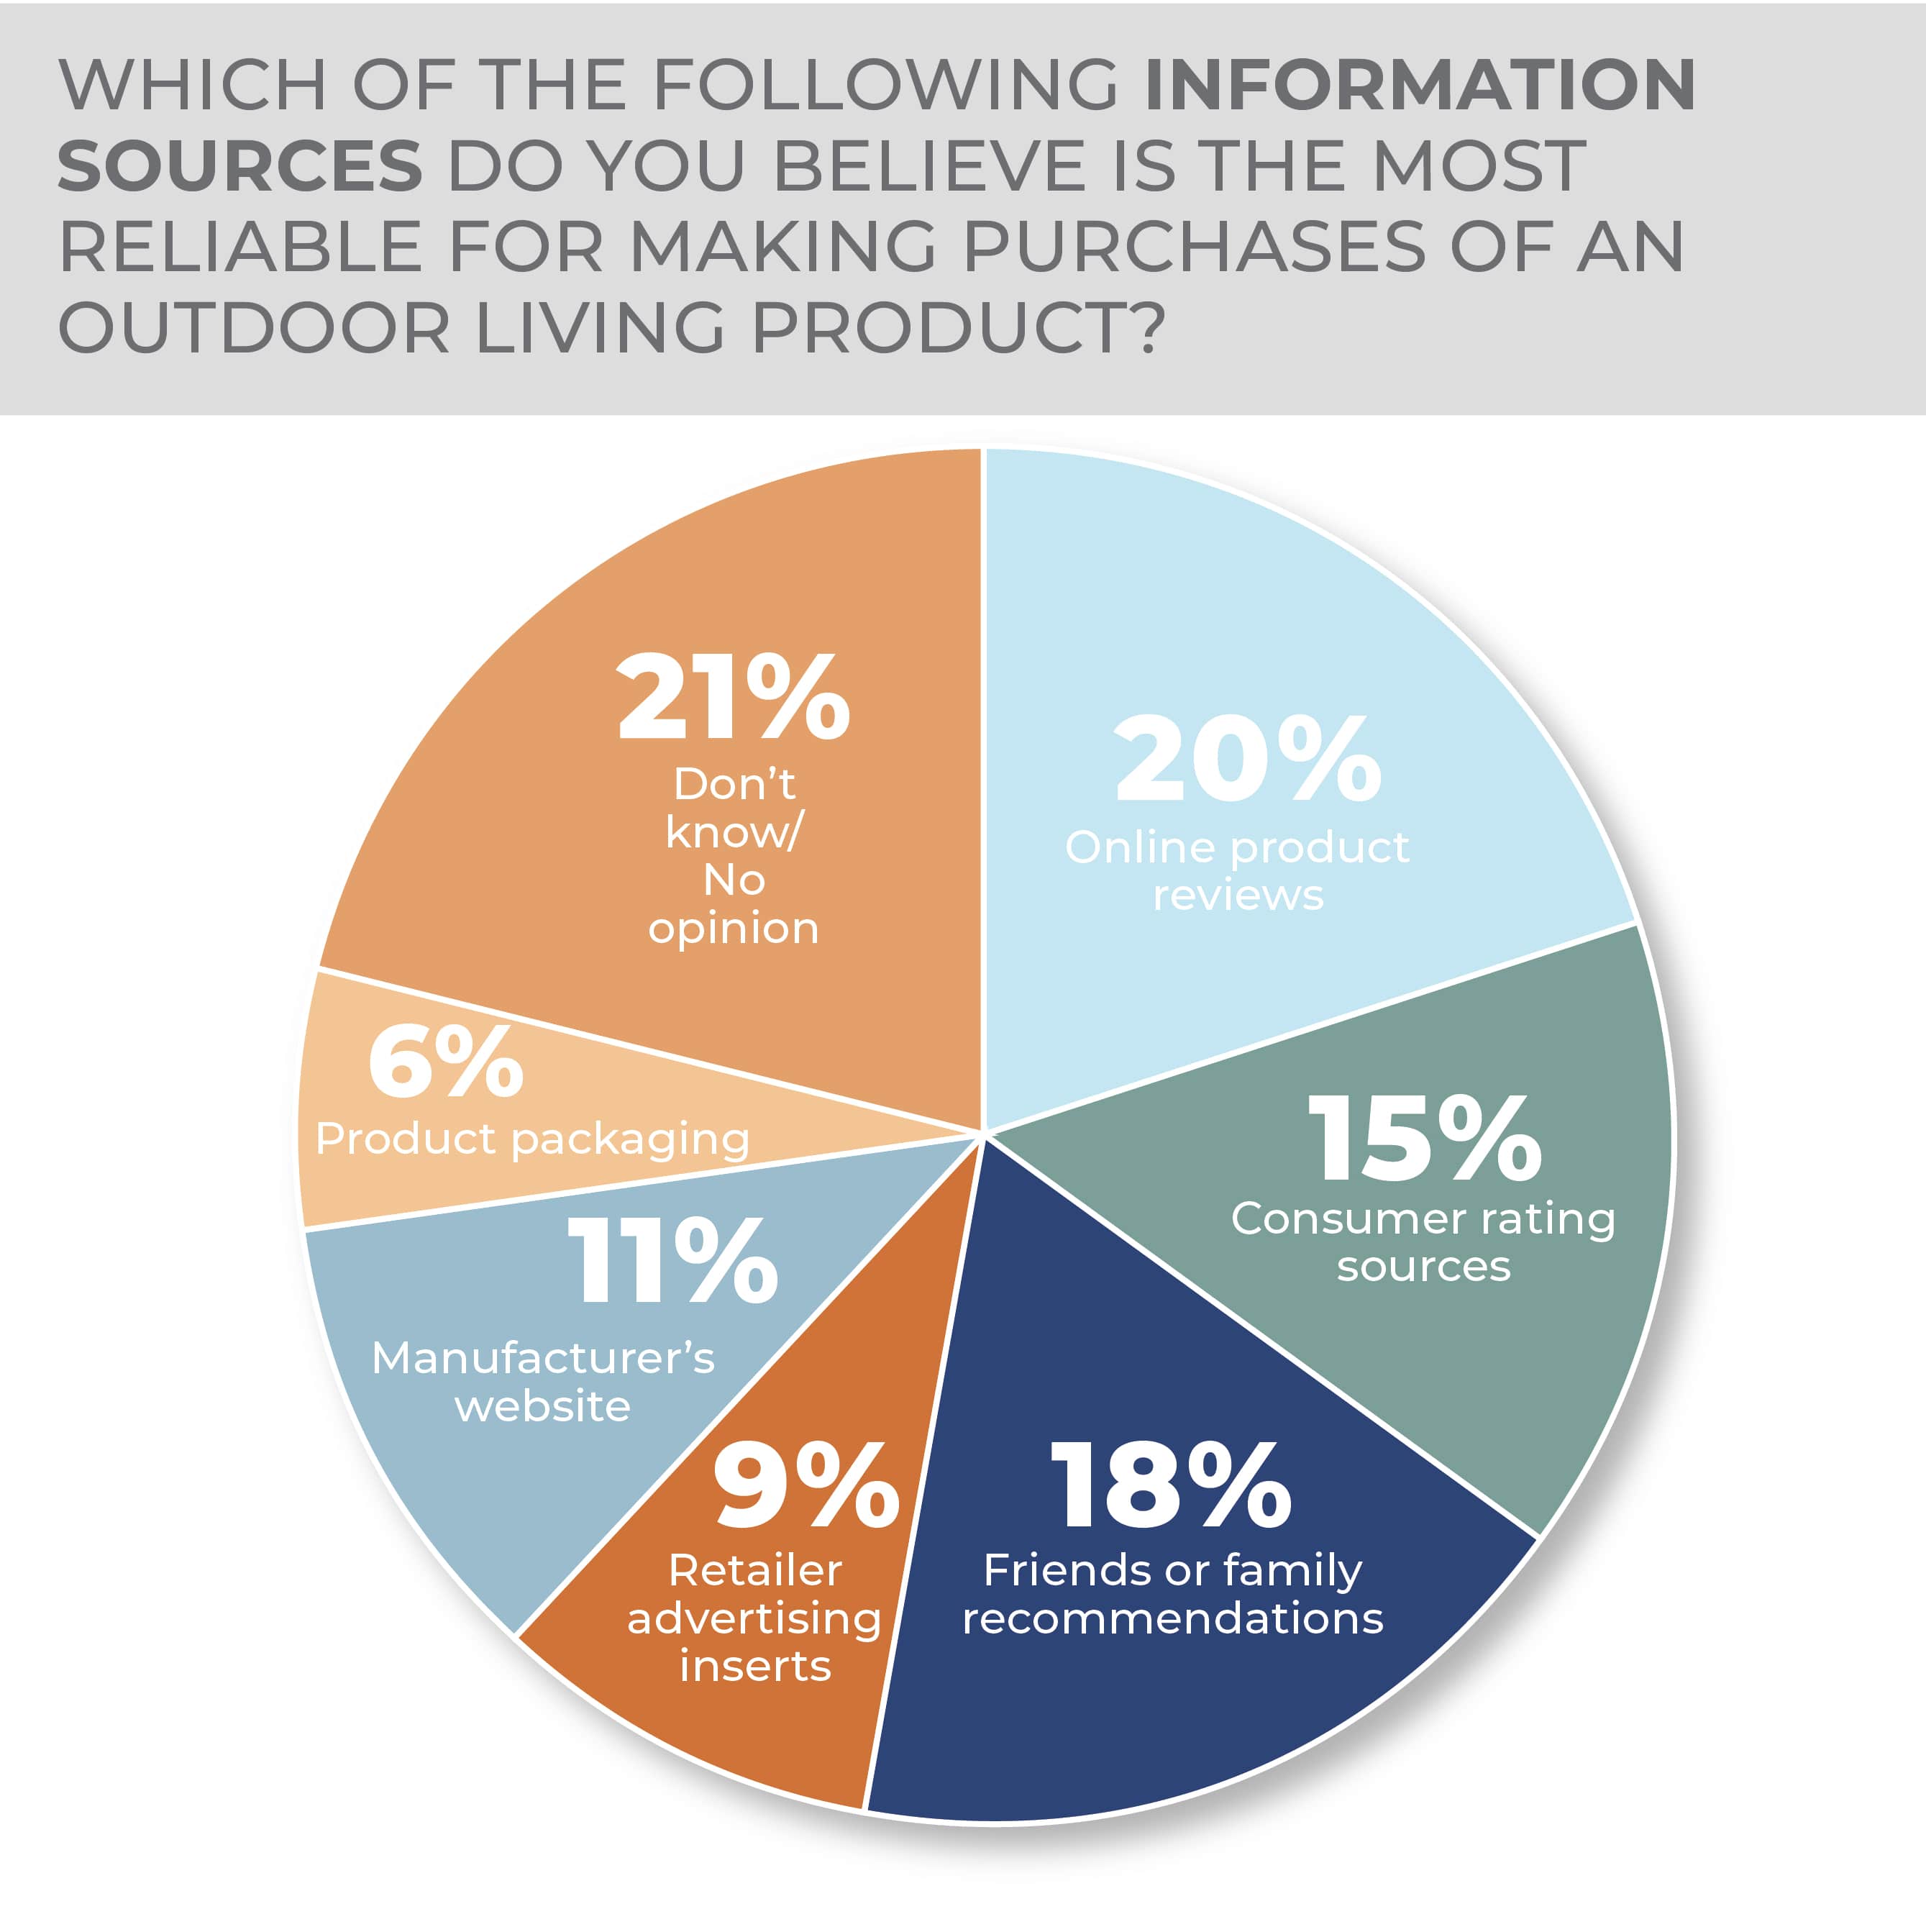
Online product reviews, at 20%, friends and family recommendations, at 18%, and consumer ratings sources, at 15%, were the top sources for pre-purchase information in the outdoor living category but each slipped somewhat year over year. Manufacturer websites and product packaging, at 11% and 6%, respectively, gained slightly, and retailer advertising inserts remained almost the same.
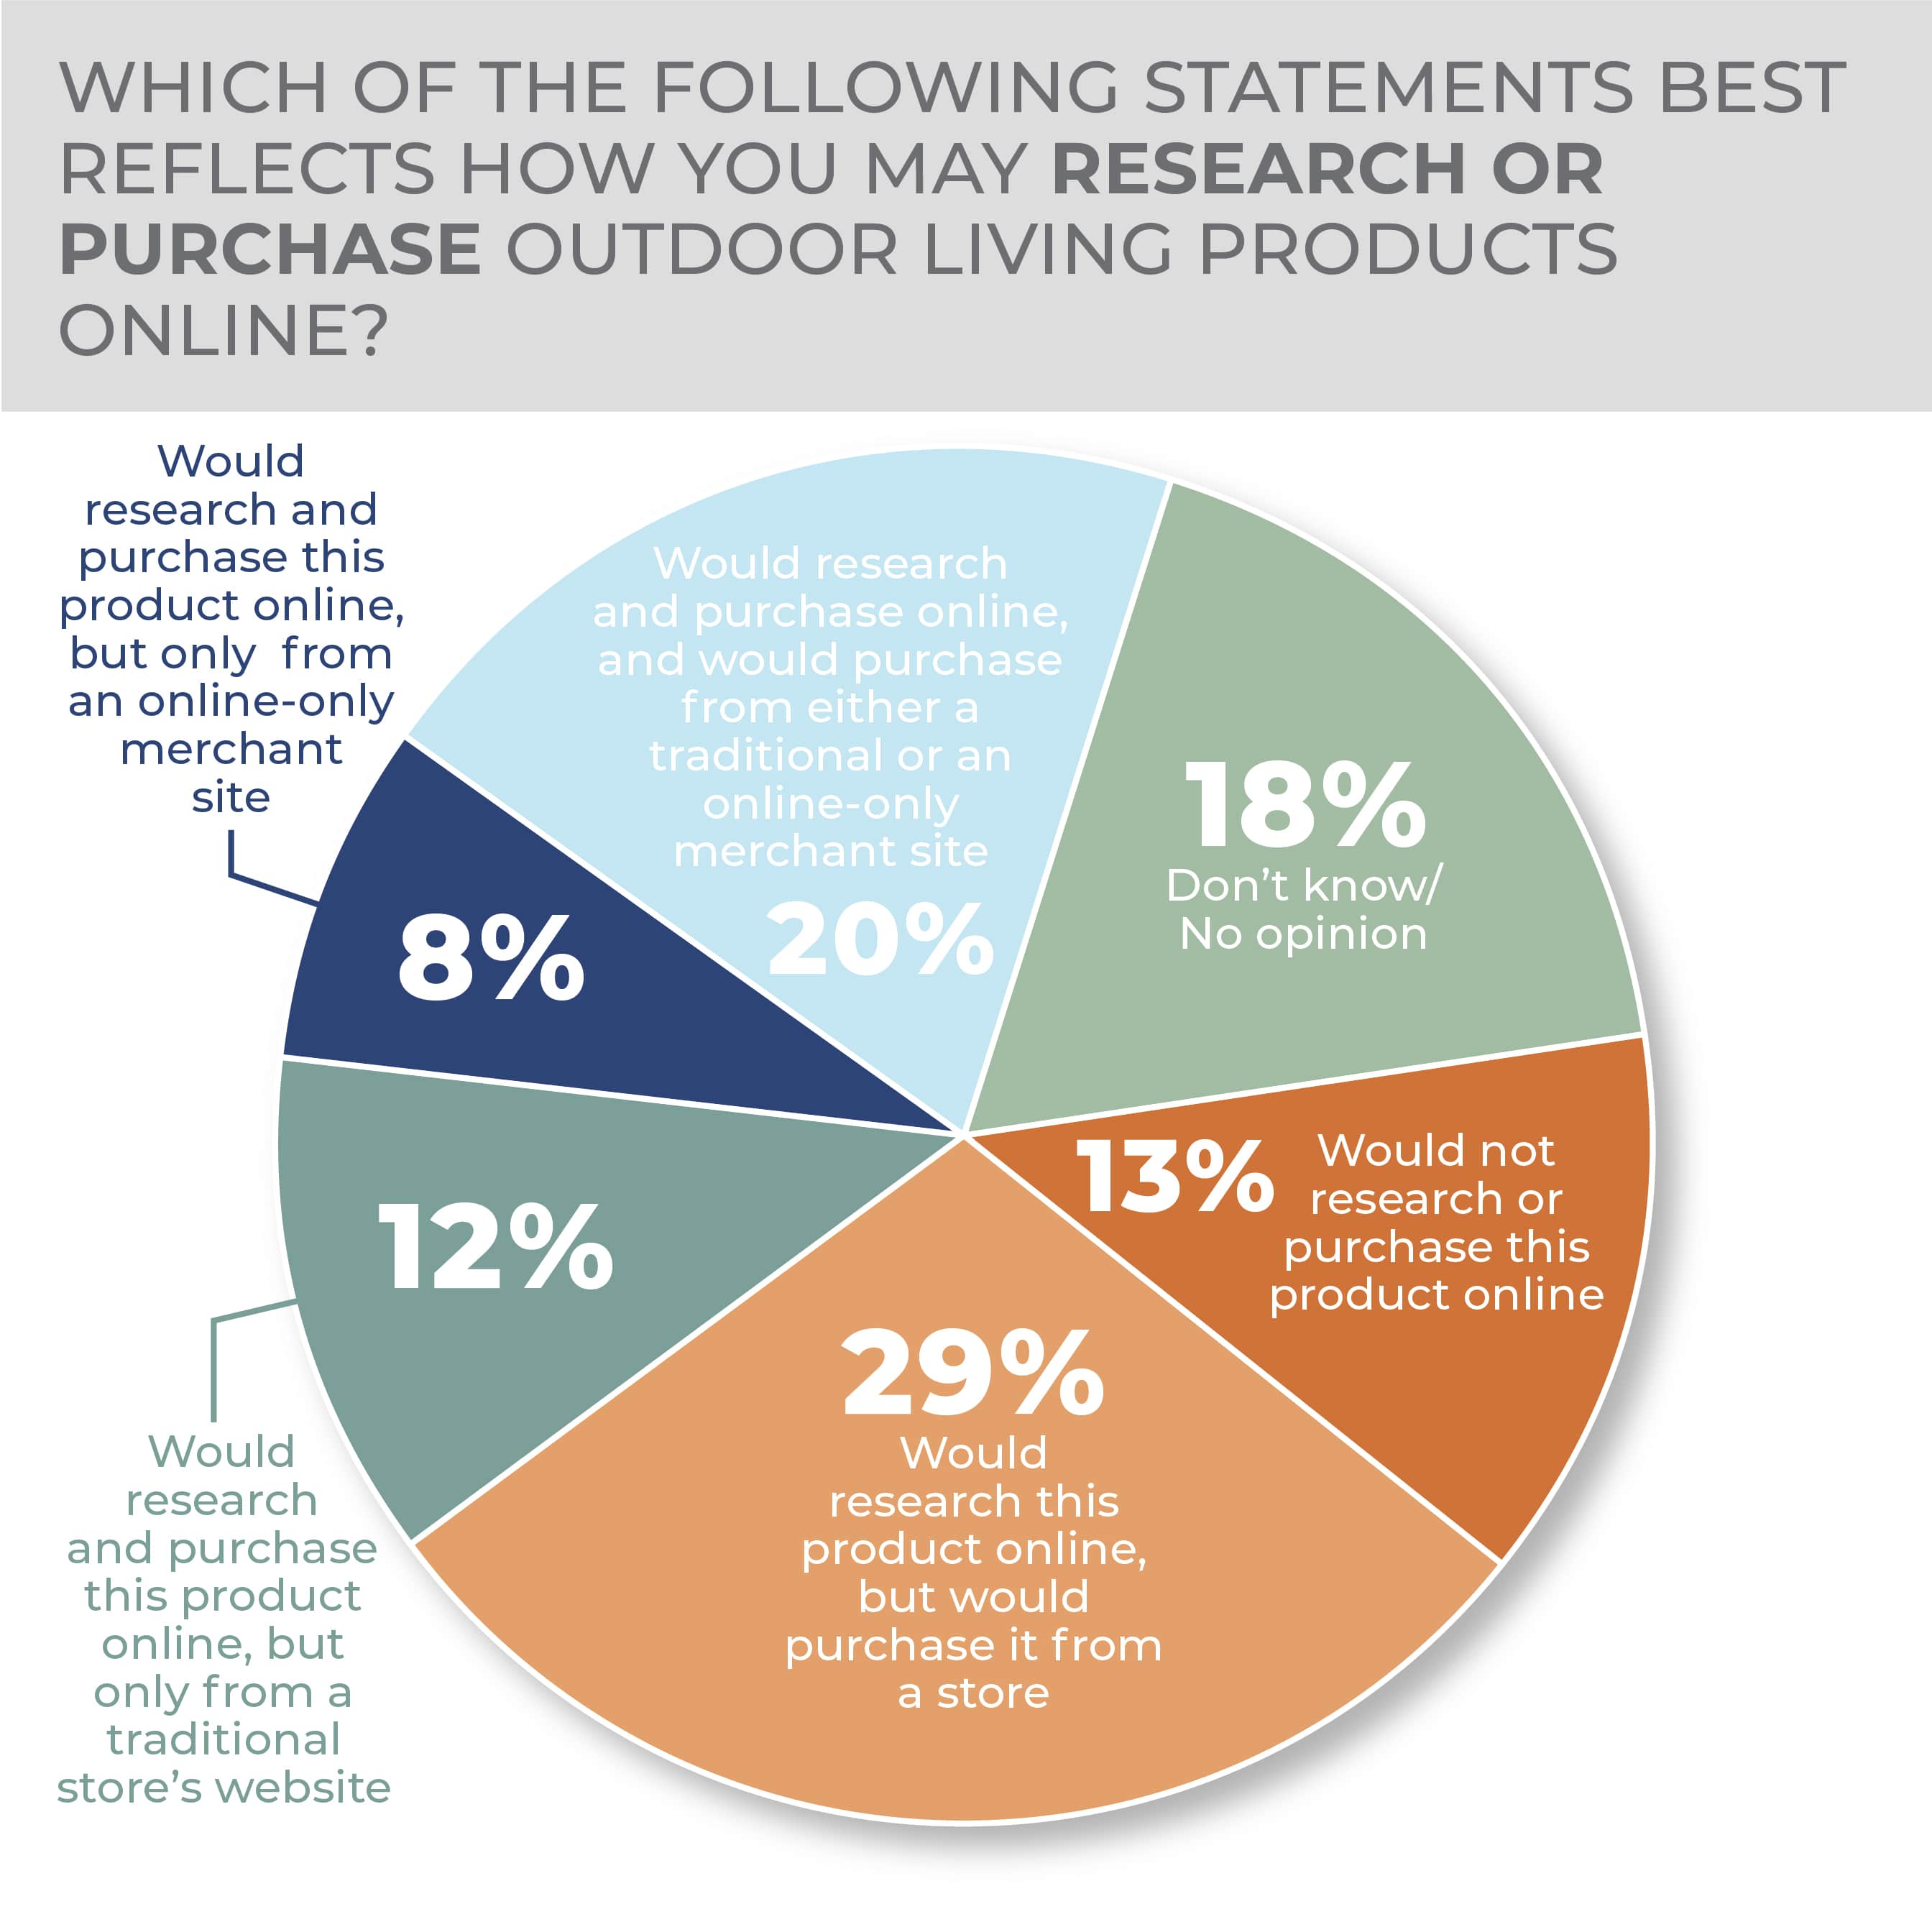
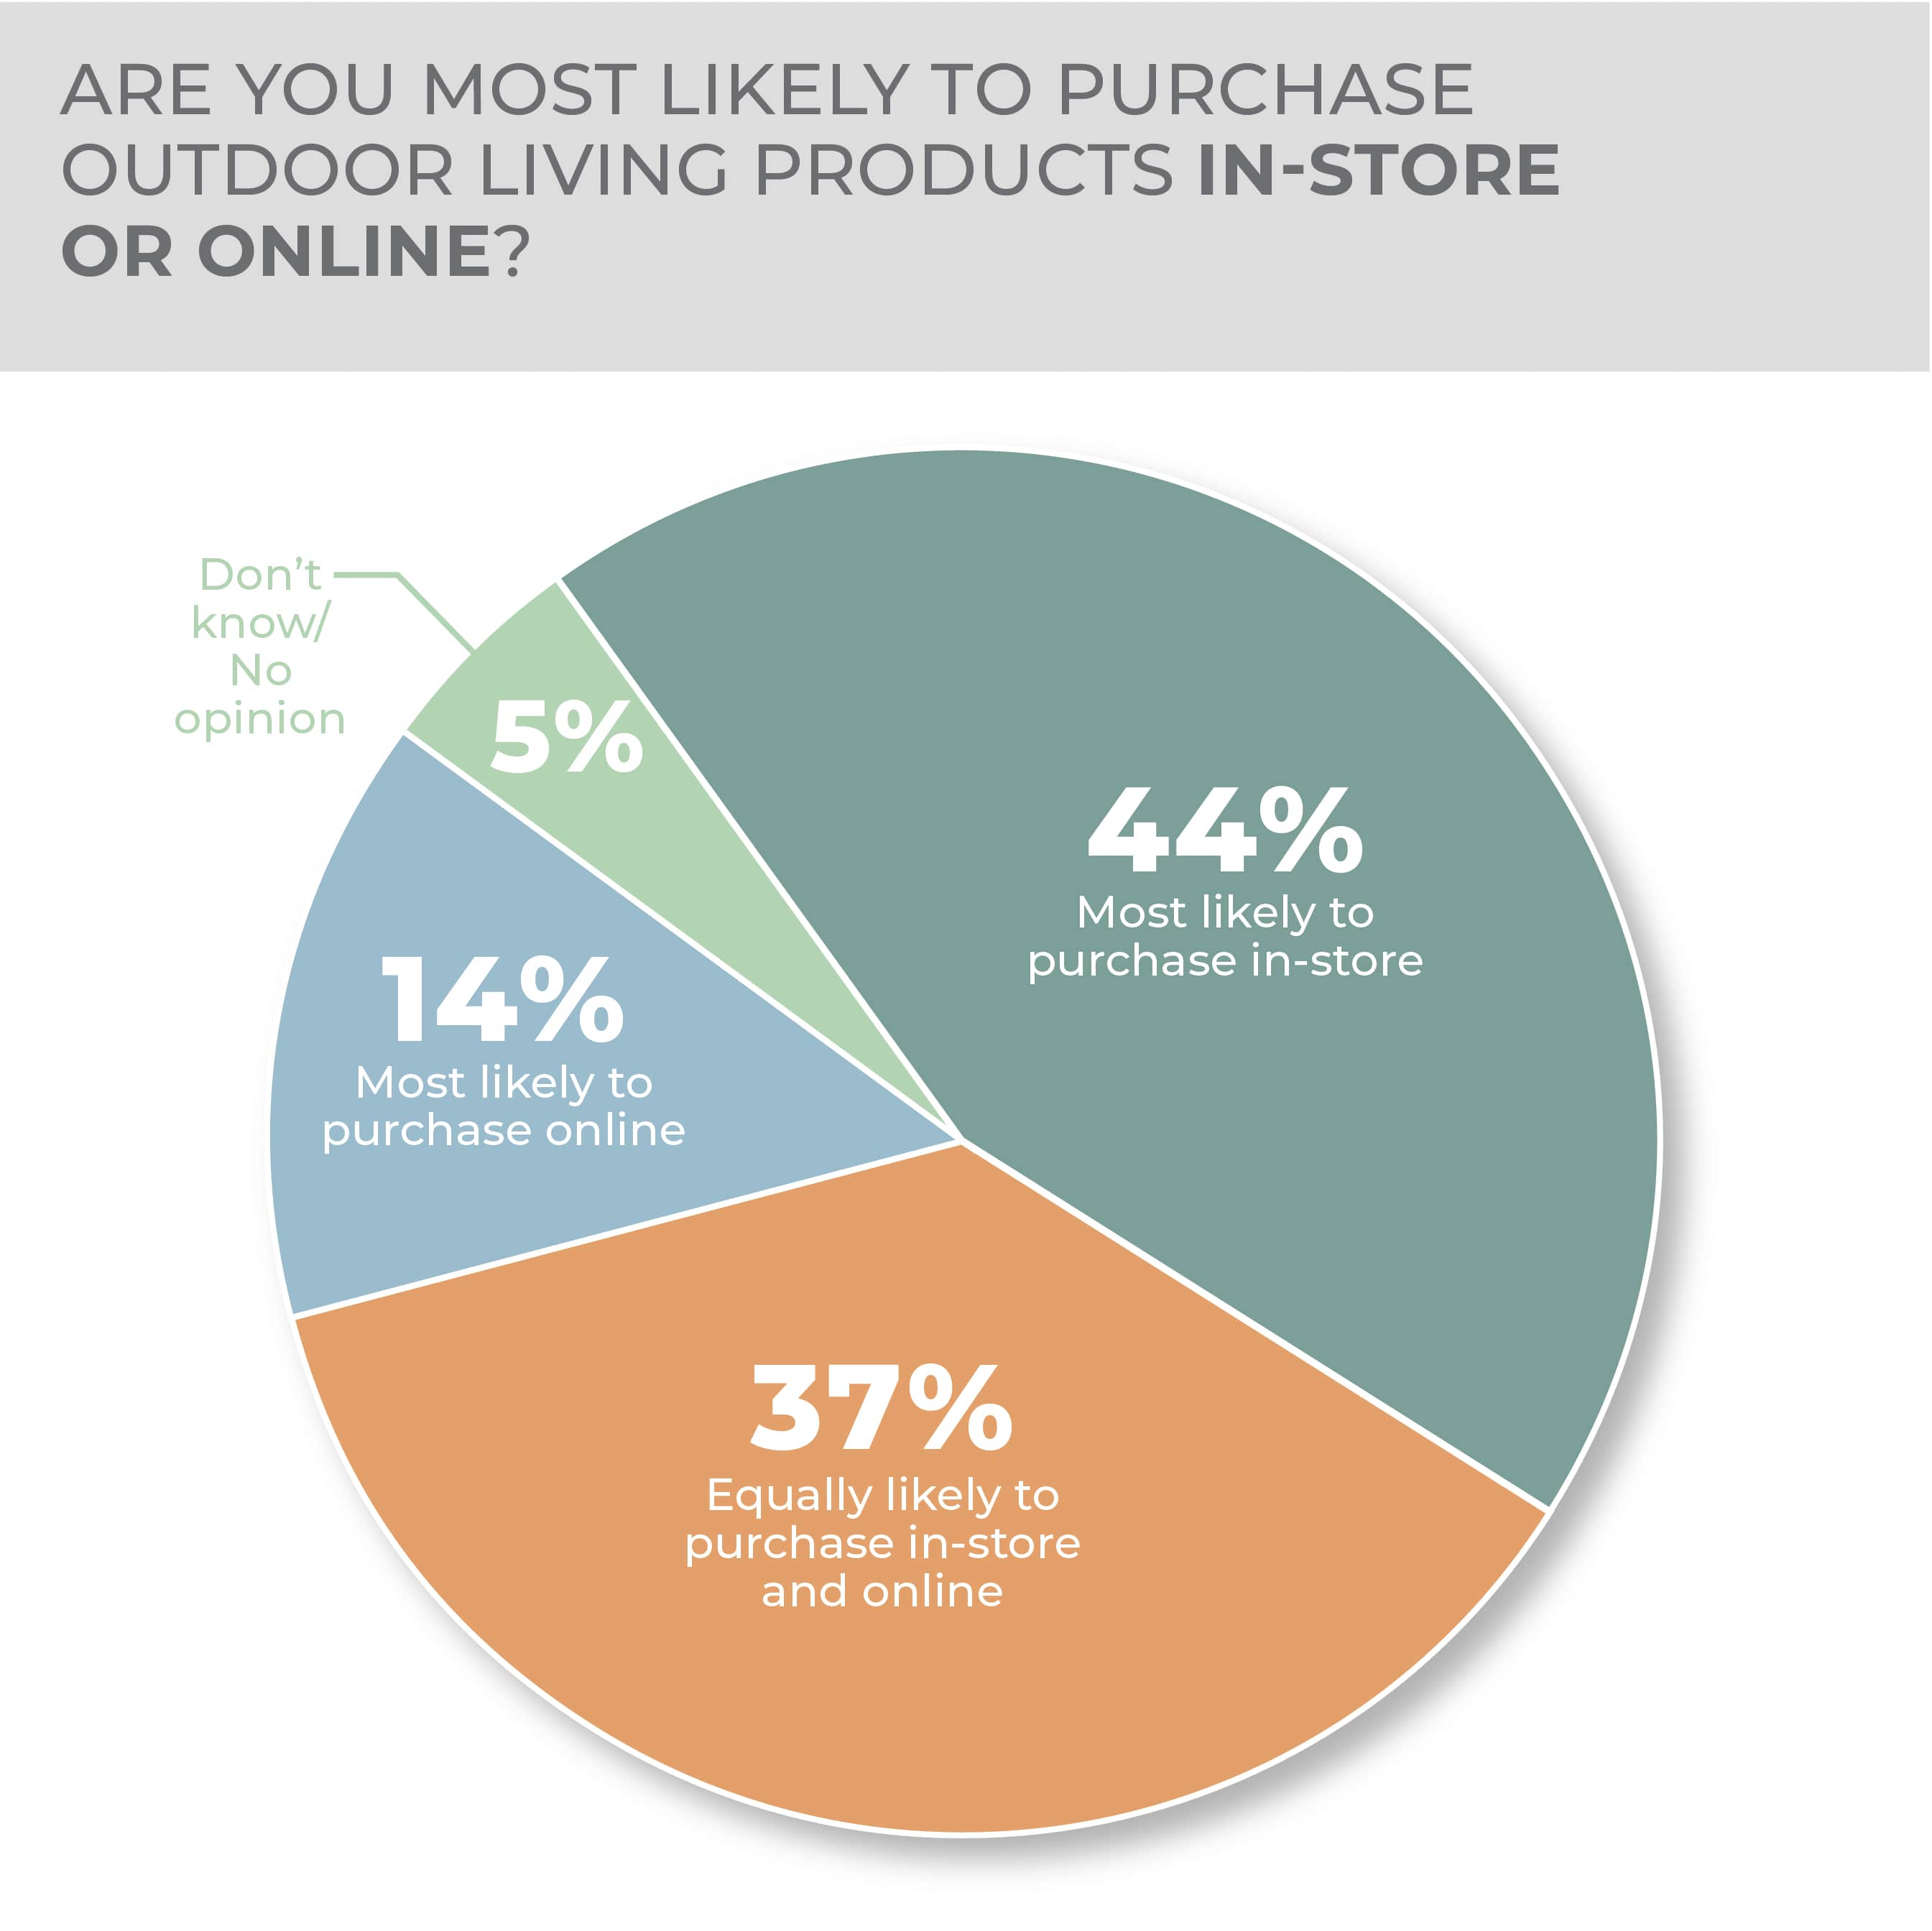
When it comes to gathering product information electronically, would research online but buy from a store led responses at 29%, followed by research online and purchase at a traditional or online-only merchant at 20%, would not research or purchase online at 13%, would research and purchase online but only from a traditional store’s website at 12% and would research online and purchase from an online-only merchant at 8%. The overall impression is that in-store has a slight edge when it comes to purchasing, but traditional retailers, both through brick-and-mortar and e-commerce operations, have a notable advantage in the outdoor living category. In answering the question directly, 44% of consumers said they would most likely purchase in-store, 37% said they were equally likely to purchase in-store or online and 14% said they would most likely purchase online.
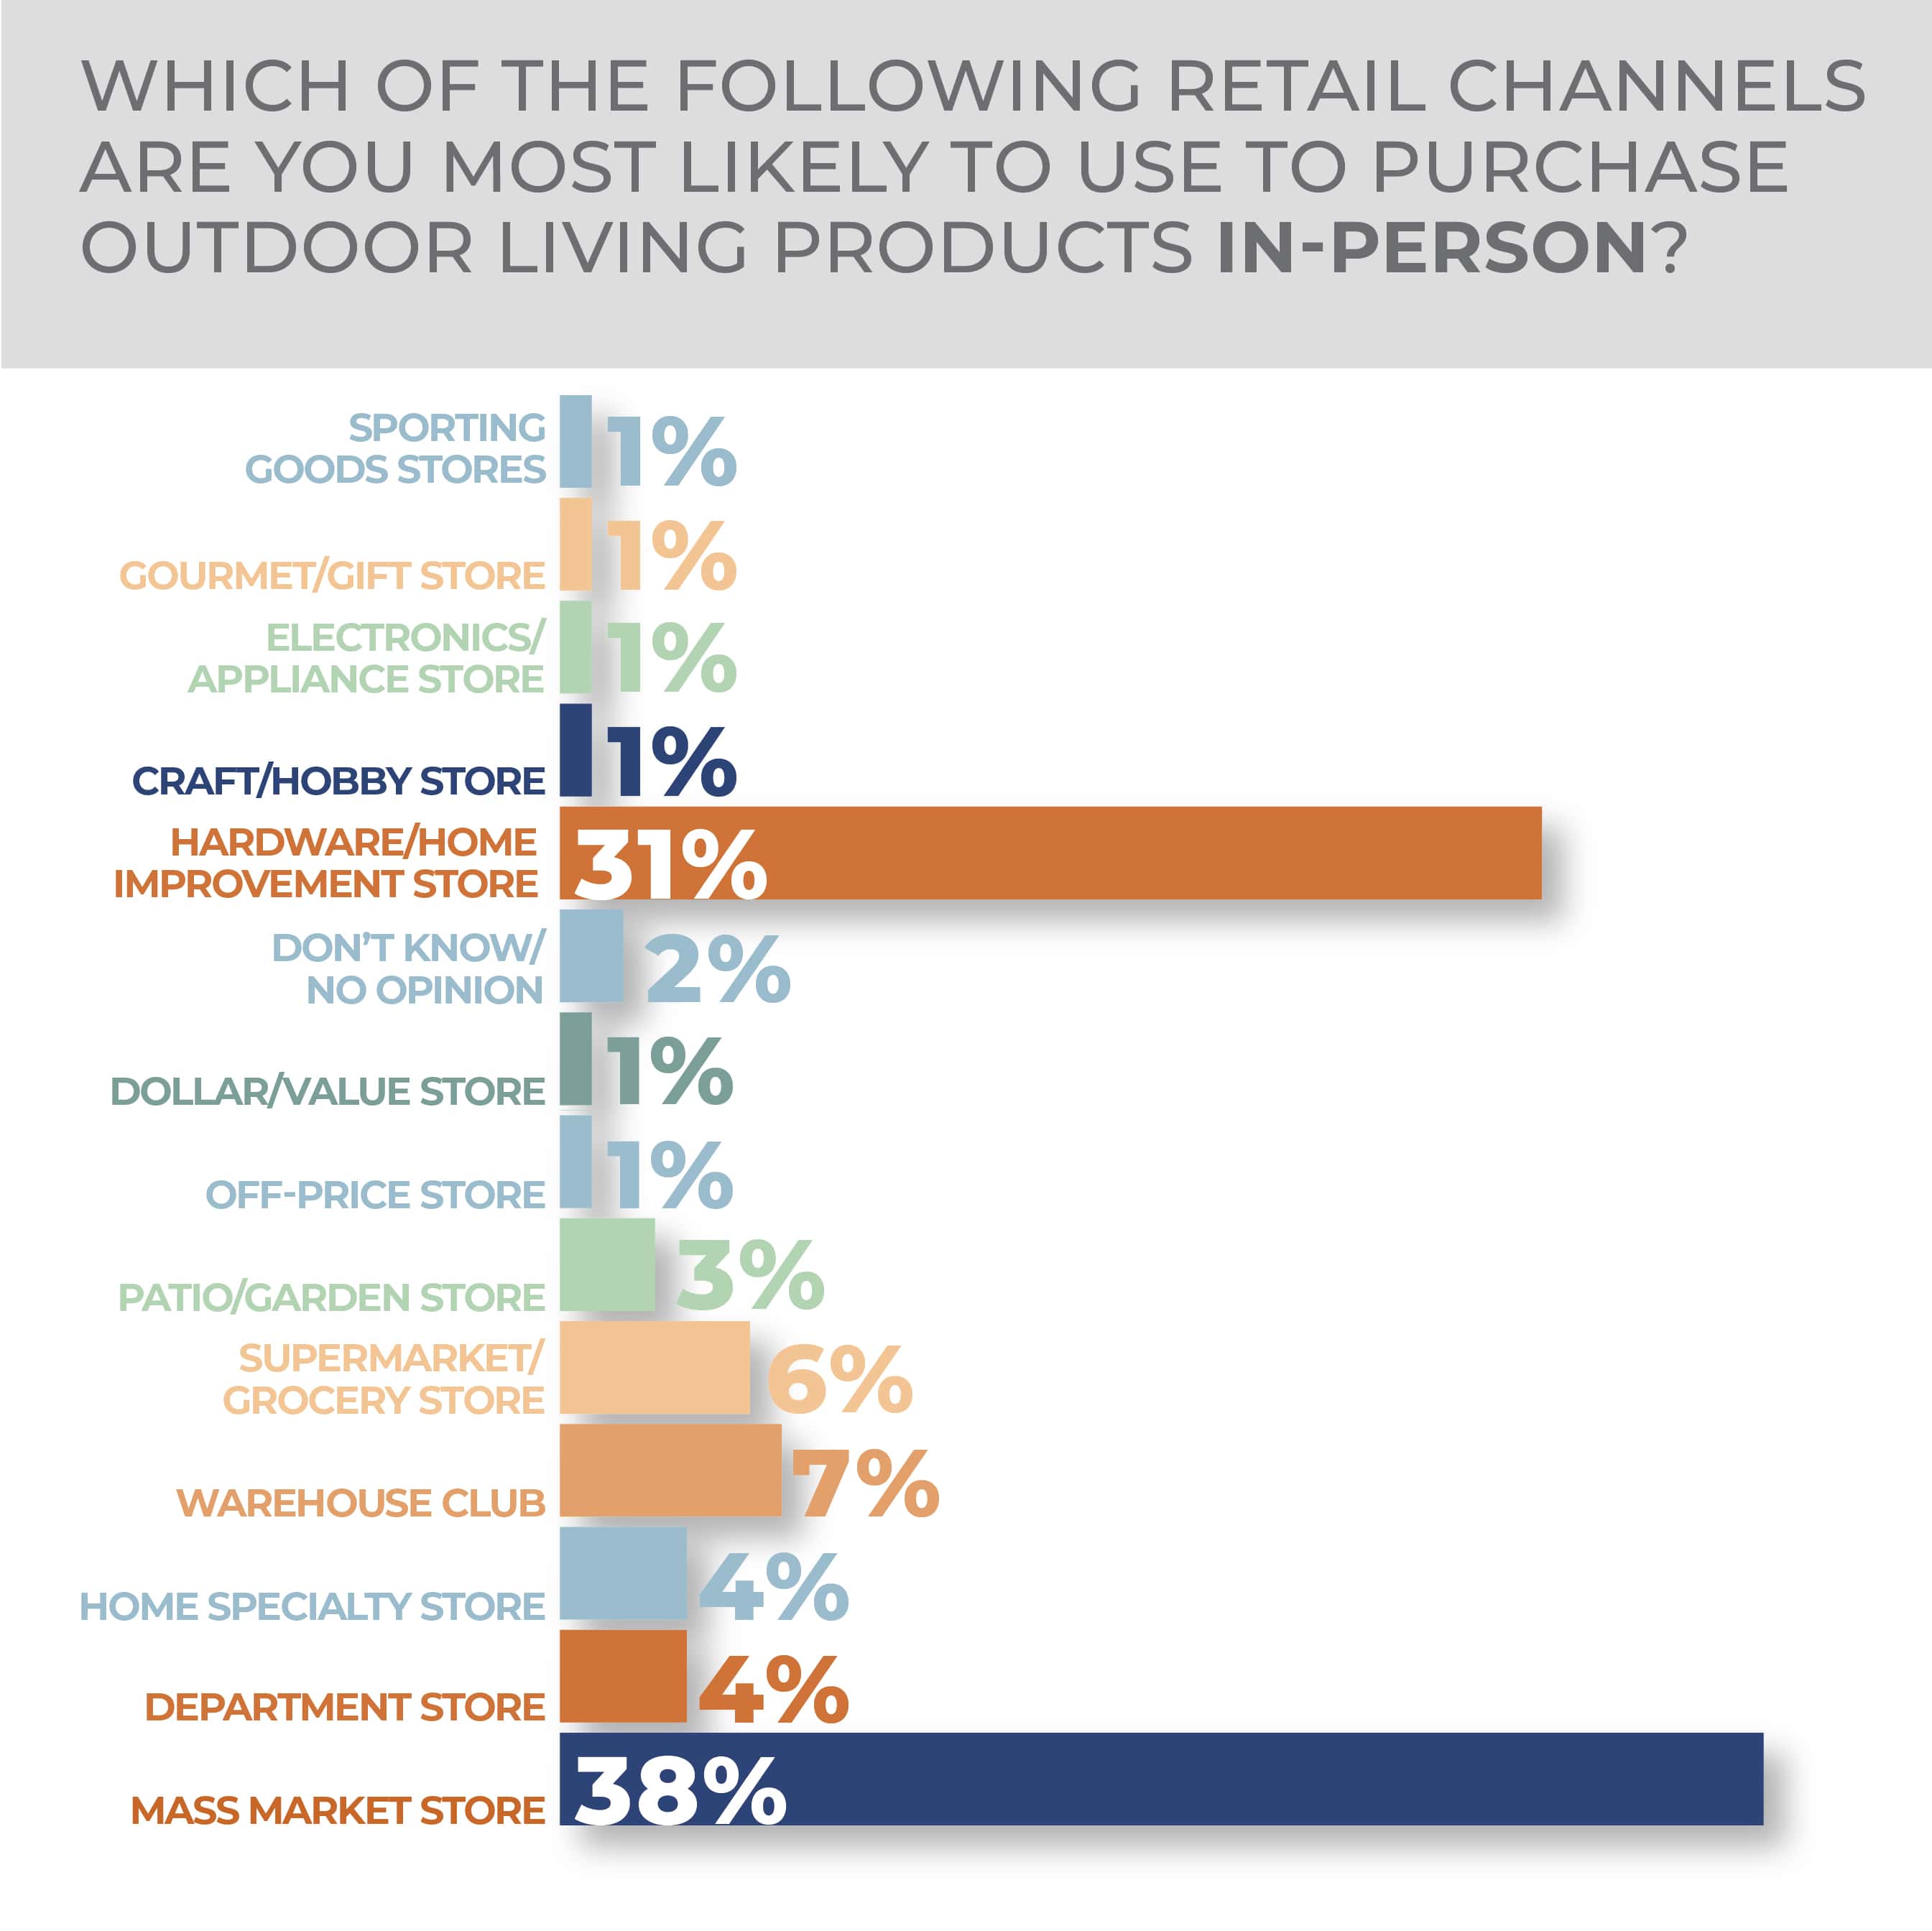
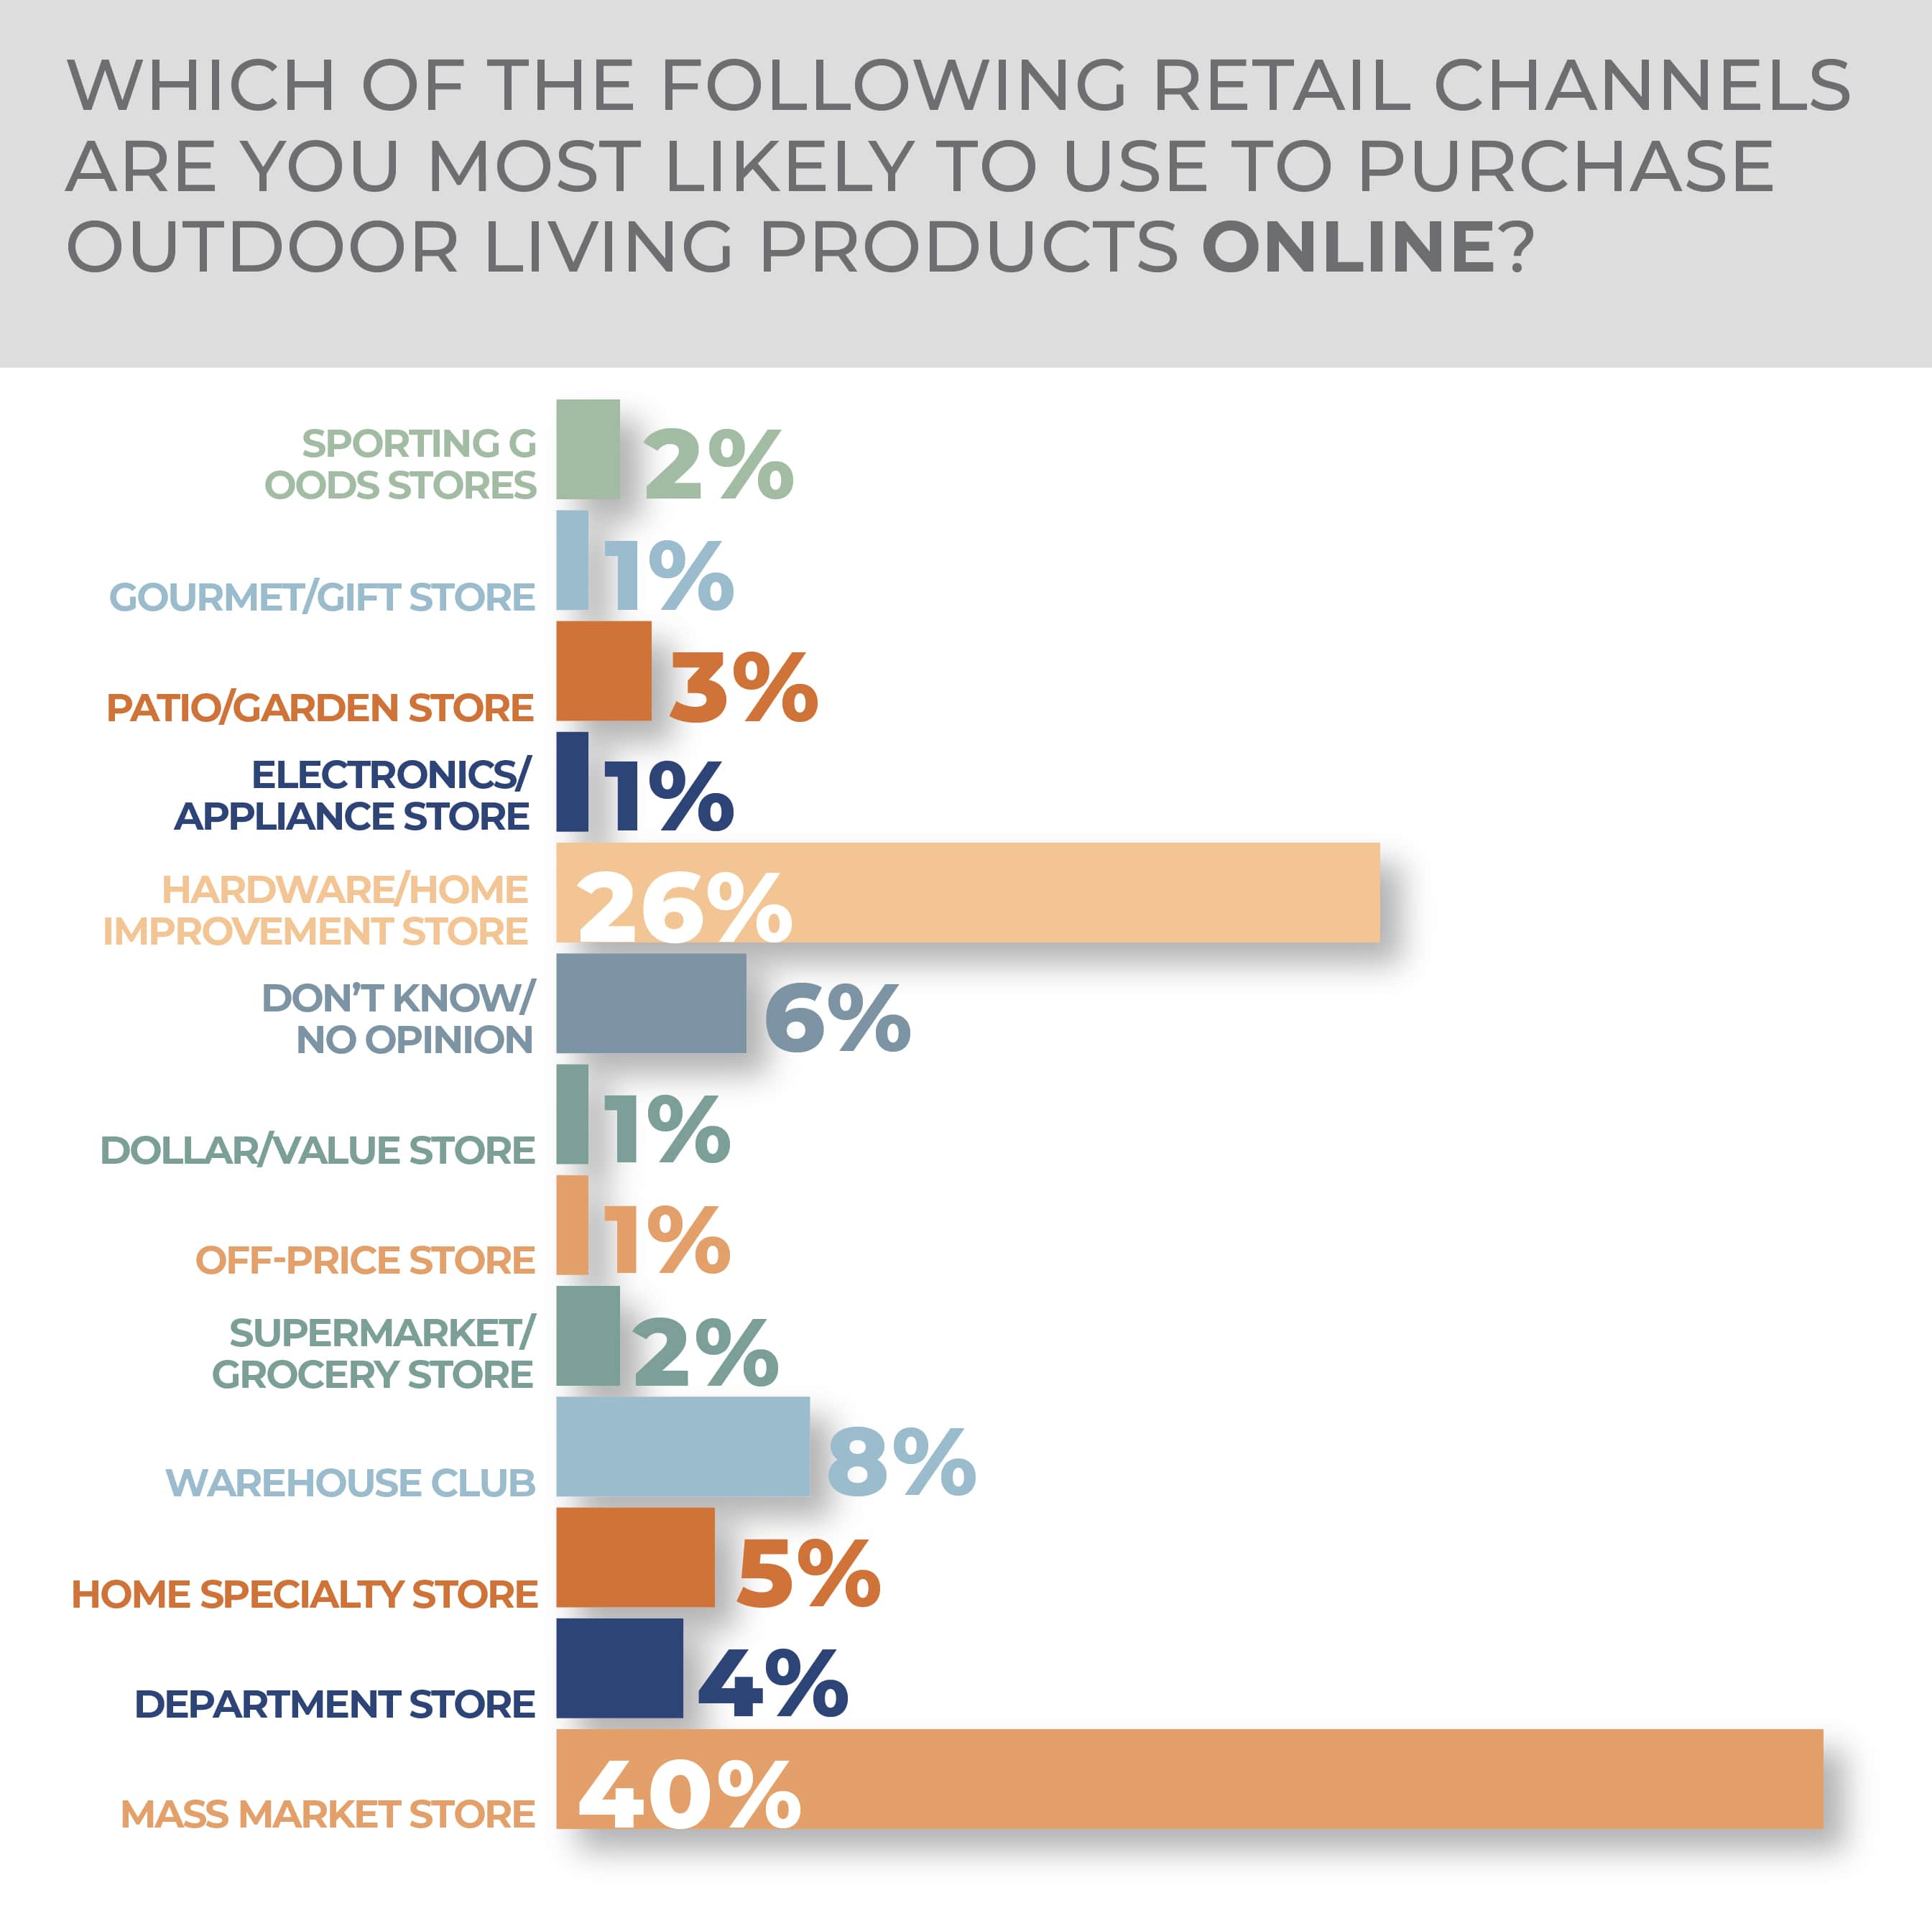
Although mass-market retailers tend to dominate home-related purchase intentions in the survey their dominance isn’t as clear-cut in the outdoor living category. Of the survey respondents, 38% said they would likely purchase from a mass merchant, but 31% said they would likely purchase at a hardware/home improvement store followed at a distance by a warehouse club, at 7%. Online, the mass merchants are a bit more dominant, at 40%, with hardware/home improvement store the next most likely purchase channel at 26%, followed, again, by warehouse clubs, this time at 8%.
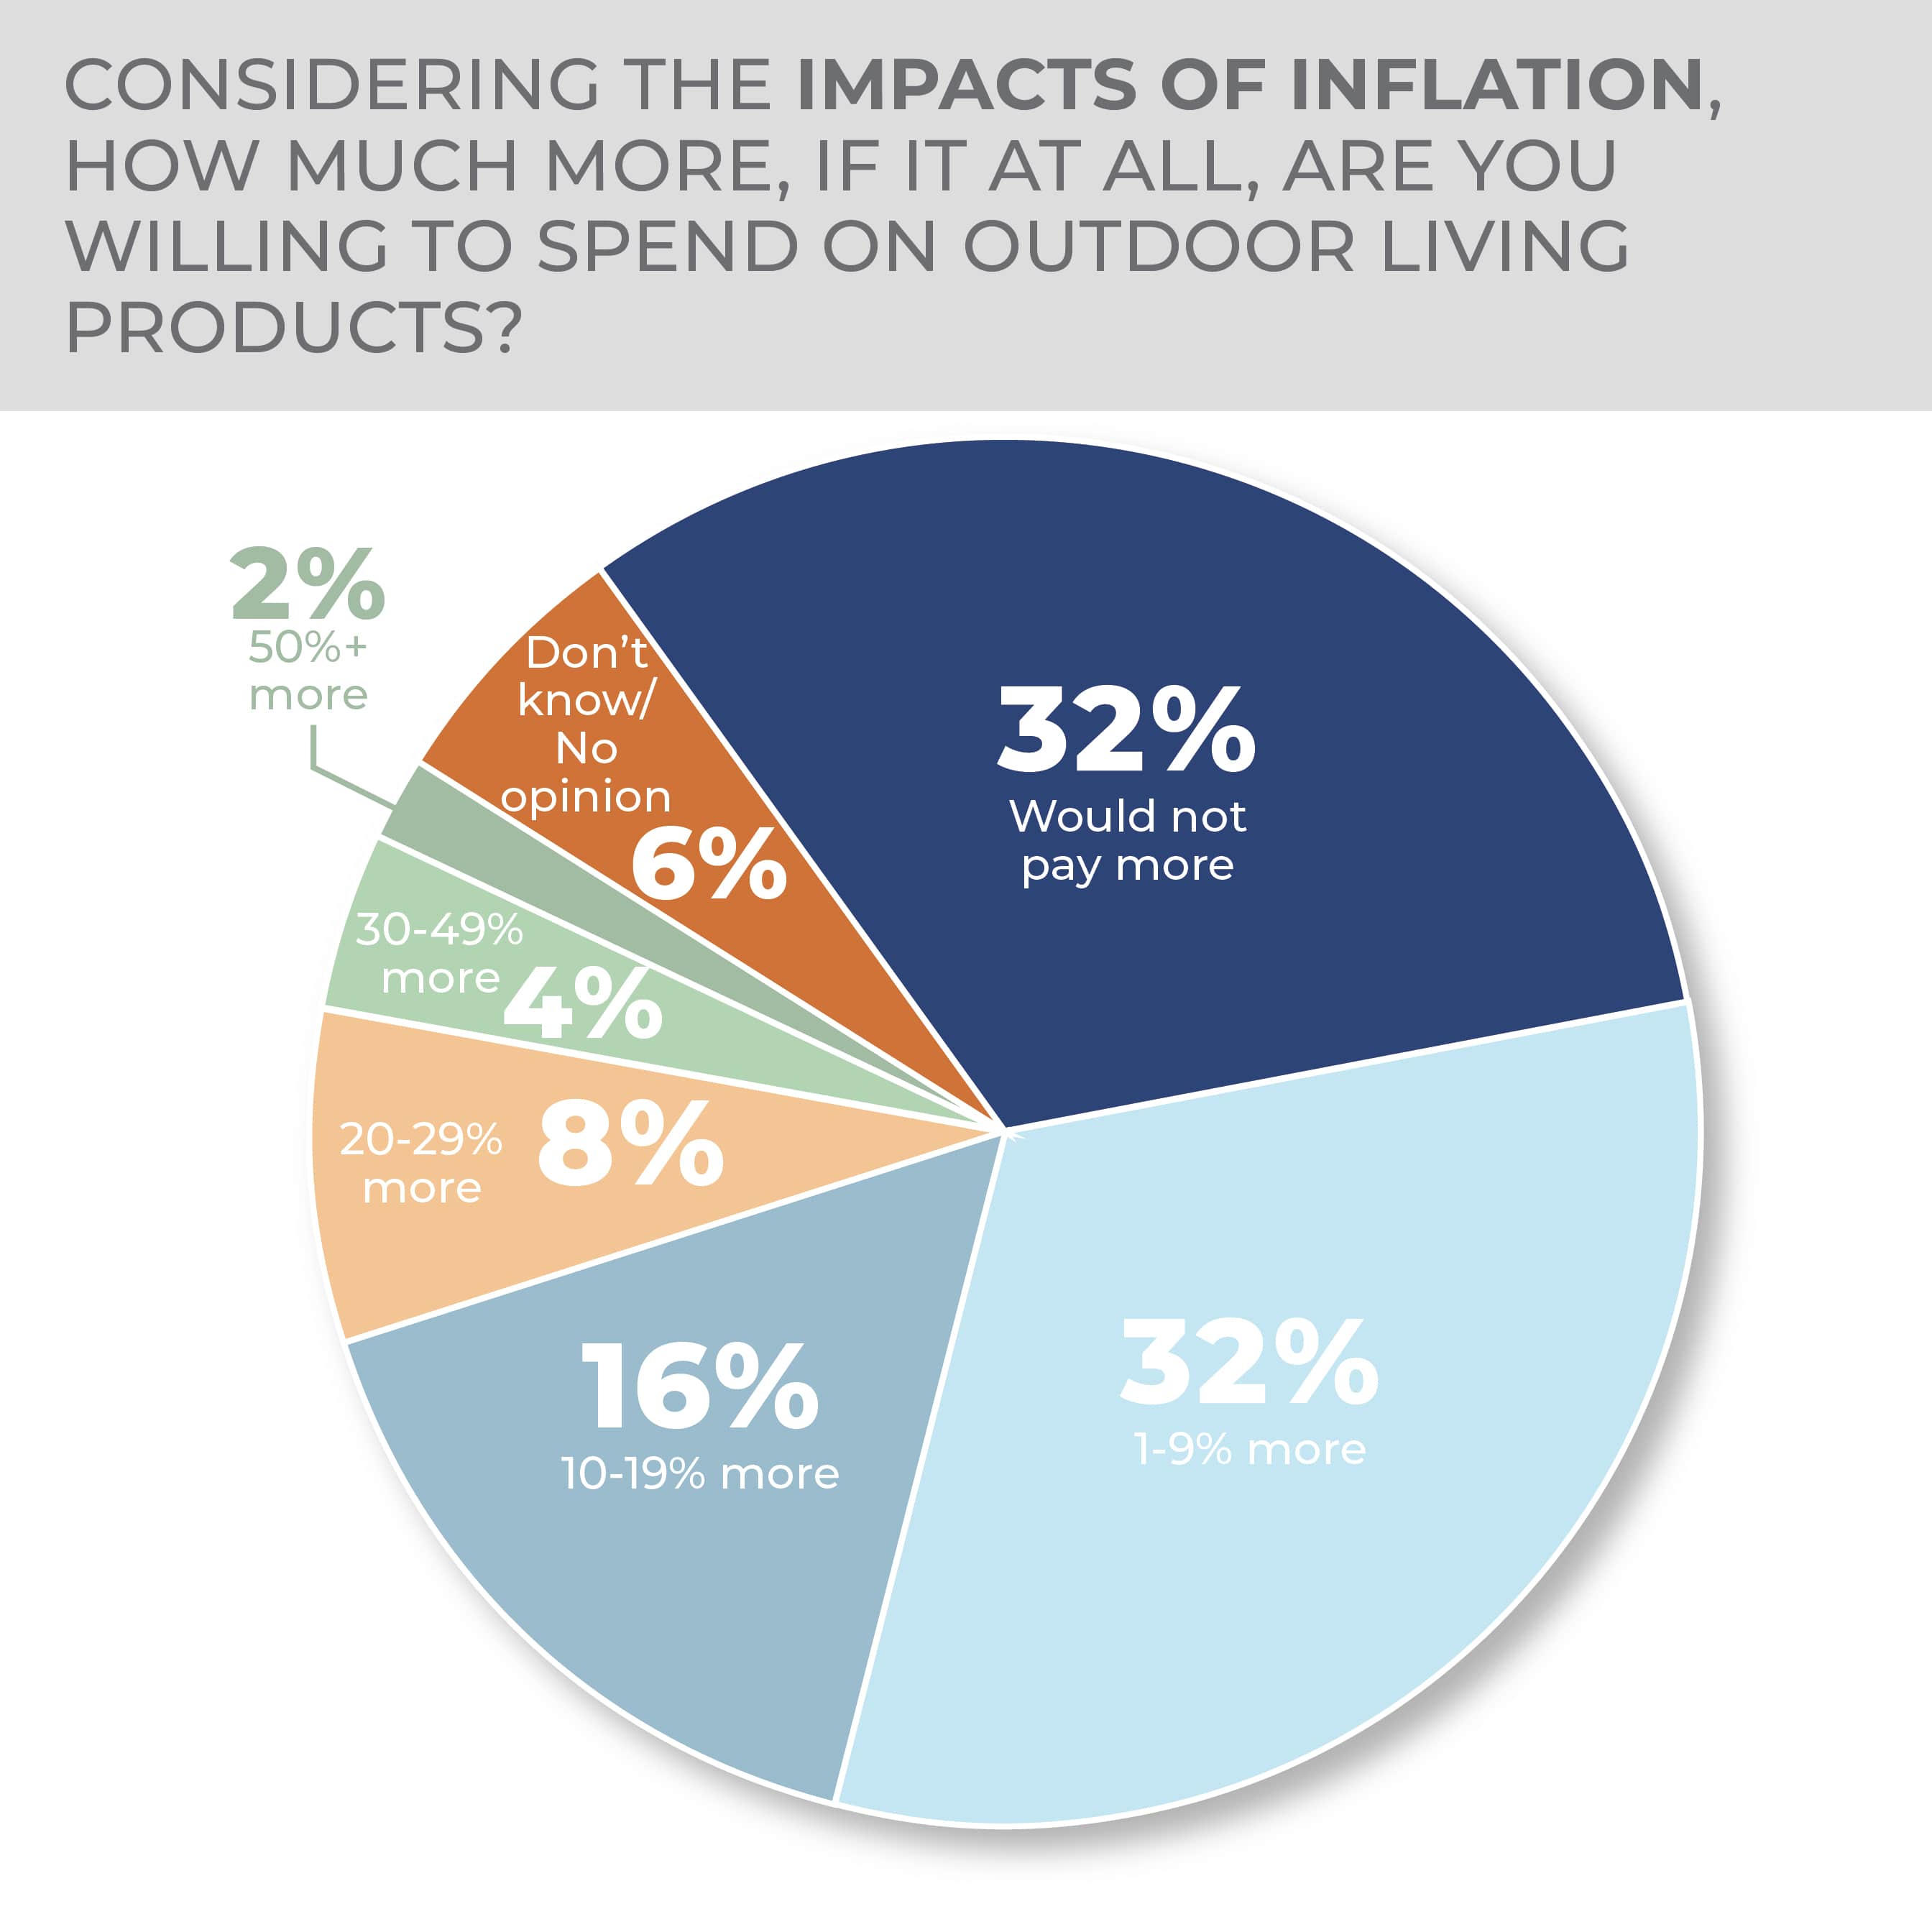
Although many would fight it, a significant proportion of consumers would give in to inflation and pay more for outdoor living products. Almost a third would pay no more but the same proportion, 32%, would pay 1% to 9% more and 16% would pay 10% to 19% more.
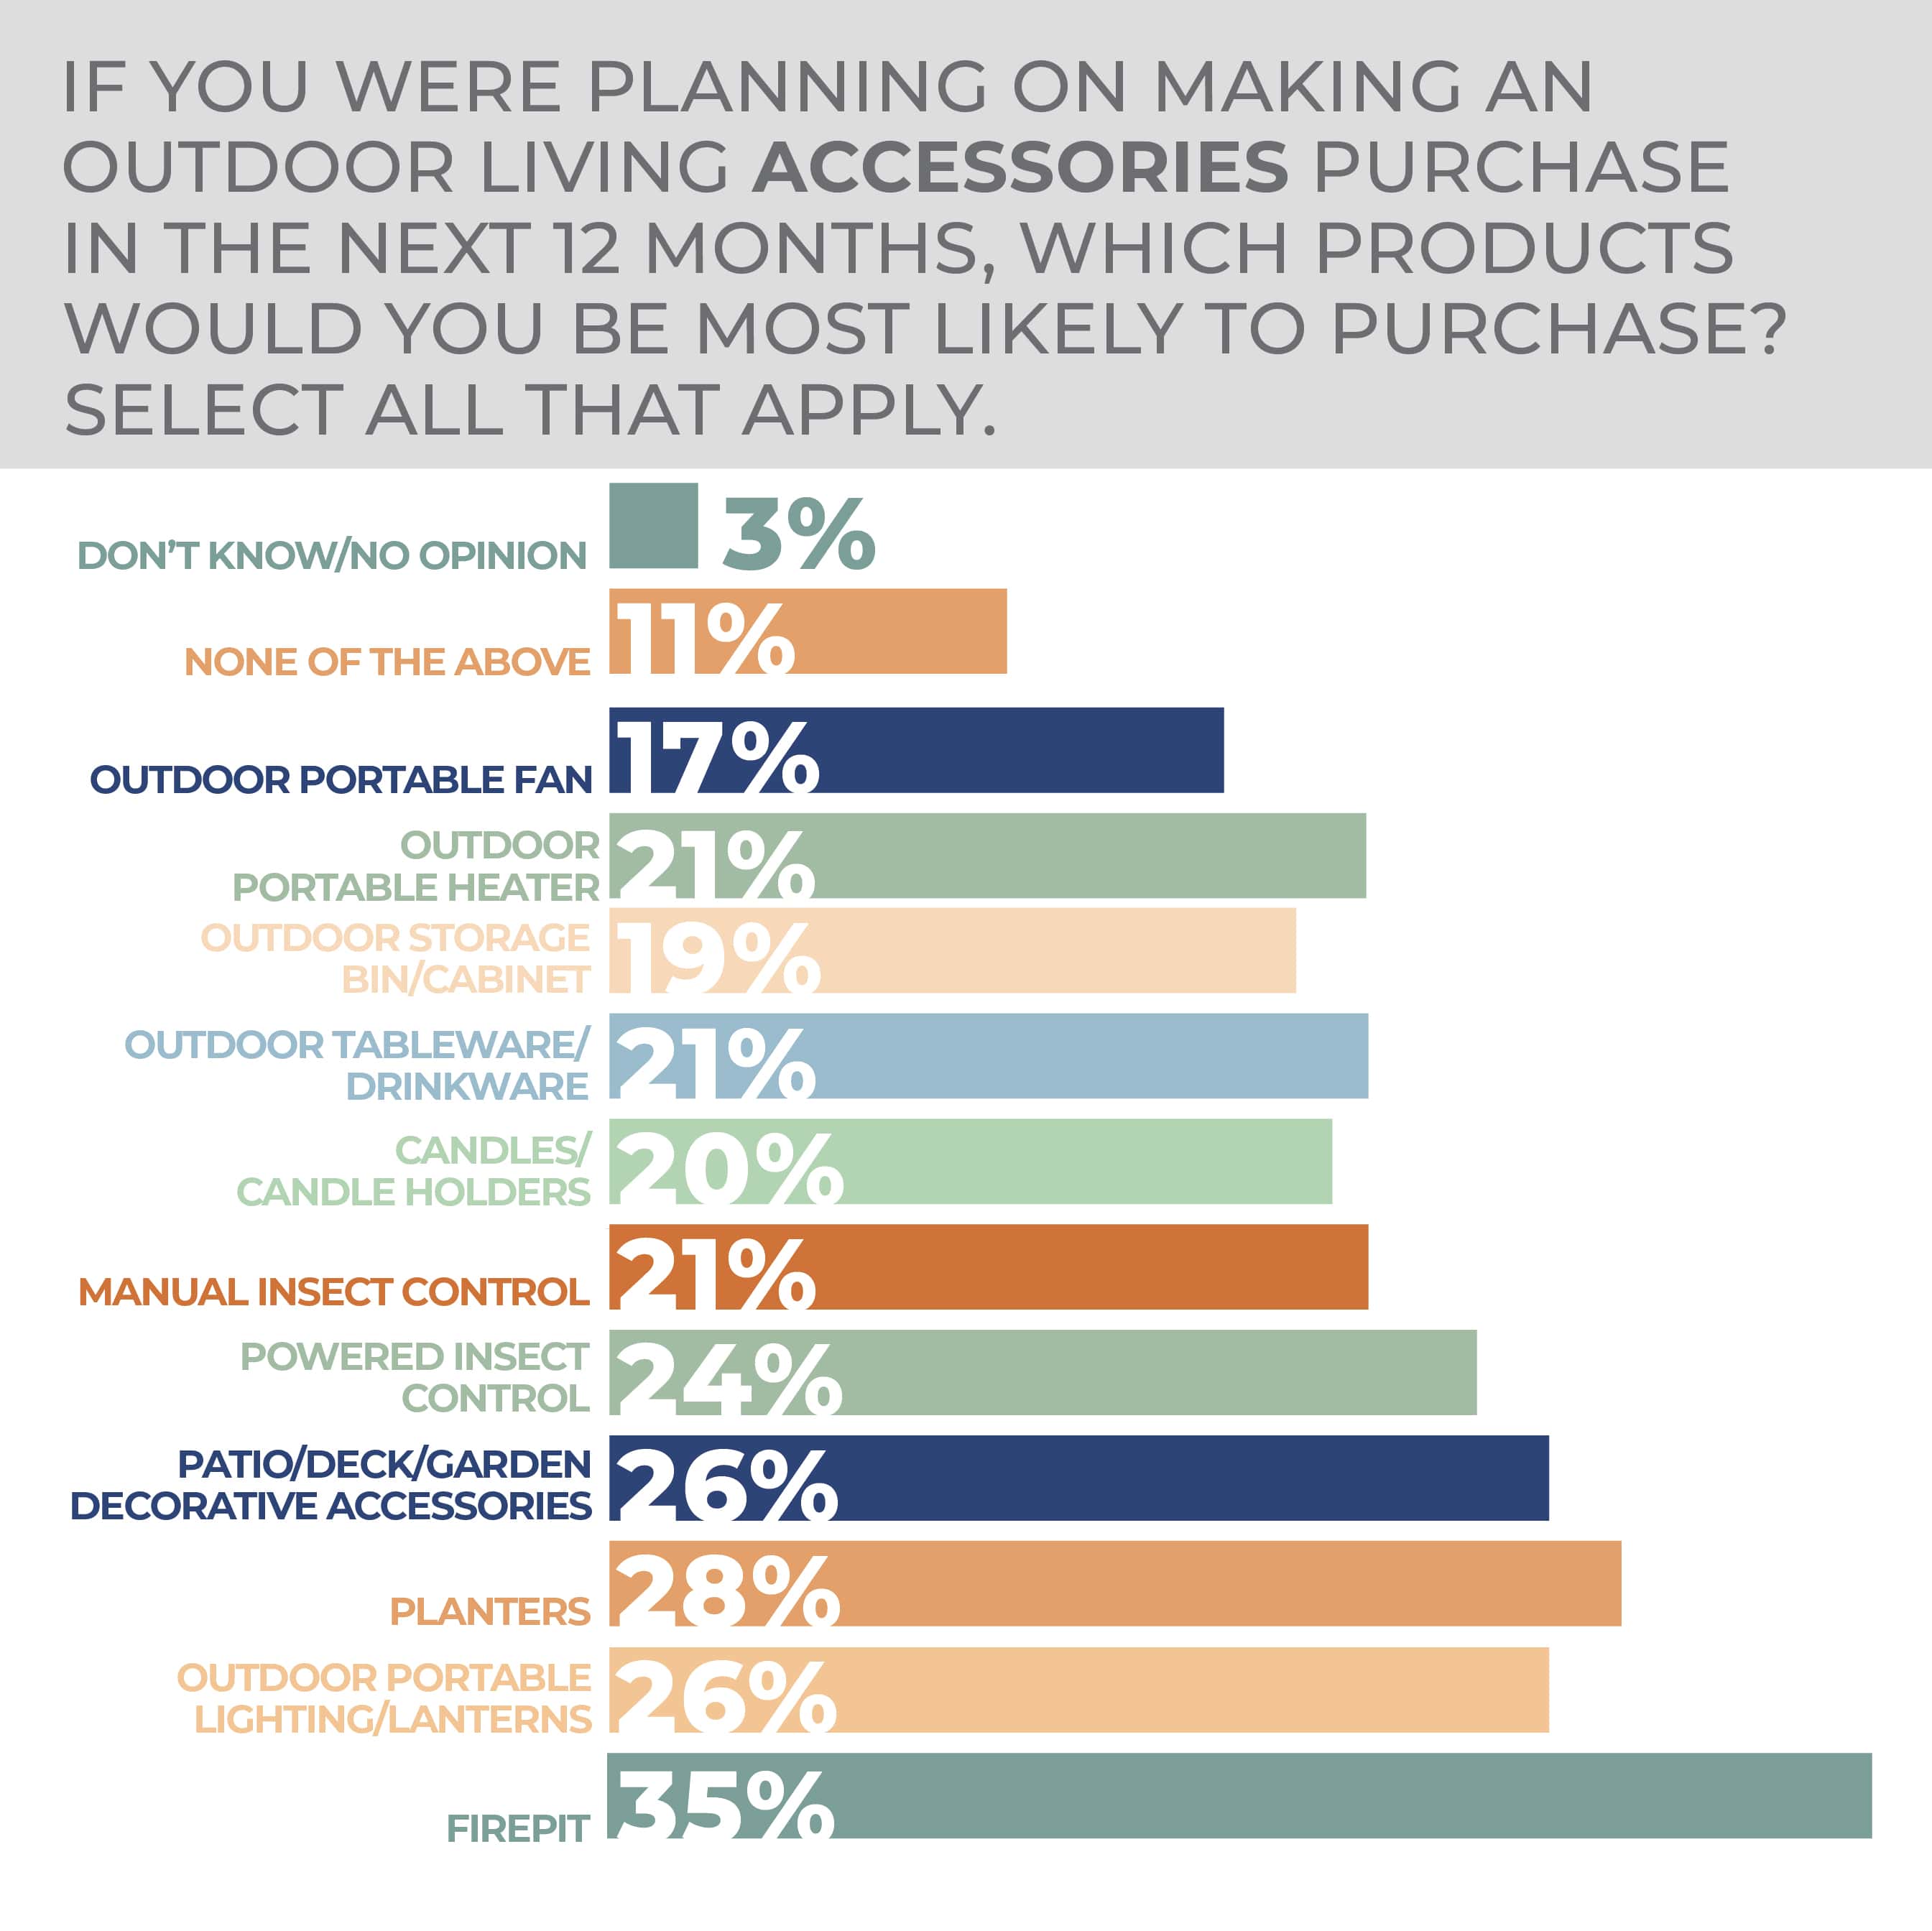
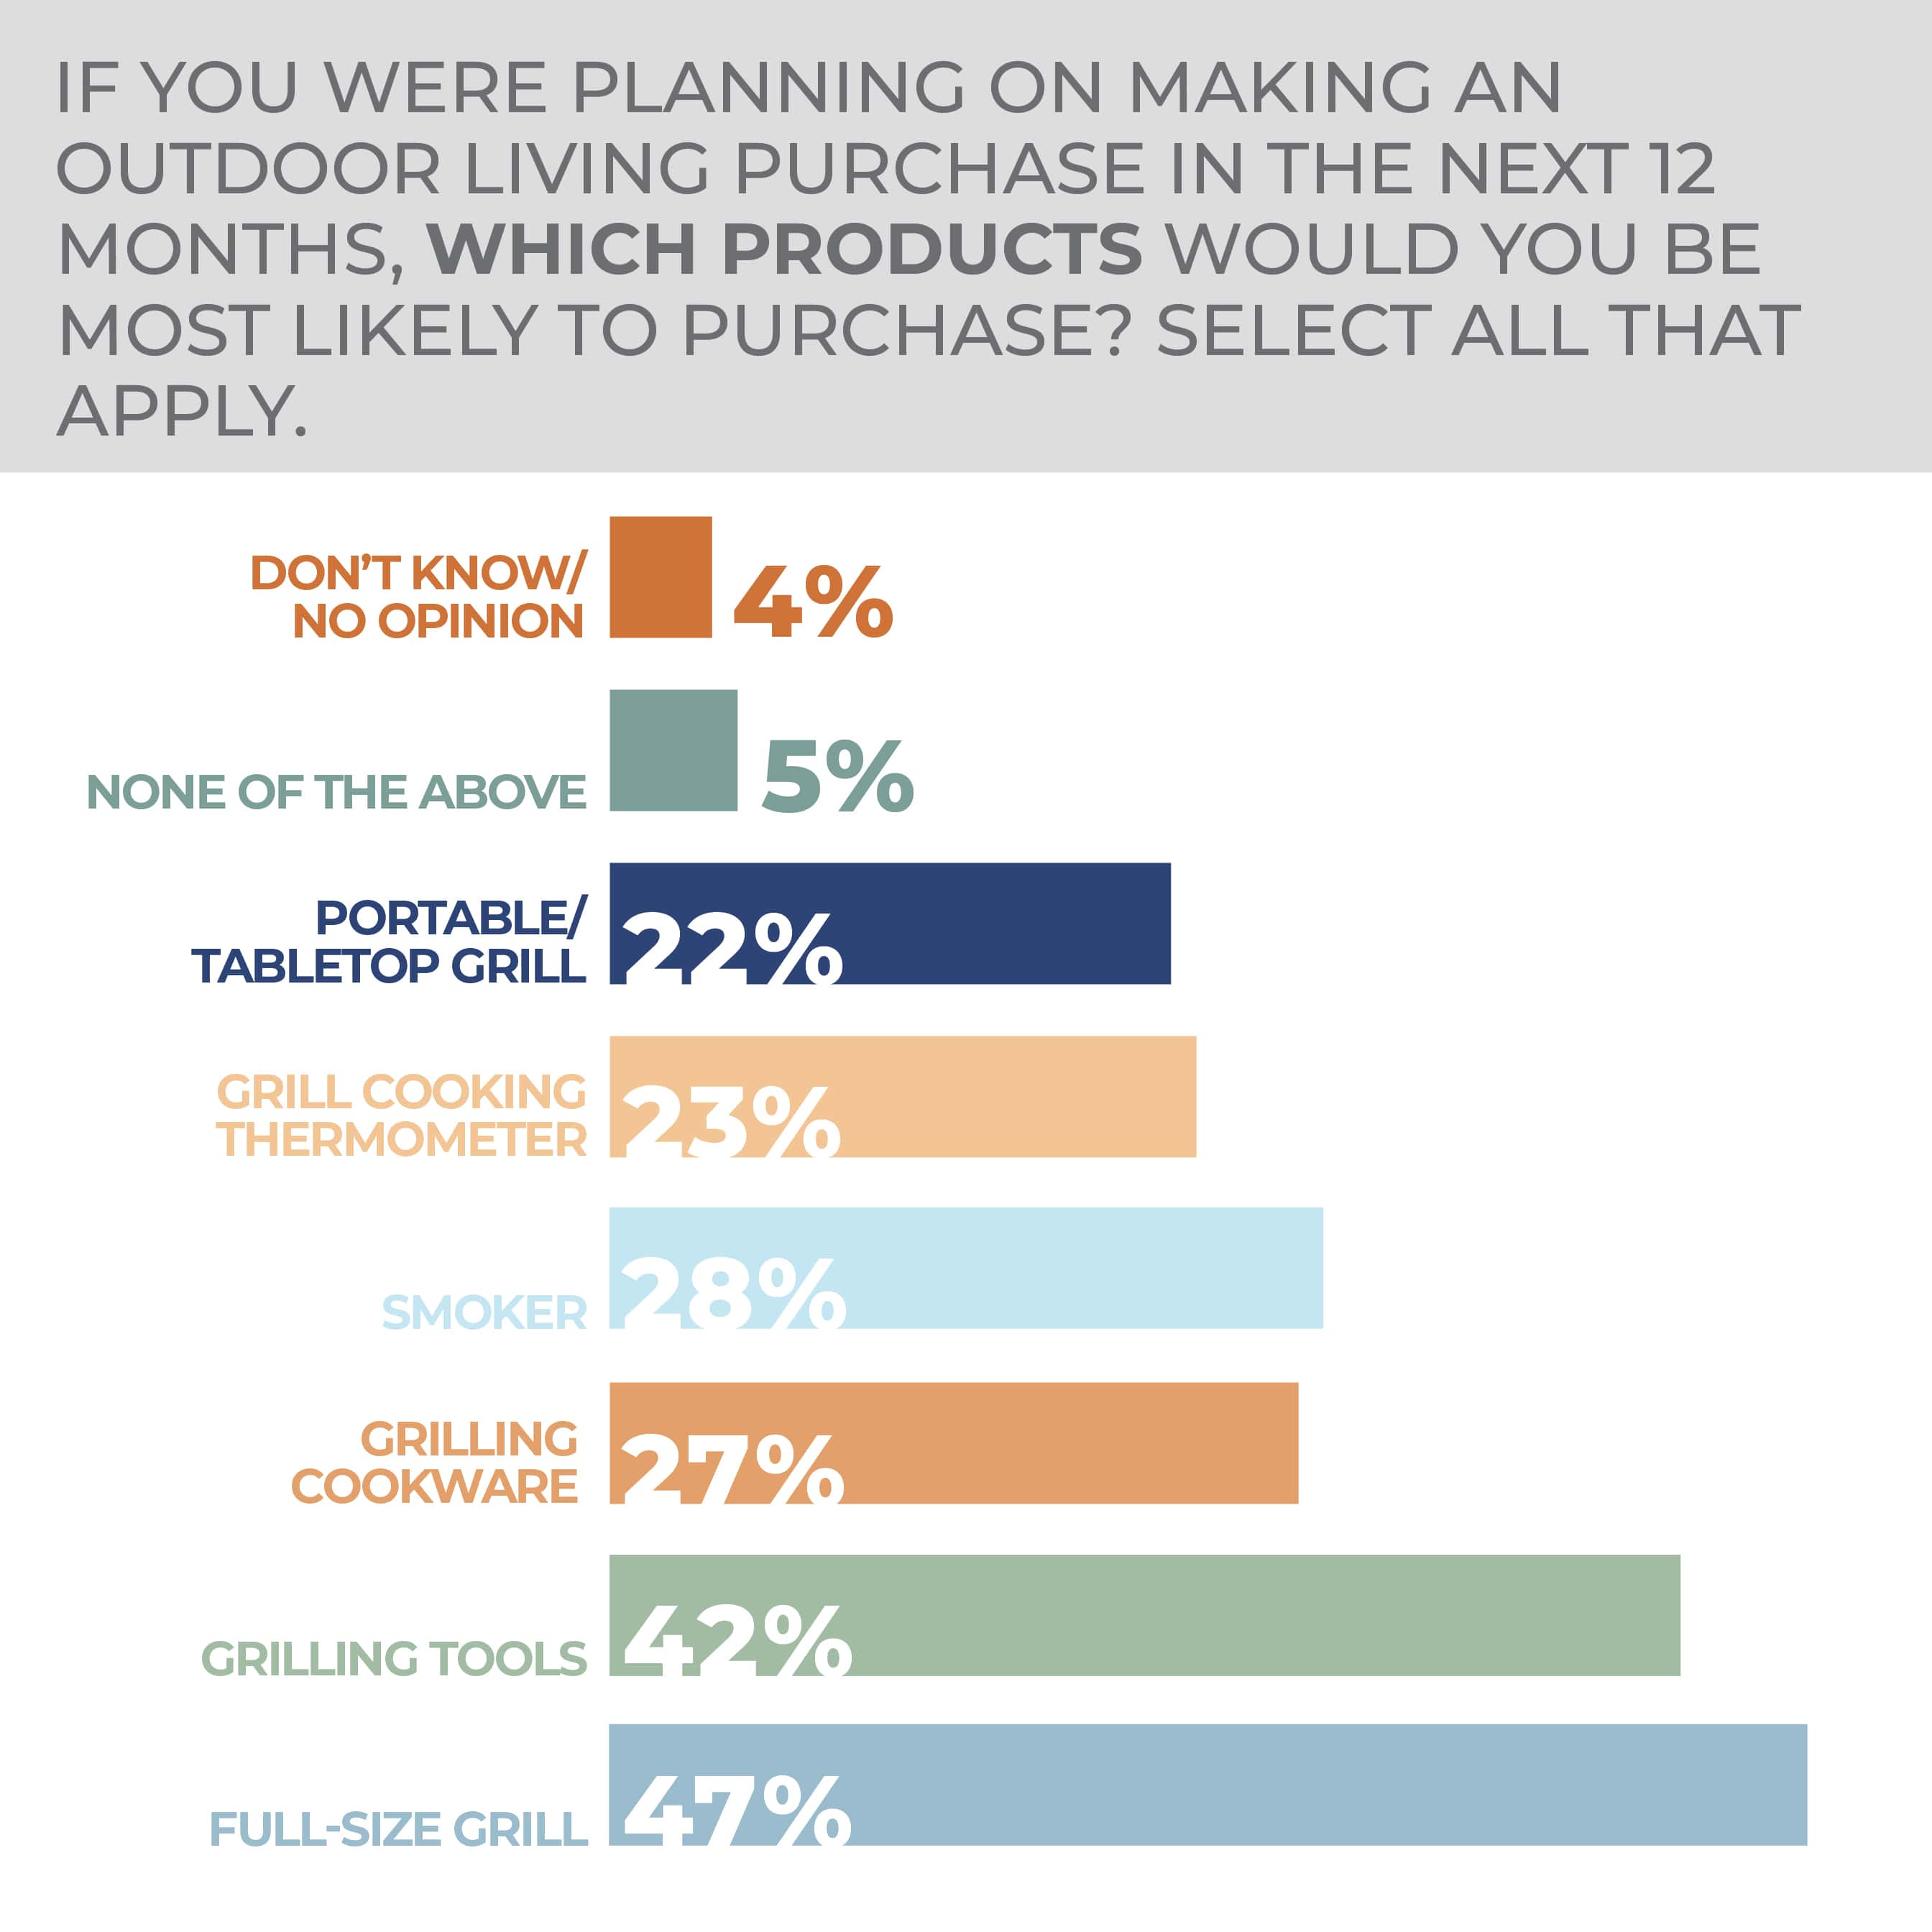
Even if they are on the pricier end of the product category more consumers, at 47%, would most likely purchase a full-size grill in the year ahead than anything else in the category followed by grilling tools at 42%, a smoker at 28%, grilling cookware at 27%, a grill cooking thermometer at 23% and a portable/tabletop grill at 22%. Of those intending to buy outdoor living accessories, 35% would purchase a fire pit, 28% a planter, 26% a decorative patio/deck/garden accessory, 26% an outdoor portable lighting/lanterns, 24% a powered insect control device such as an electric bug zapper, 21% tableware/drinkware, 21% an outdoor portable heater, 20% a candle/candle holder, 20% manual insect control, such as a citronella torch, 19% an outdoor storage bin/cabinet and 17% an outdoor portable fan.
Little difference emerged year over year in both the selections for outdoor living products and accessories. The only substantive differences were found in the outdoor portable lighting, outdoor candle/candle holder and manual insect control segments, down three points from the year prior, and in the fire pit segment, which is up three points.
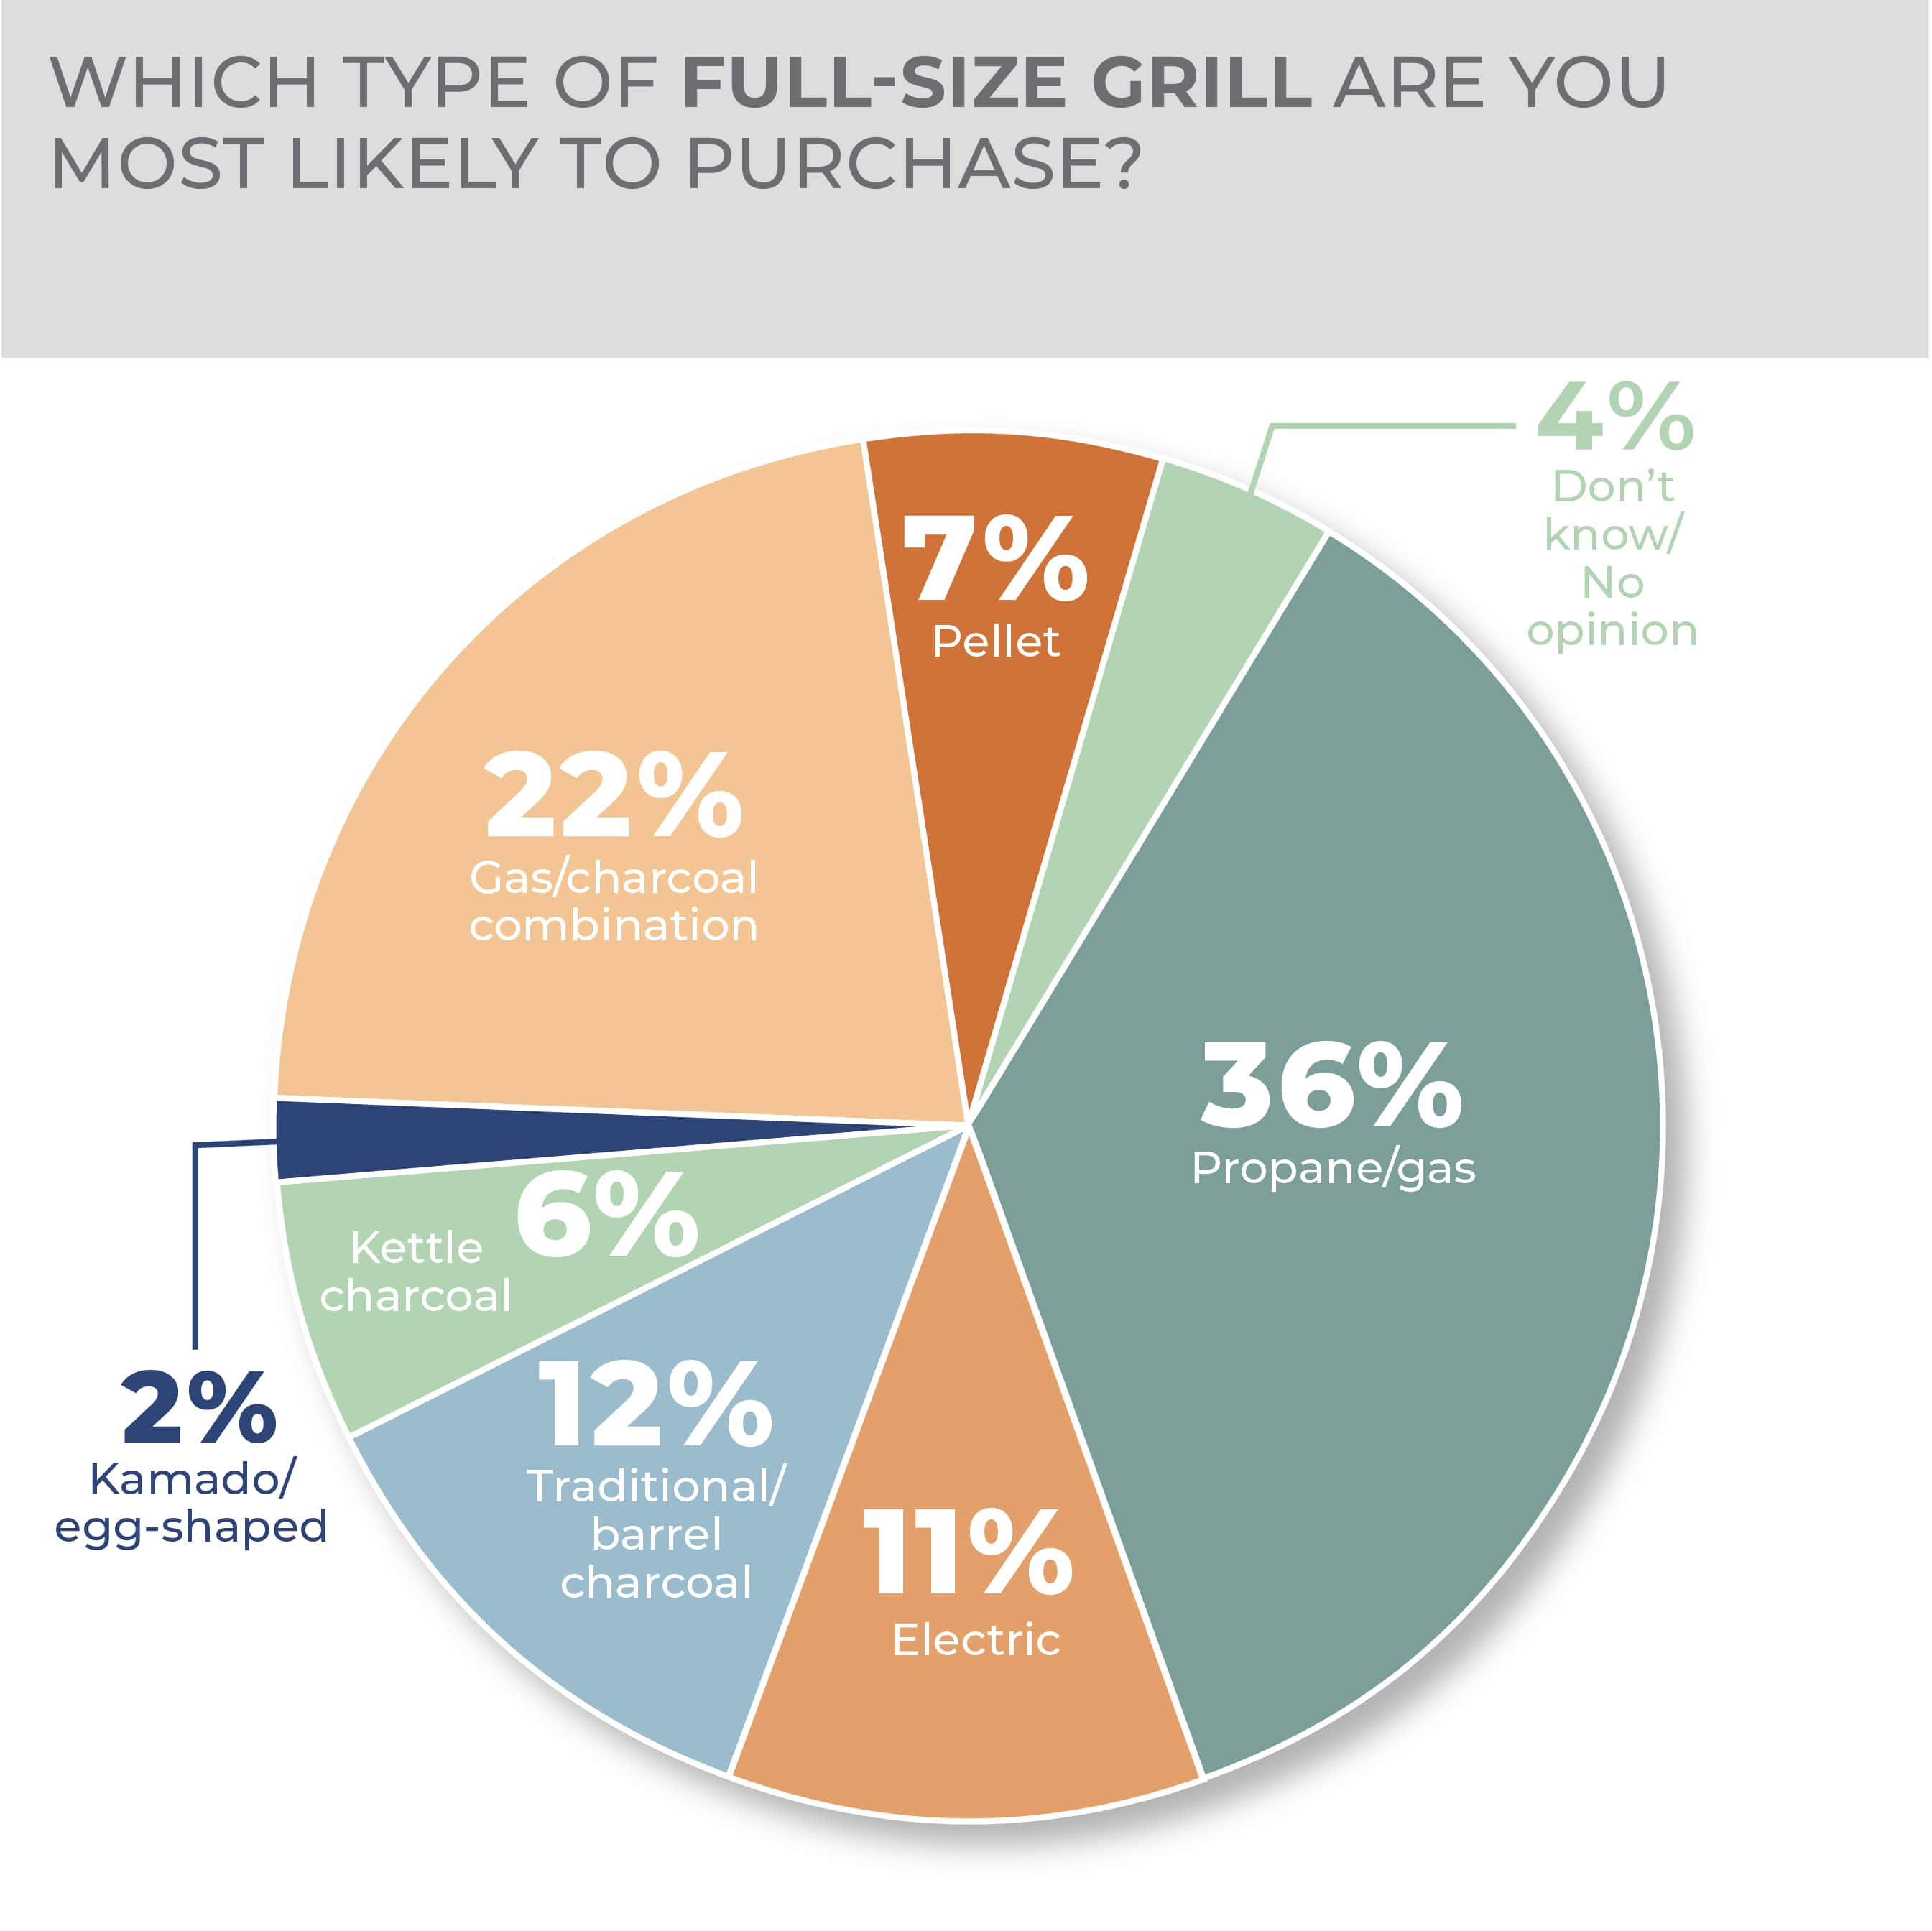
As for grills, the top choices in the category are propane/gas at 36%, gas/charcoal combinations, at 22%, traditional/barrel charcoal, at 12%, and electric, at 11%.
A significant divergence based on gender occurs in the demographics of potential outdoor living product purchases in the year ahead with men 15% very and 25% somewhat likely to purchase versus 9% and 21% of women, respectively. Consumers 18-34 years old come in at 17% very likely and 29% somewhat likely to make a purchase in the category, while those 35-44 responded 16% very and 32% somewhat likely. Then, those 45-64 are 11% very and 22% somewhat likely and those 65 and older are 5% very and 12% somewhat likely to purchase.
Southerners are most intent on purchasing at 14% very and 24% somewhat likely to do so, while residents of other regions were close in their considerations, with Northeasterners 11% very and 24% somewhat likely, and Midwesterners and Westerners both at 11% very and 22% somewhat likely to purchase.
More Outdoor Living Findings:
Pet Accessories
The new pet market has slowed a bit since its height during the pandemic’s peak. All those new pet owners are contributing to what could be a long-lasting growth curve in pet accessories, including products closely aligned to the home and housewares business.
It didn’t take stay-at-home lifestyles to create the dynamic of pet owners, especially owners of dogs and cats, treating their pets as family members worthy of a myriad of spoils and comforts. But the surge in pet ownership certainly amped up the aftermarket opportunity for pet accessories.
Of all categories examined in the HomePage News 2023 Consumer Outlook Survey, pet accessories was the second most likely category purchase prospect in the next 12 months with 28% of respondents very likely and 32% somewhat likely to buy pet accessories.
A closer look reveals a retail sales sweet spot for pet products in younger consumers moving out on their own, starting households or starting/expanding families. Some 69% of survey respondents 18-34 and 66% of respondents 35-44 expressed their intent to buy pet products in the next year.
The pet accessory category leans toward a preference for online purchasing with 43% of consumers equally likely to purchase in-store or online and 17% most likely to purchase online. Further to the heightened marketing opportunity to younger consumers, only 32% of consumers 18-34 and 32% of consumers 35-44 say they are likely to purchase pet products in stores. By comparison, 44% of consumers 45-65 and 51% of consumers 65 and older are more likely to buy such products in stores.
-
- Of all categories examined in the survey, pet accessories was the second most likely category purchase prospect in the next 12 months.
- A closer look reveals a retail sales sweet spot for pet products in younger consumers moving out on their own, starting households or starting/expanding families.
Like most categories covered in the survey, mass market stores and websites were selected by more than 50% of respondents as the preferred channels from which to purchase pet accessories. However, pet specialty stores, selected by 28% of respondents, retain a strong share of consumer purchase intent in what many consumers view as a highly specialized category.
The survey results indicate dogs (owned by 76% of respondents) and cats (53%) are by far the most prevalent types of pets.
With many products within the pet accessory business aligned to home and housewares, and considering the increased market base for the pet category, the survey confirmed the opportunity for home and housewares retailers beyond mass merchants to expand their pet-aligned selections.
Among housewares-related pet products, top purchase intent choices among consumers include pet food bowl/feeder (selected by 38% of respondents); dog bed/furniture (34%); pet food storage (30%); pet toy/accessory storage (27%); litter box (24%); manual pet grooming tool (23%); cat/tower furniture (21%); and large-pet cleaning tool (11%).
Gen Zers demonstrated notably higher purchase intent in such categories as pet food and accessory storage, large-pet cleaning tools, manual grooming tools and pet food bowls/feeders.
More Pet Accessories Findings:
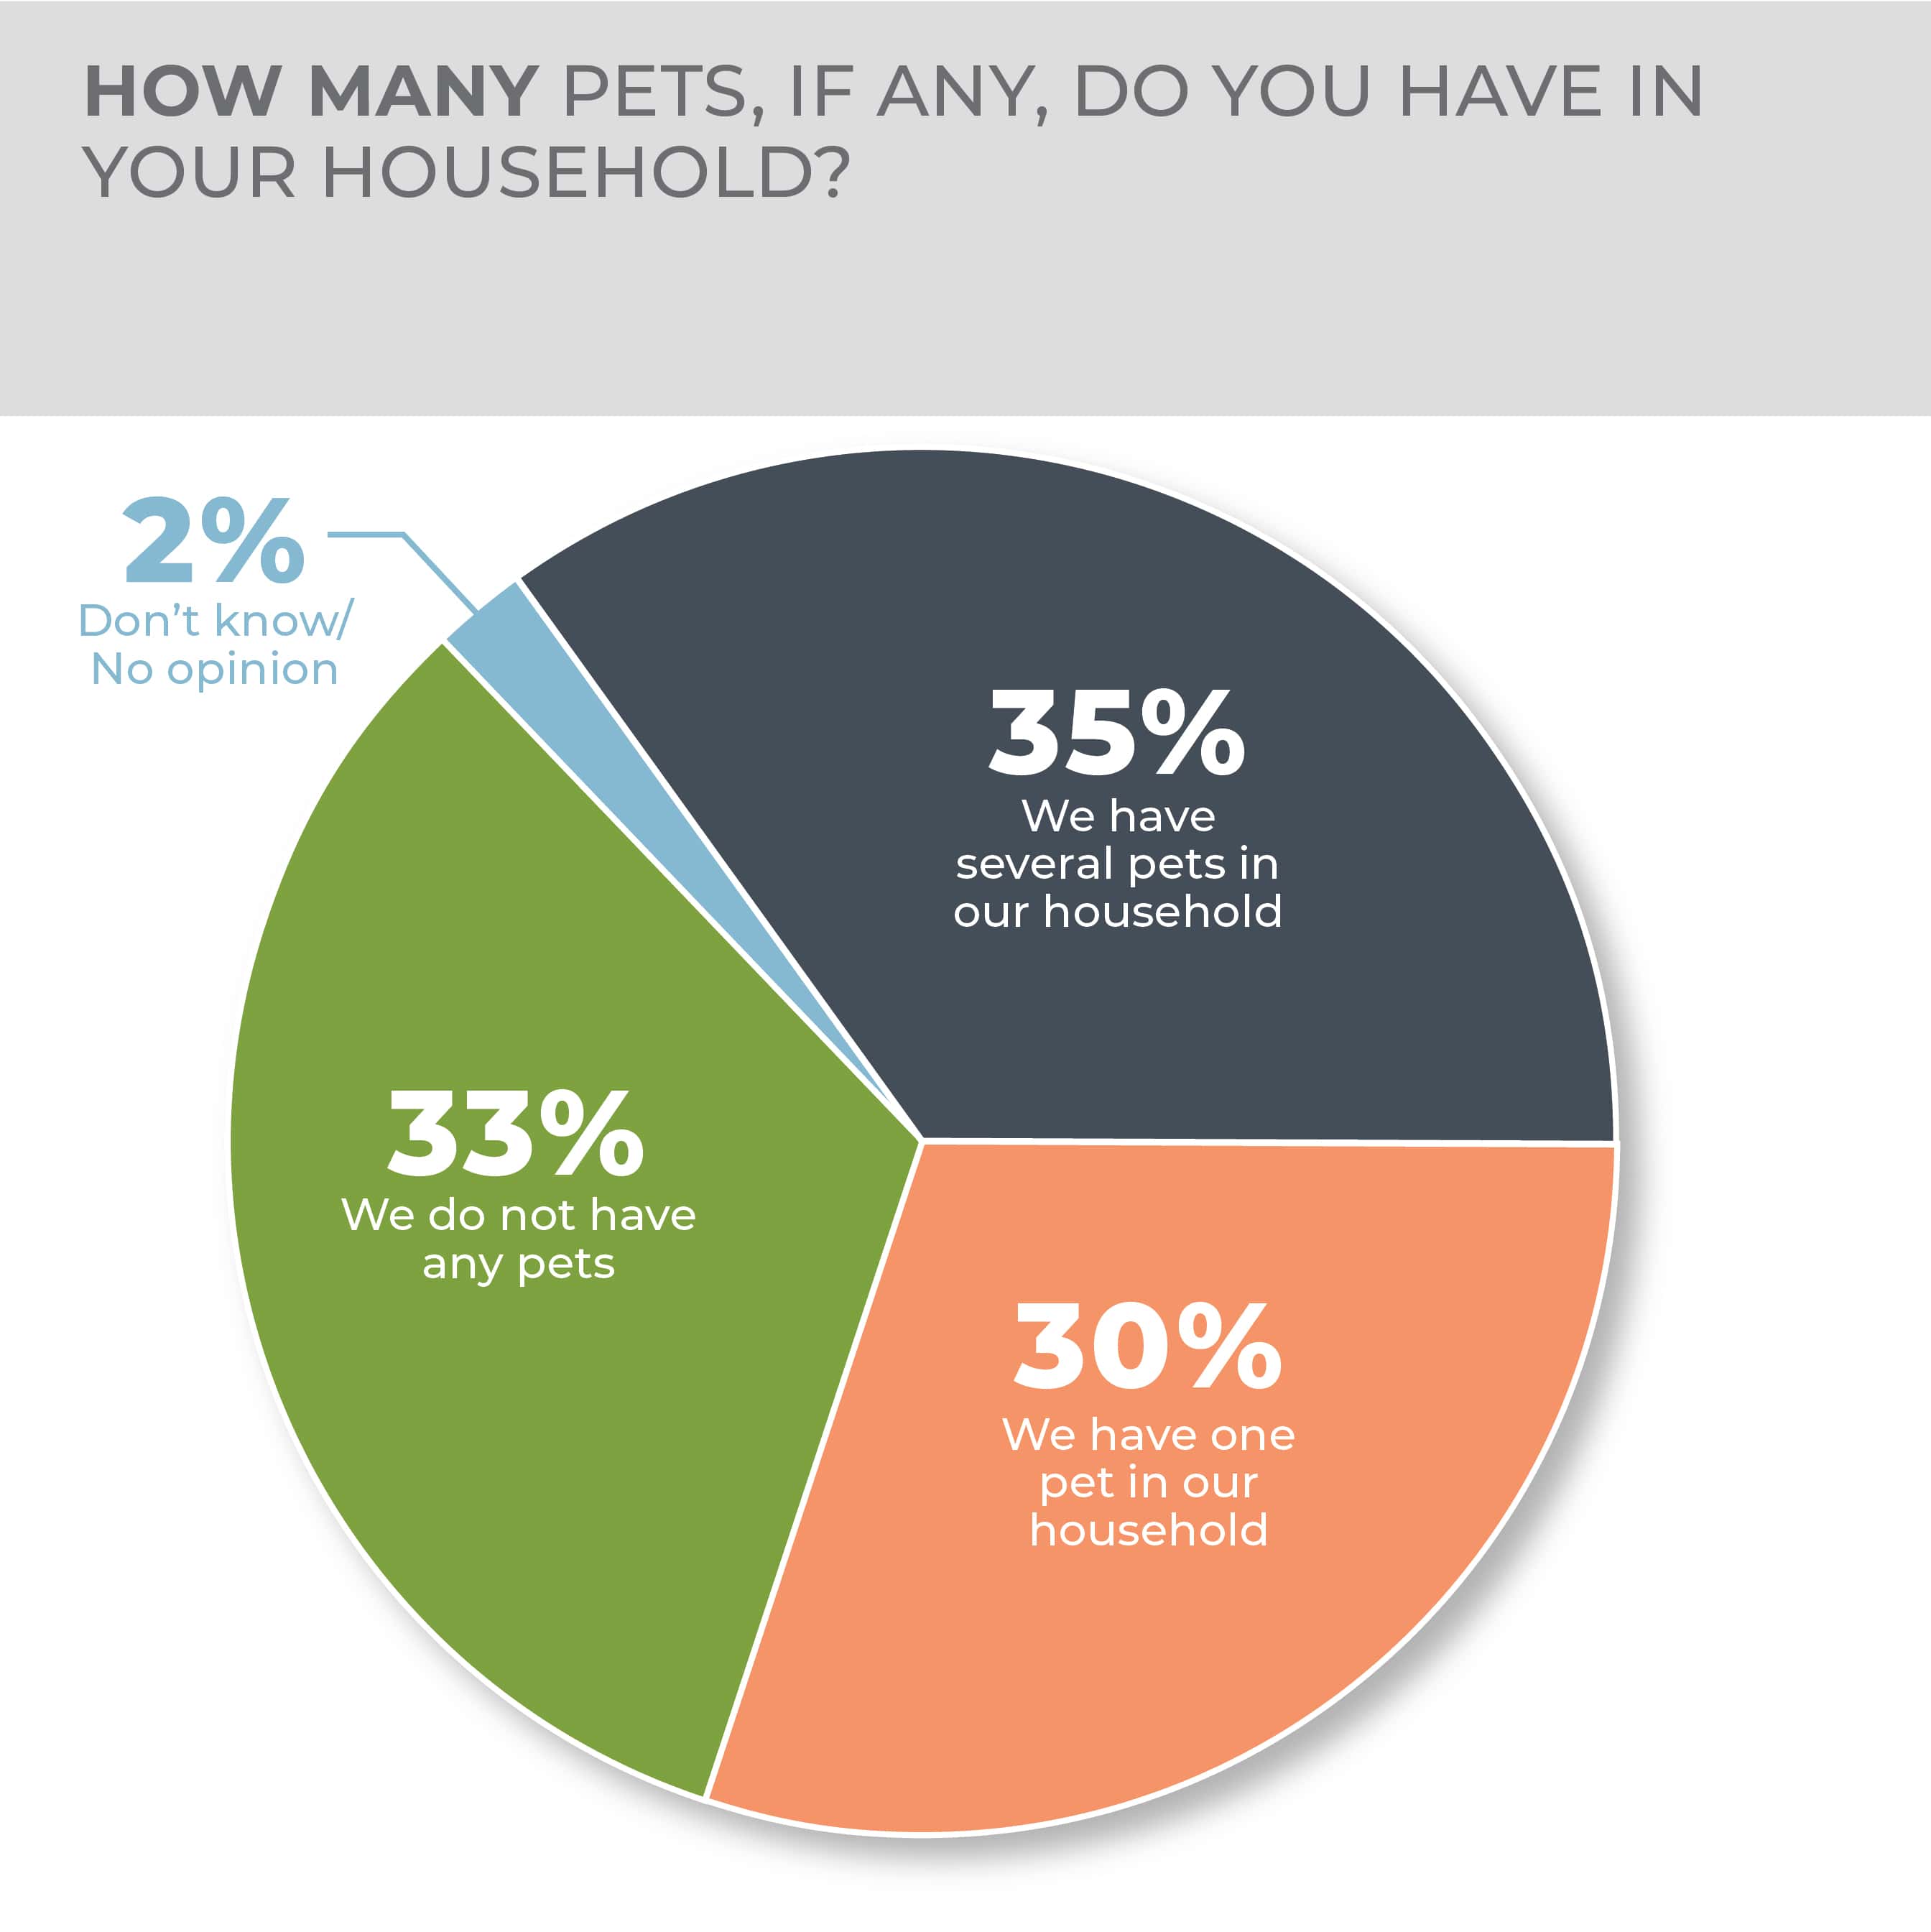
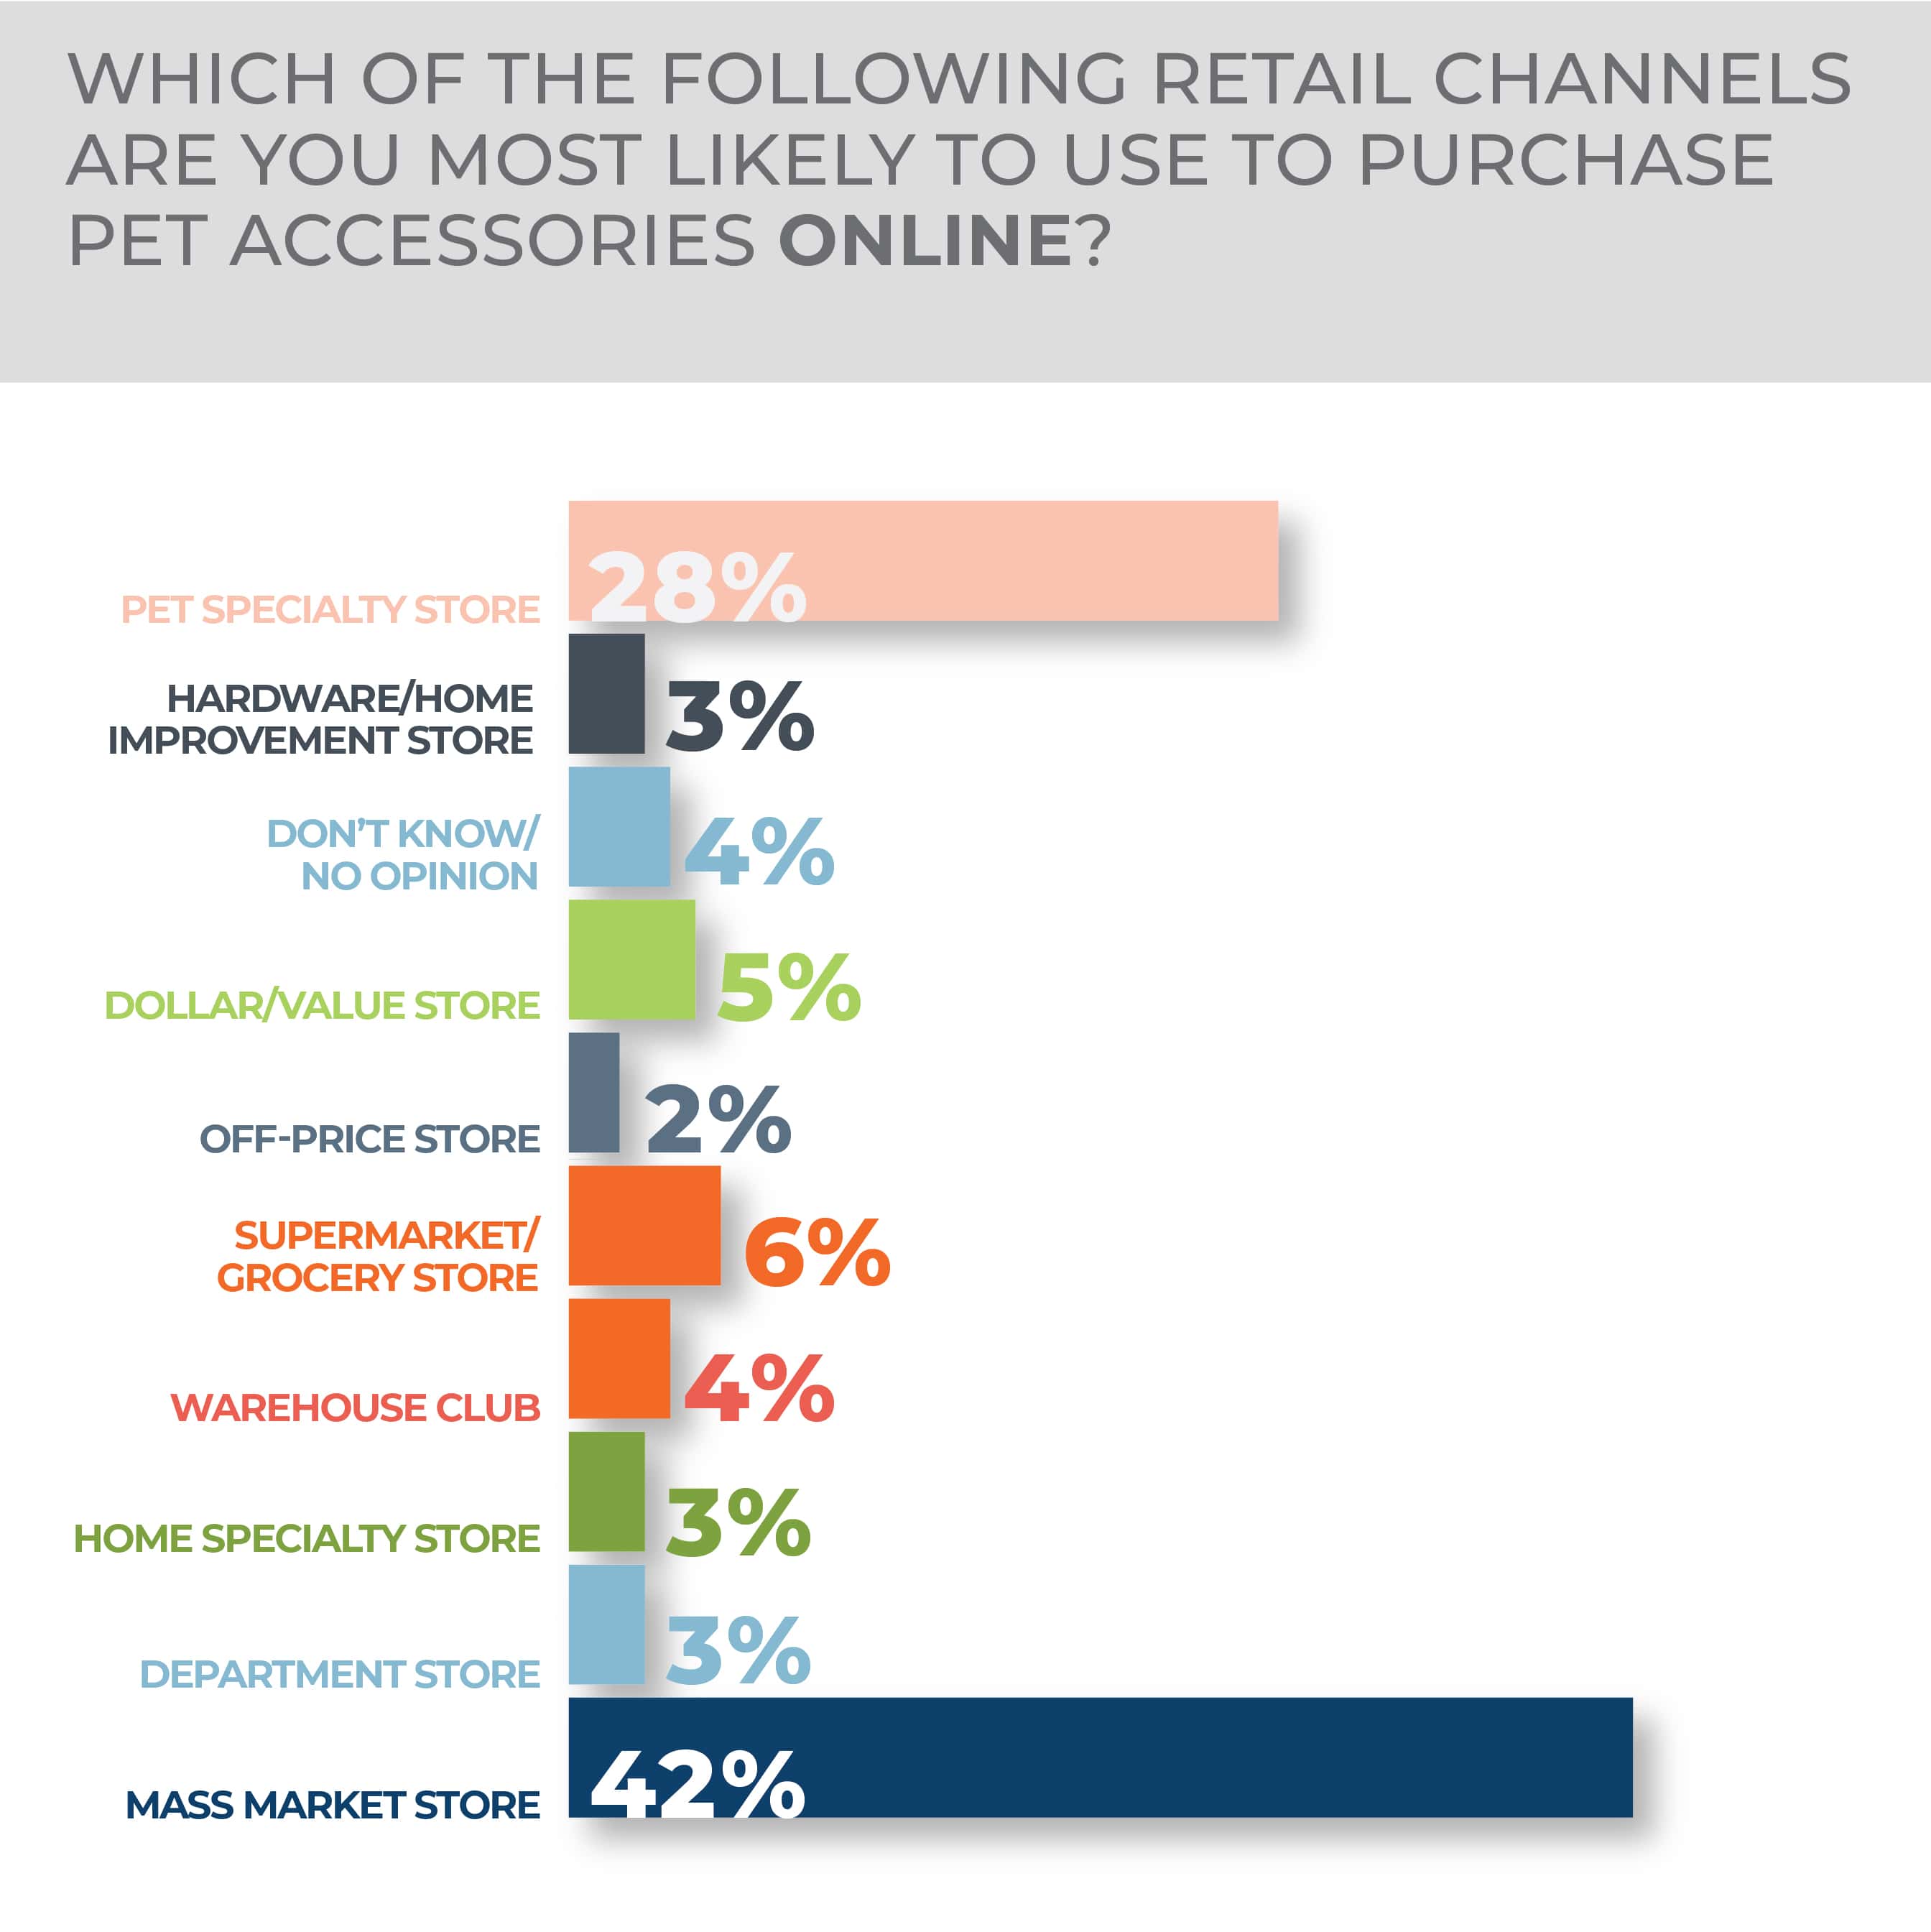
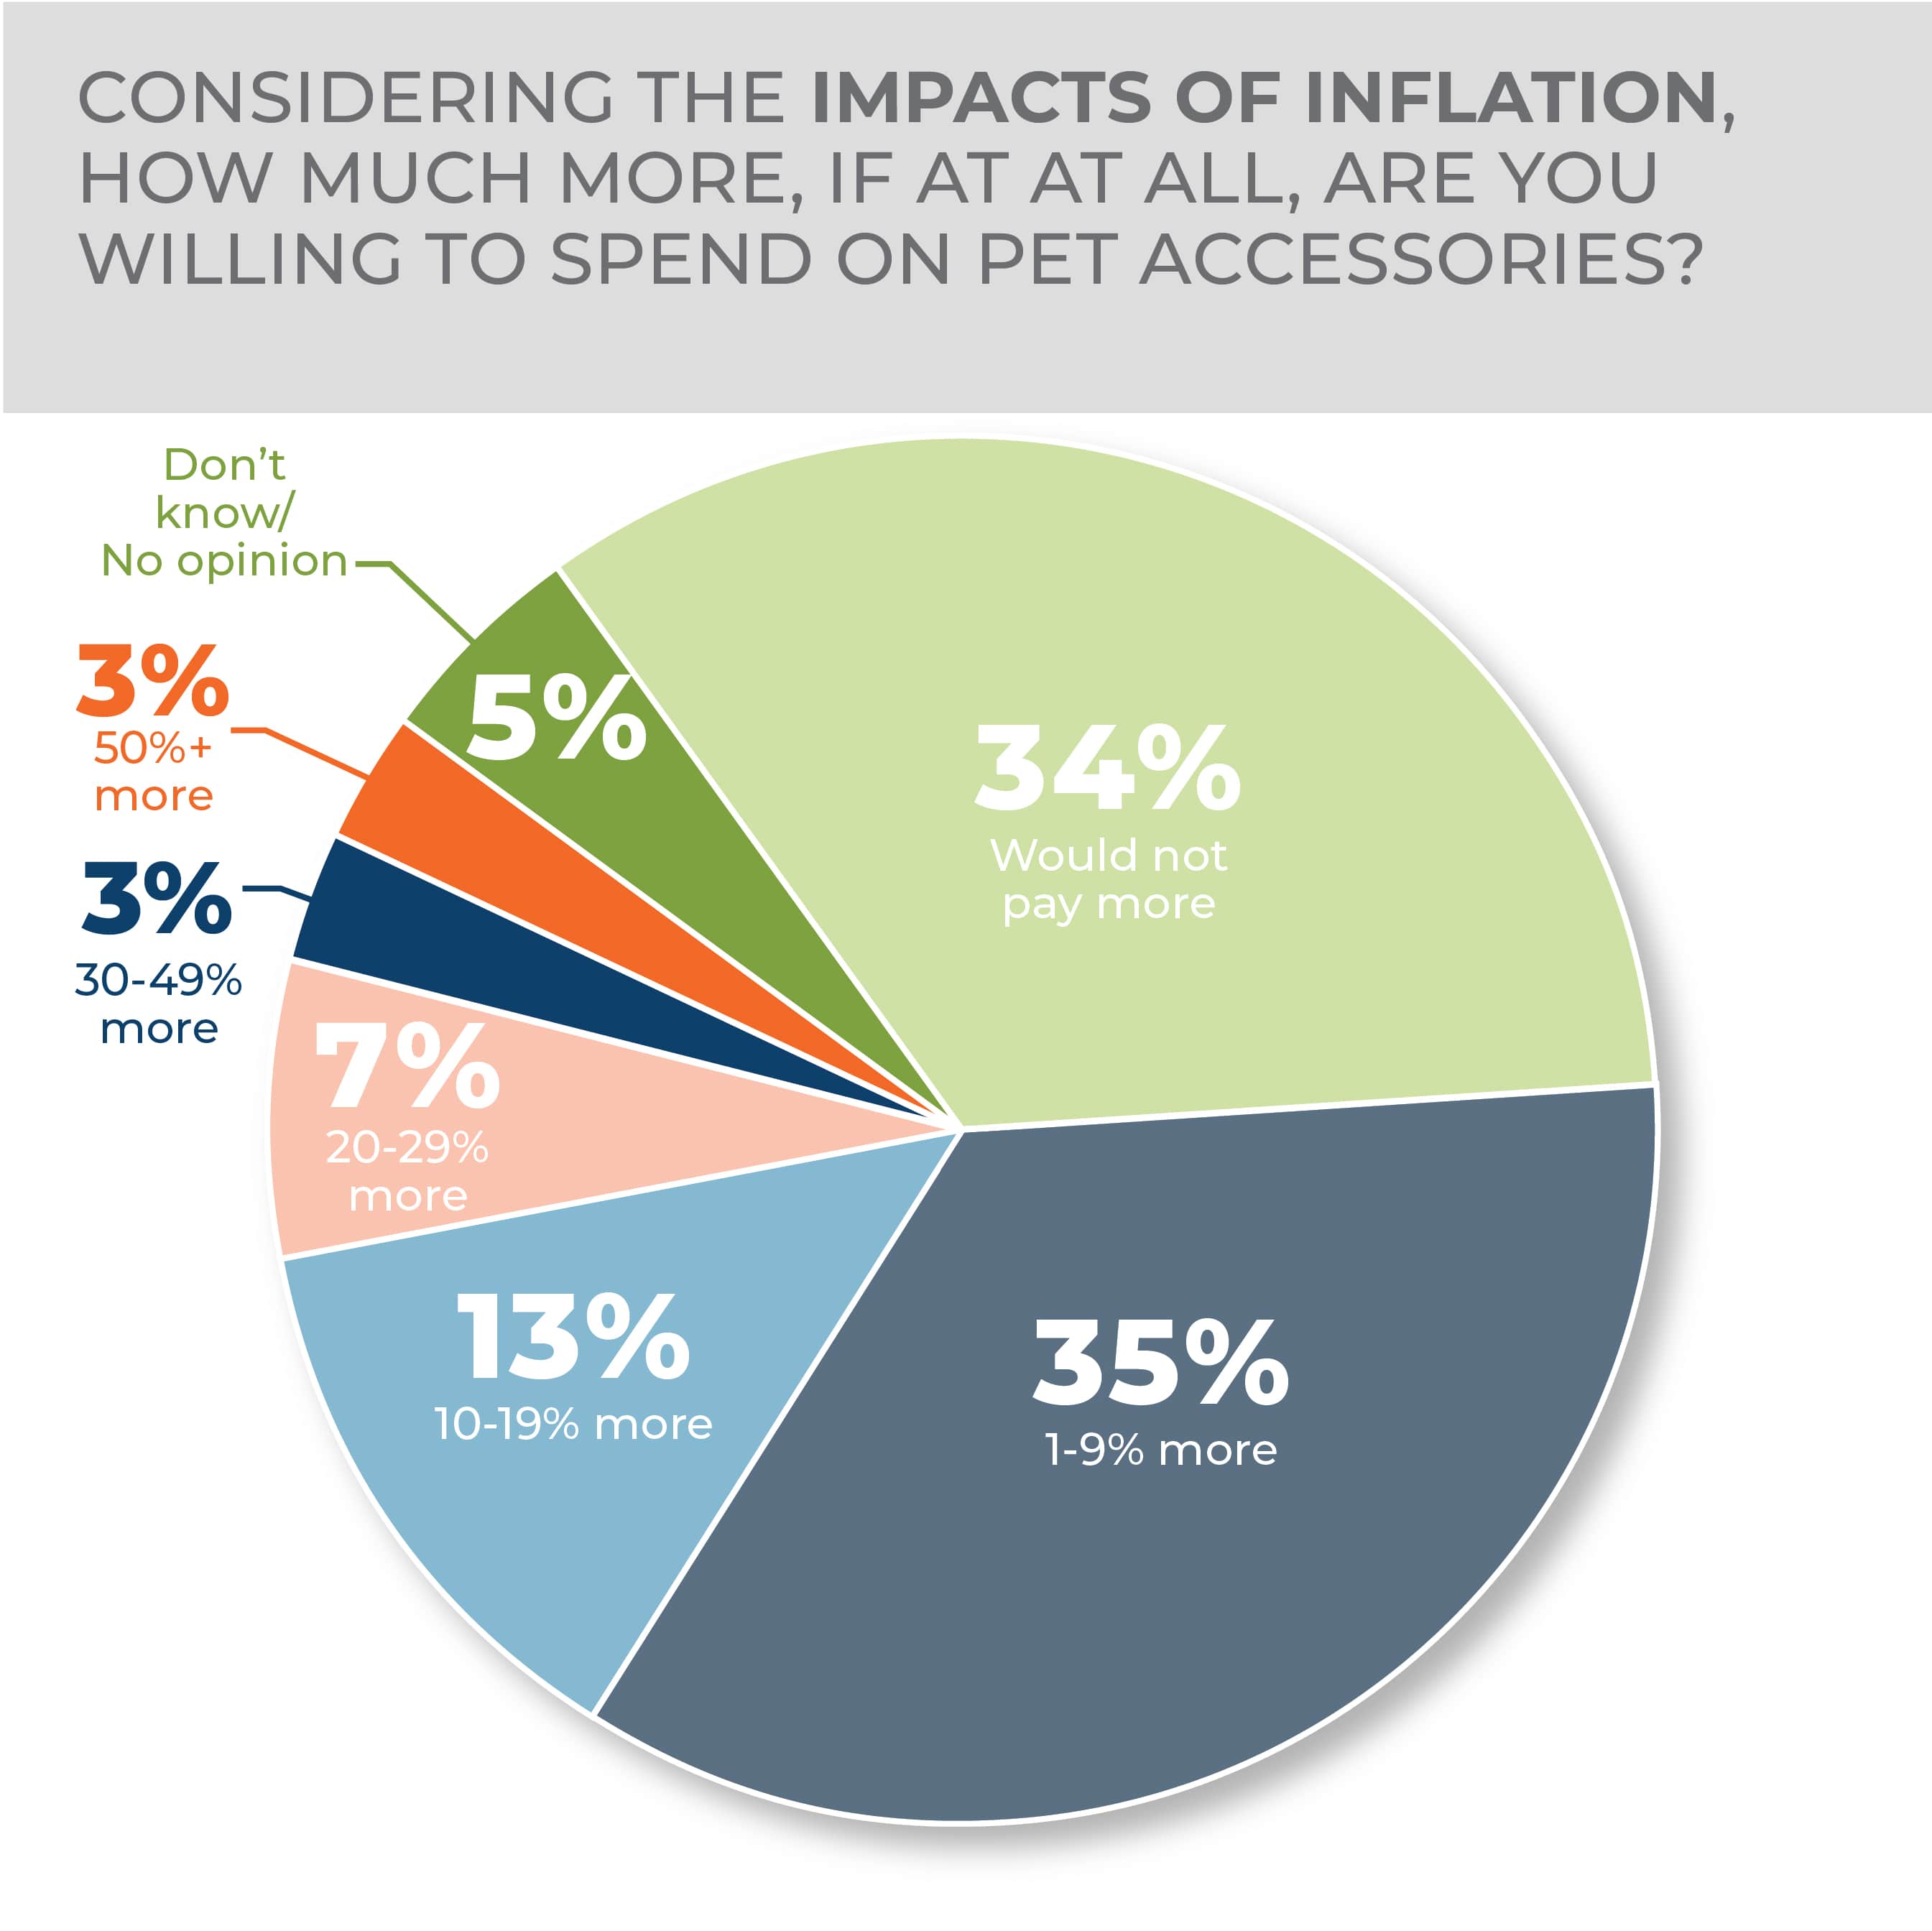
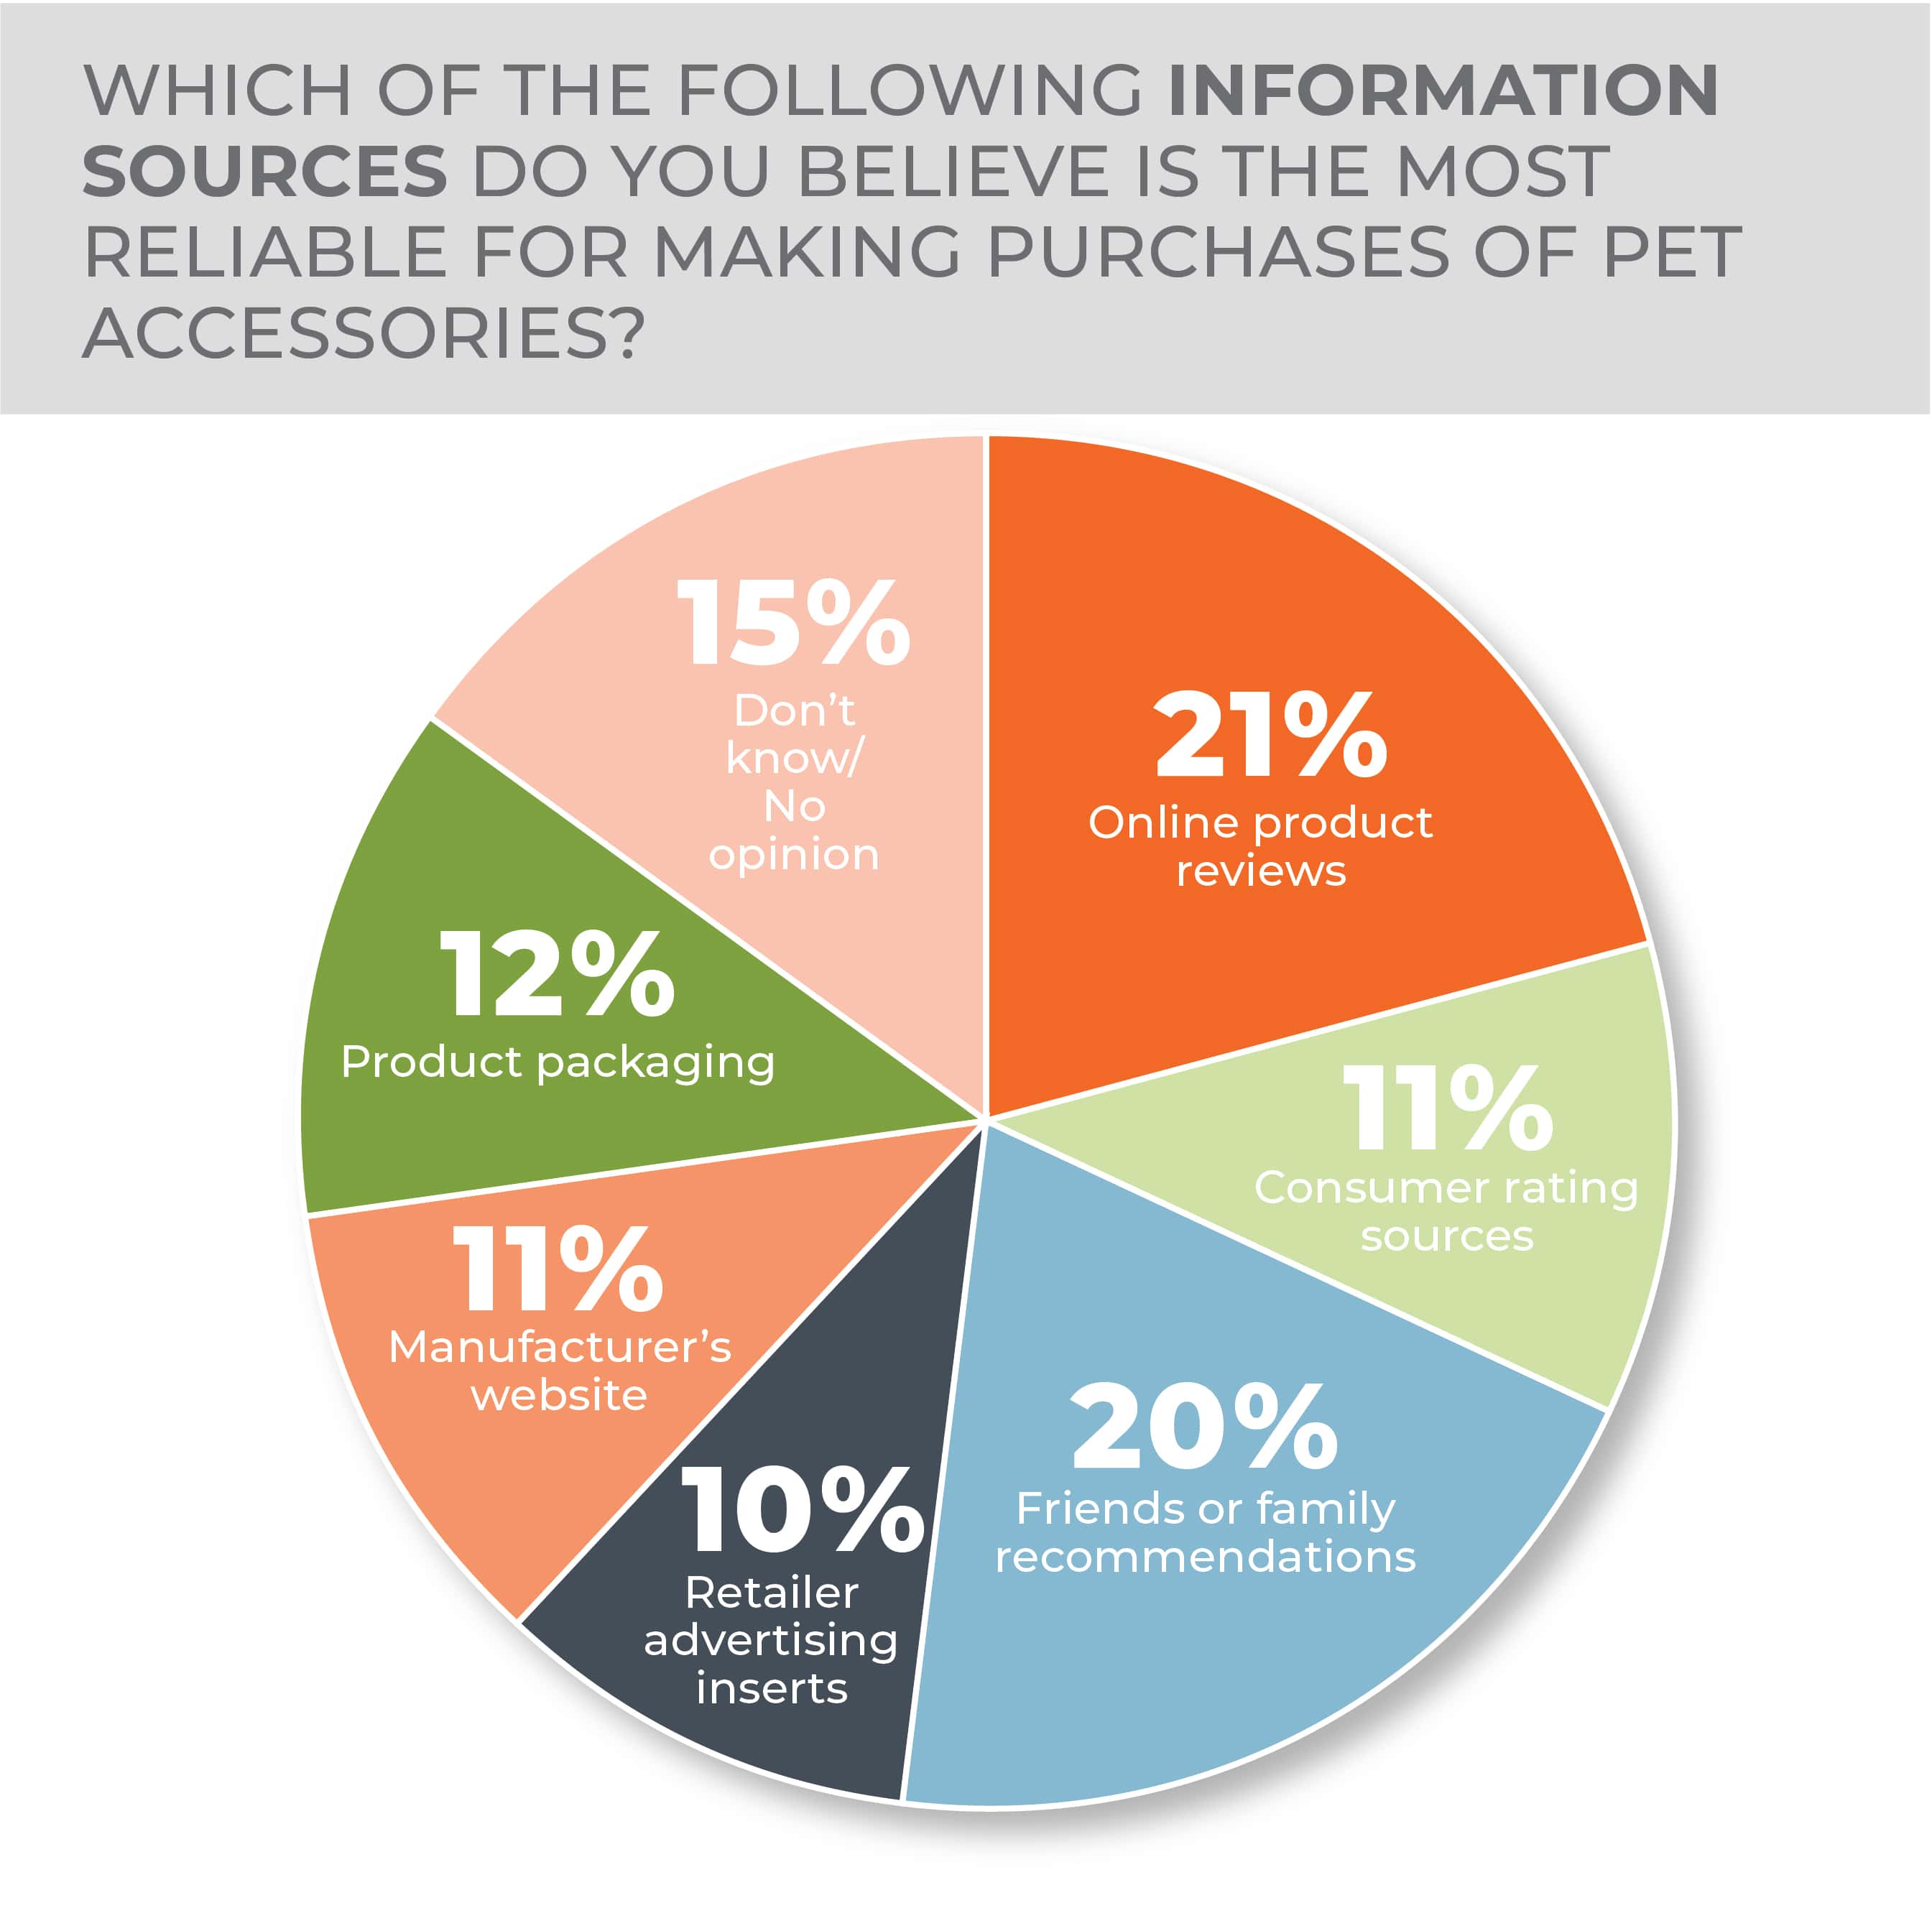
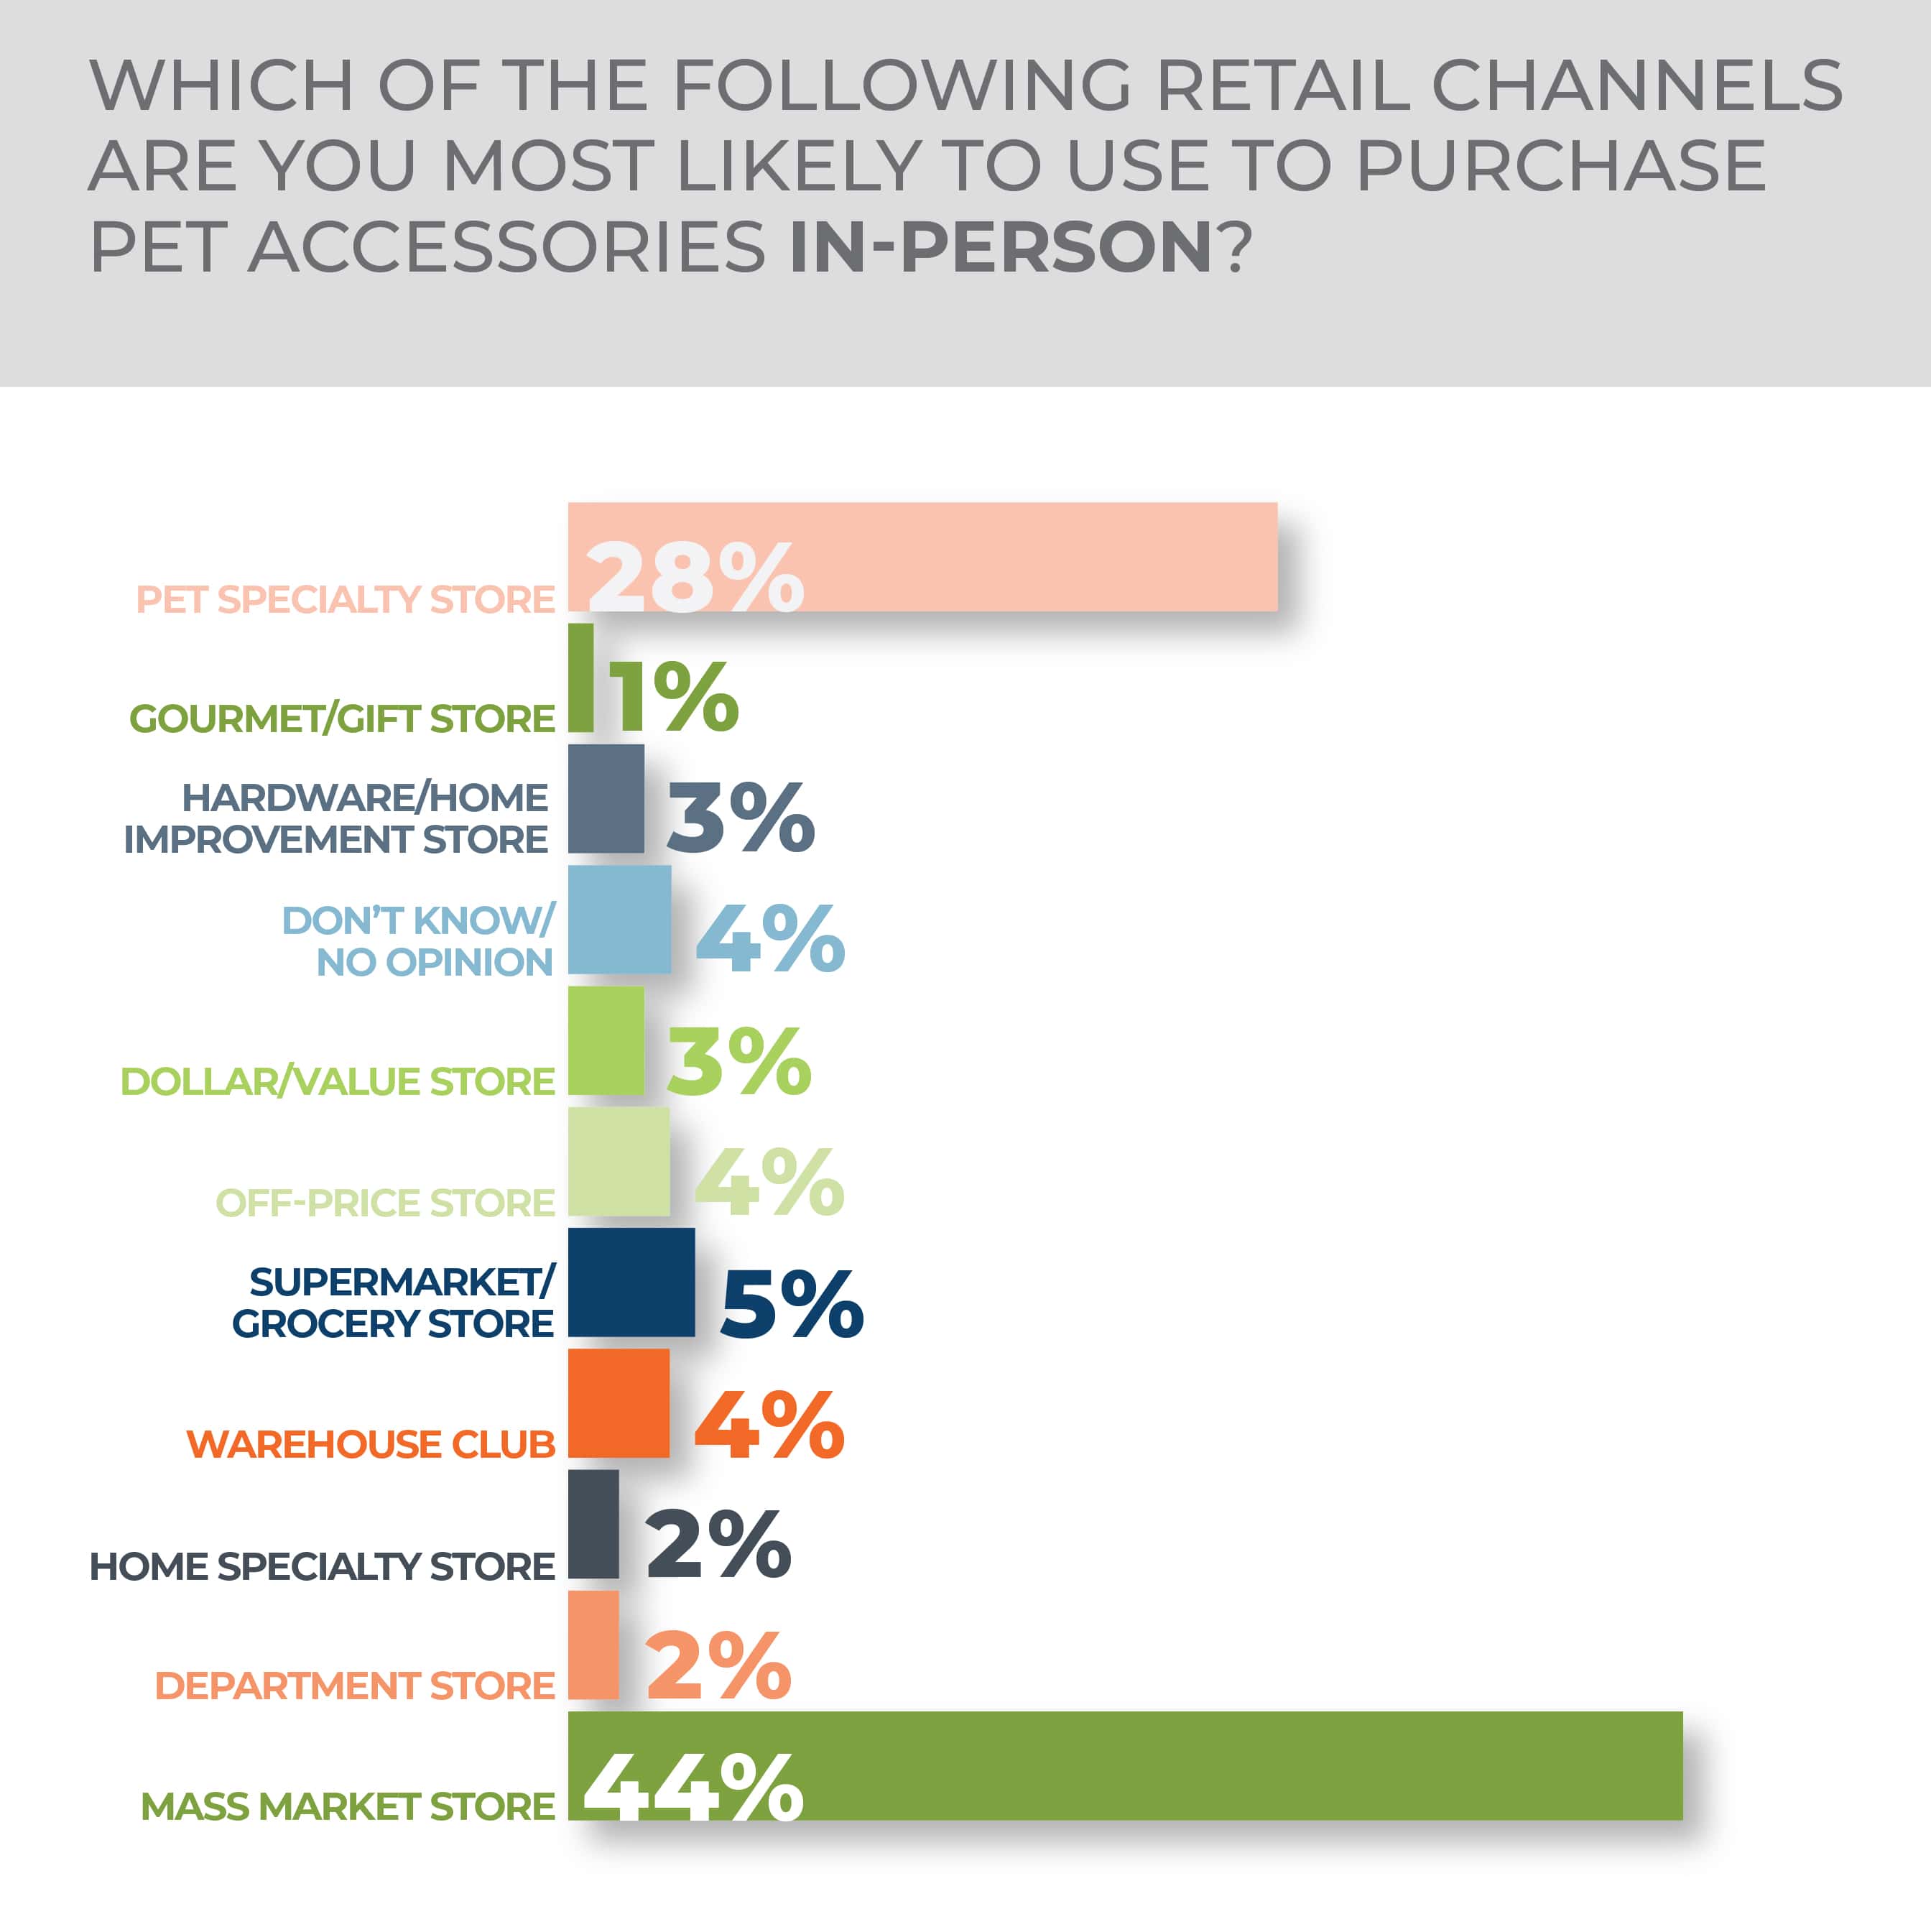
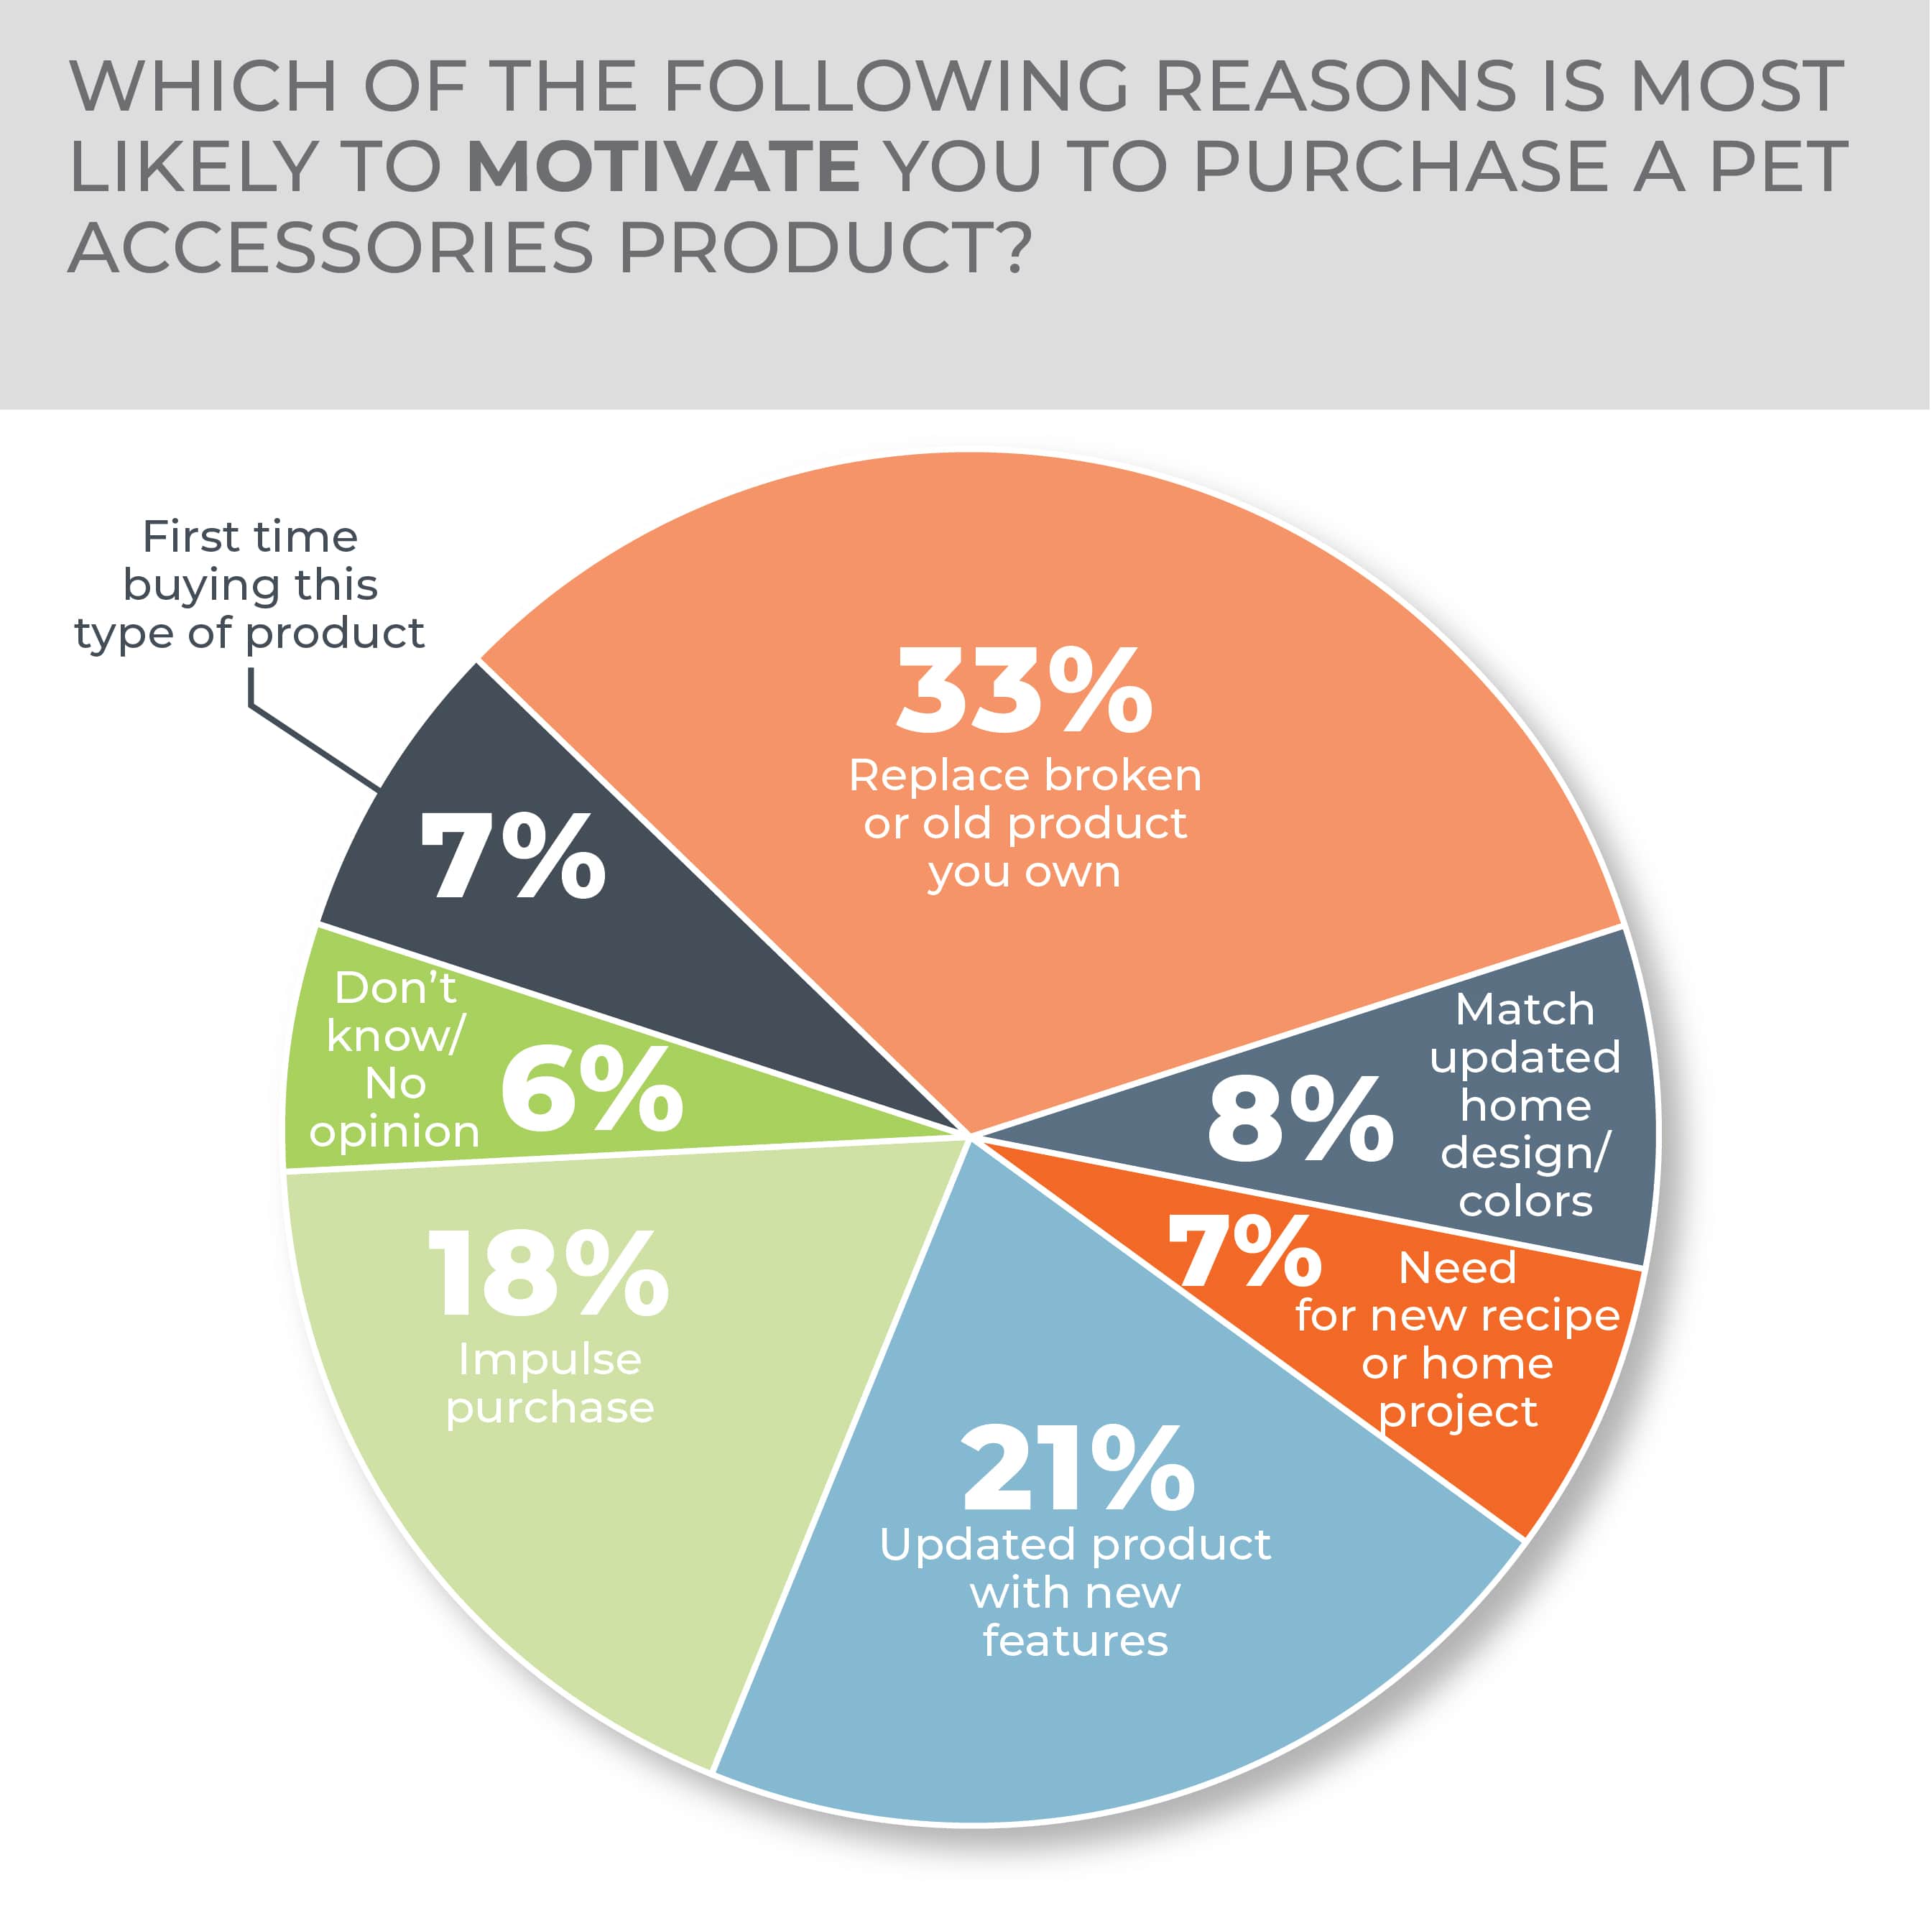
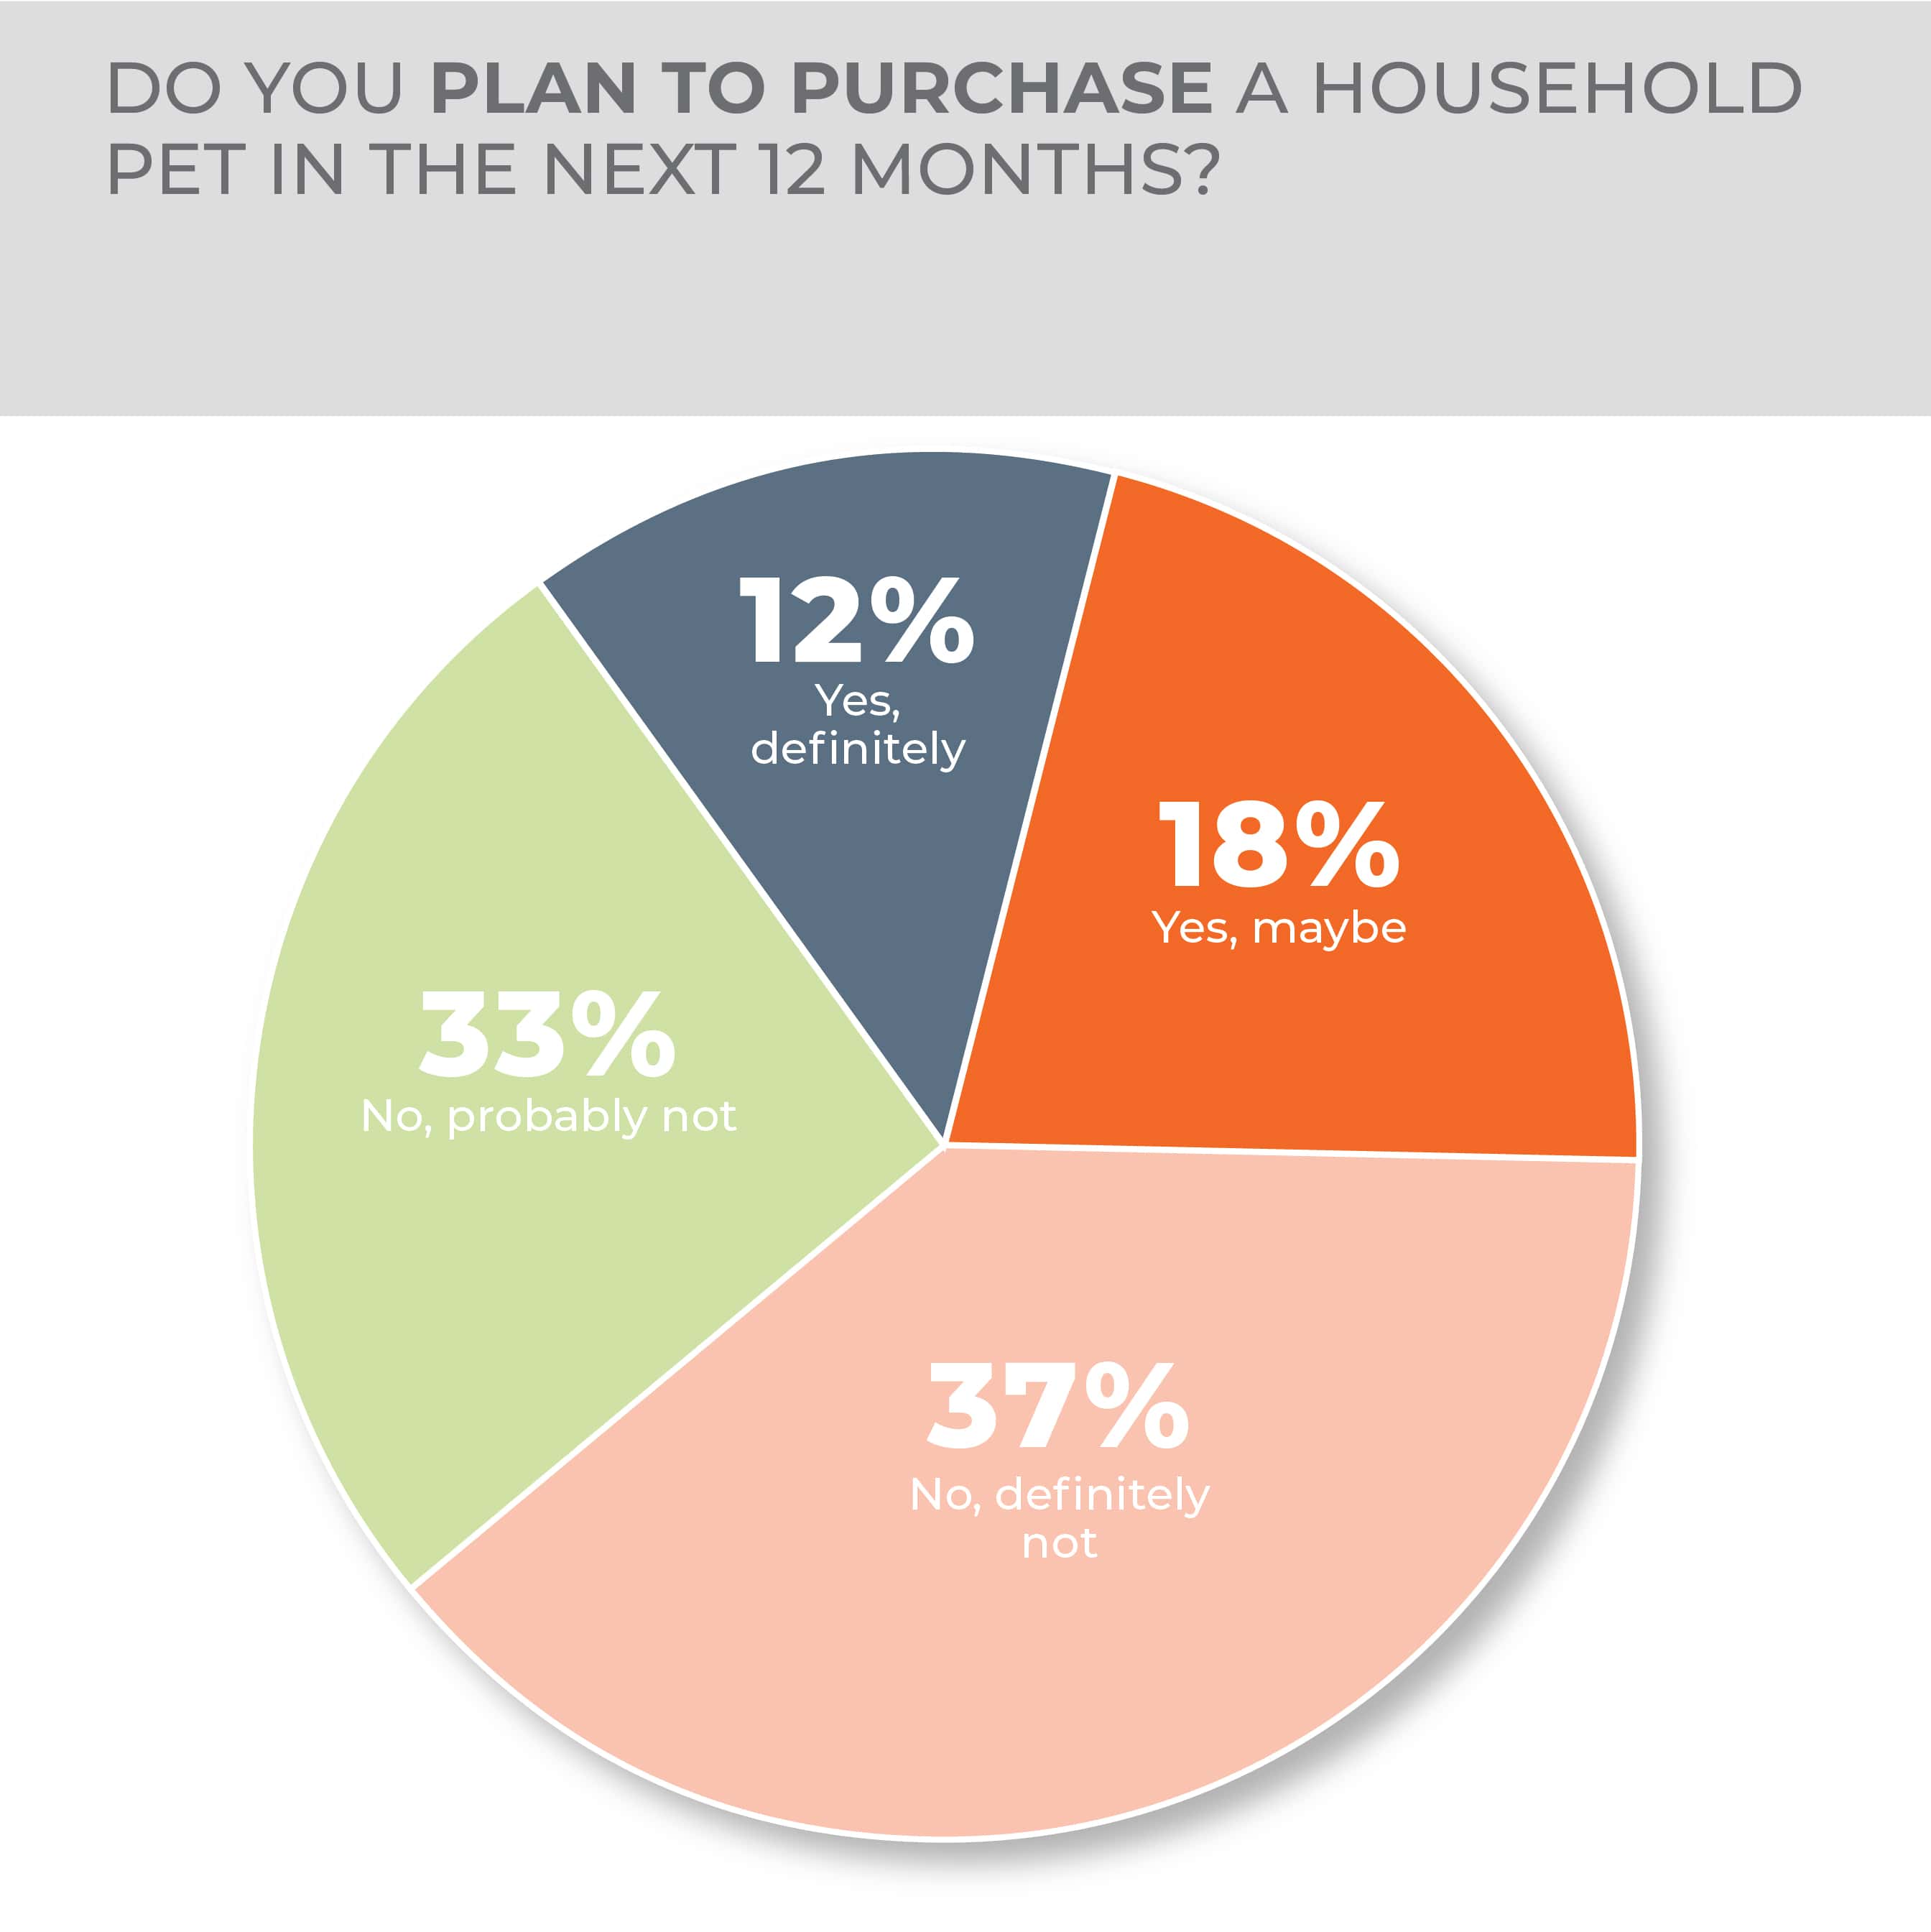
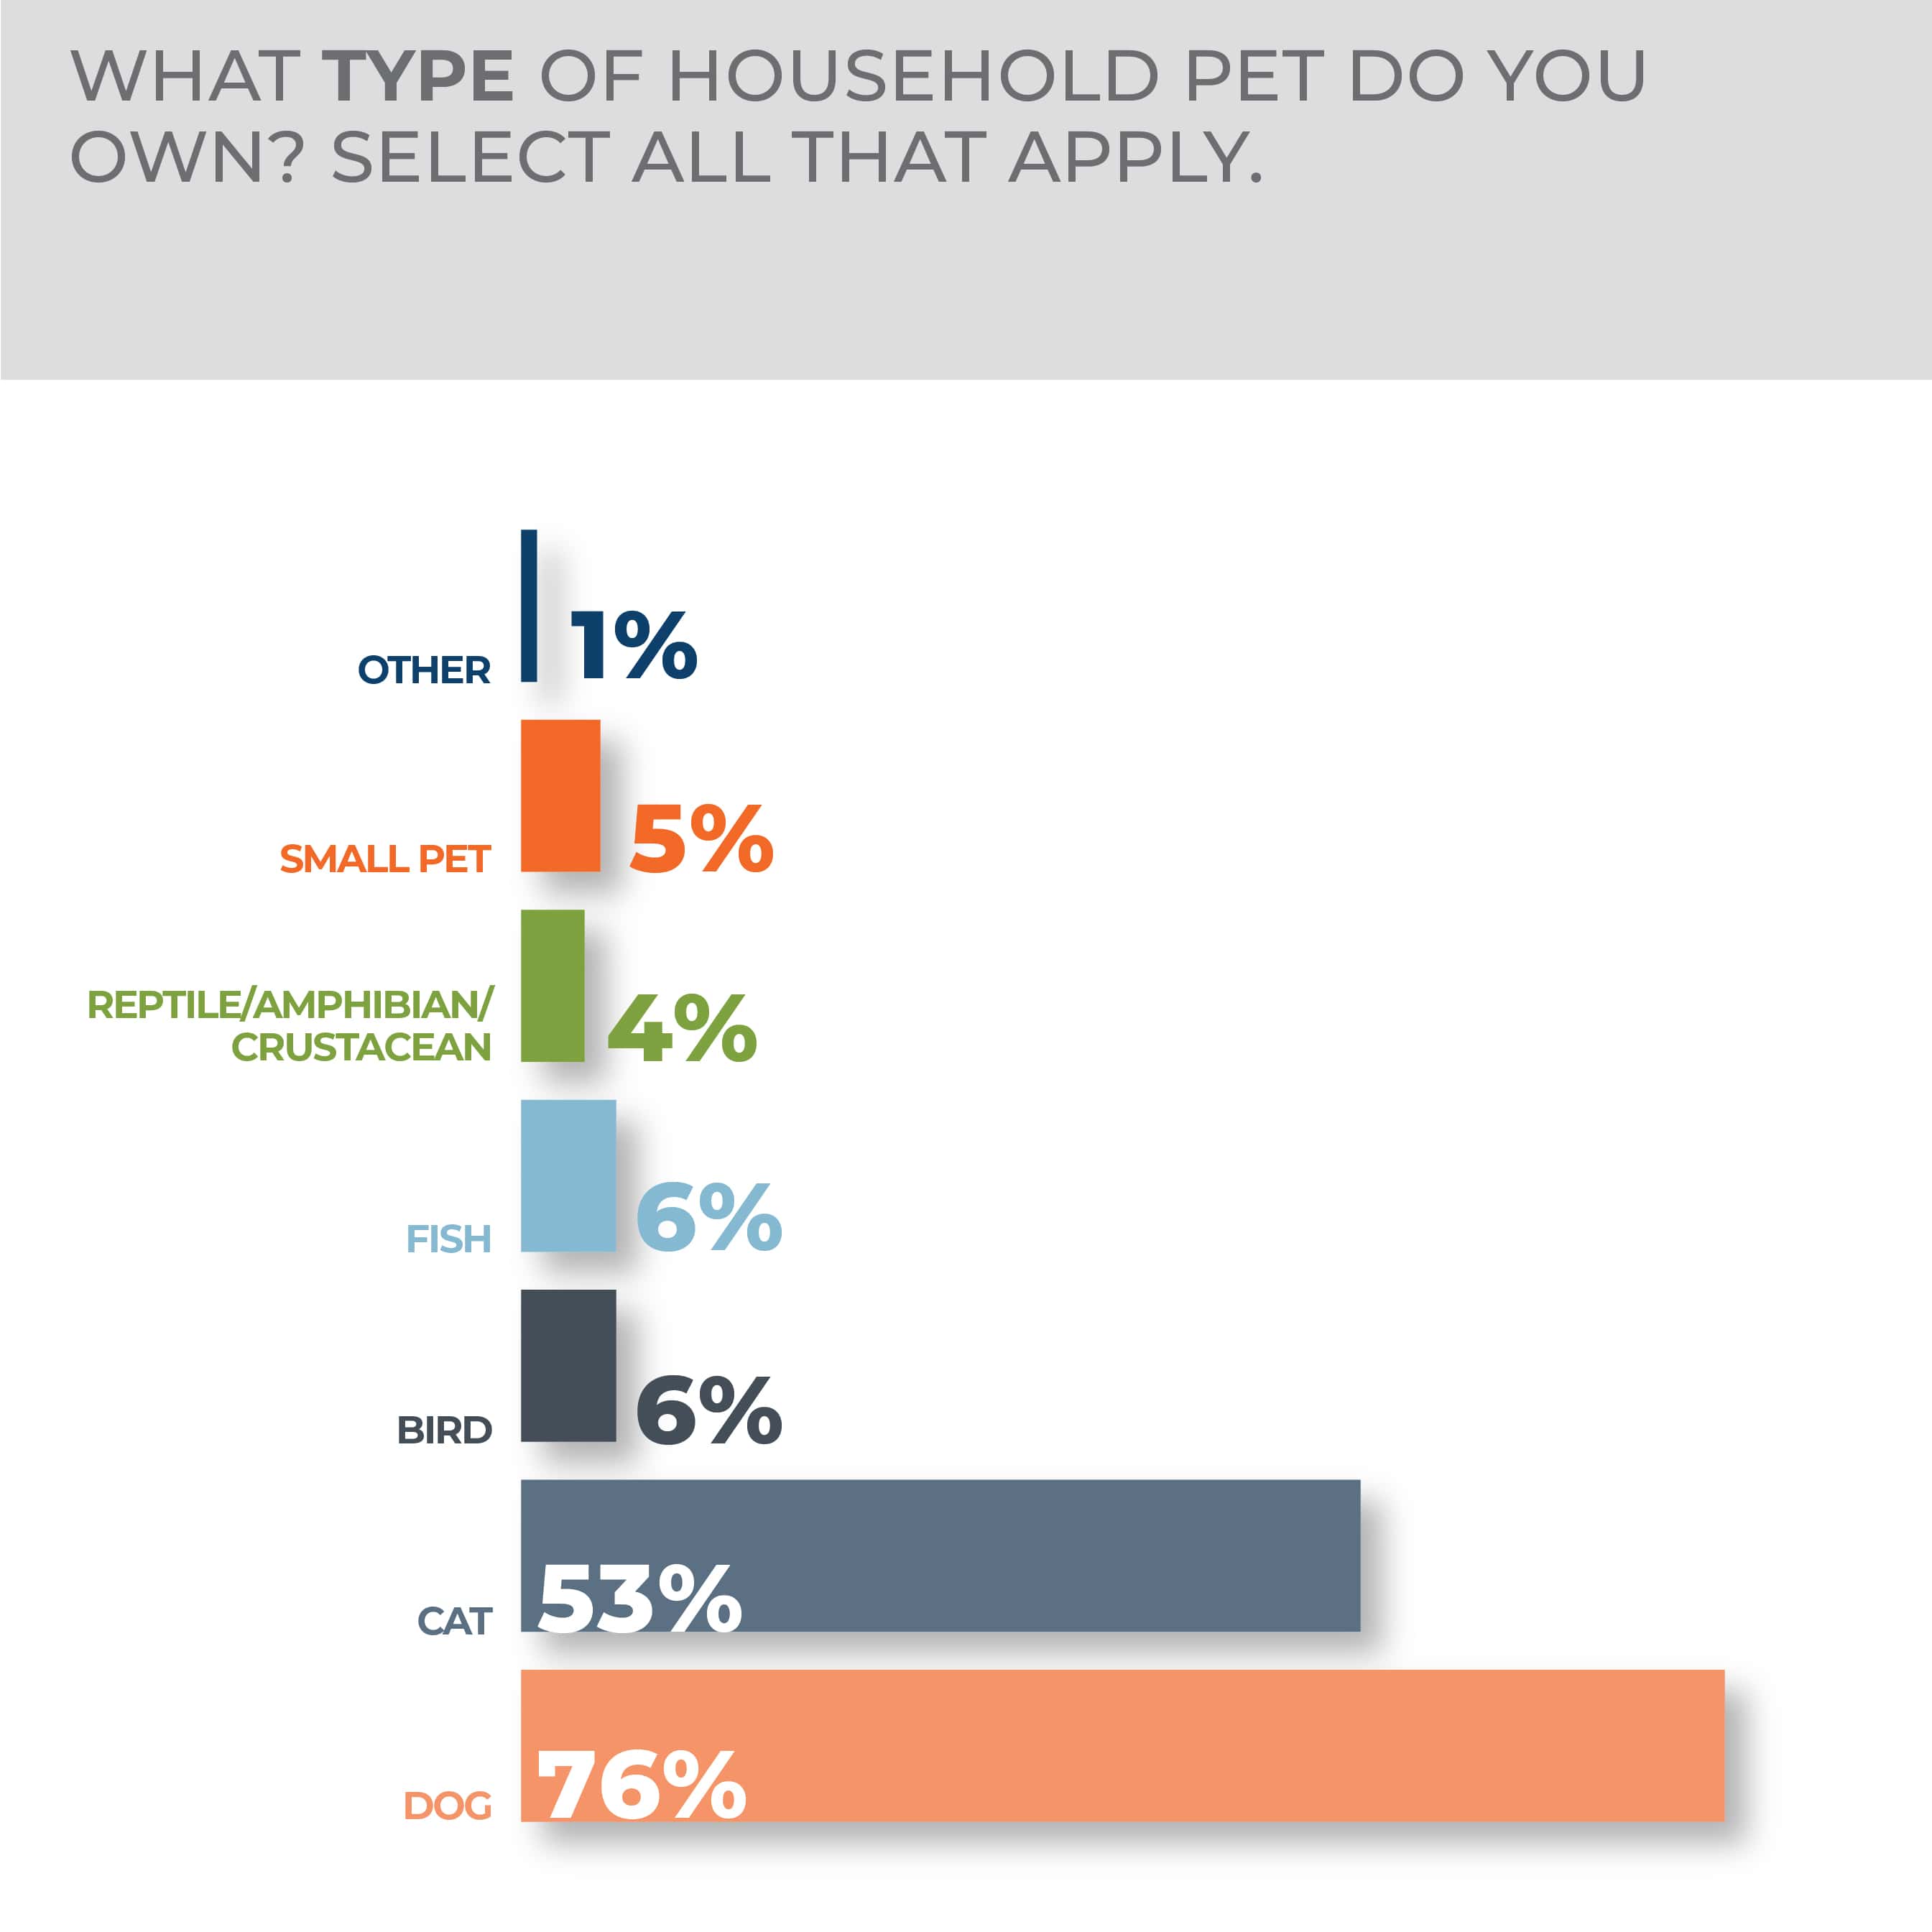
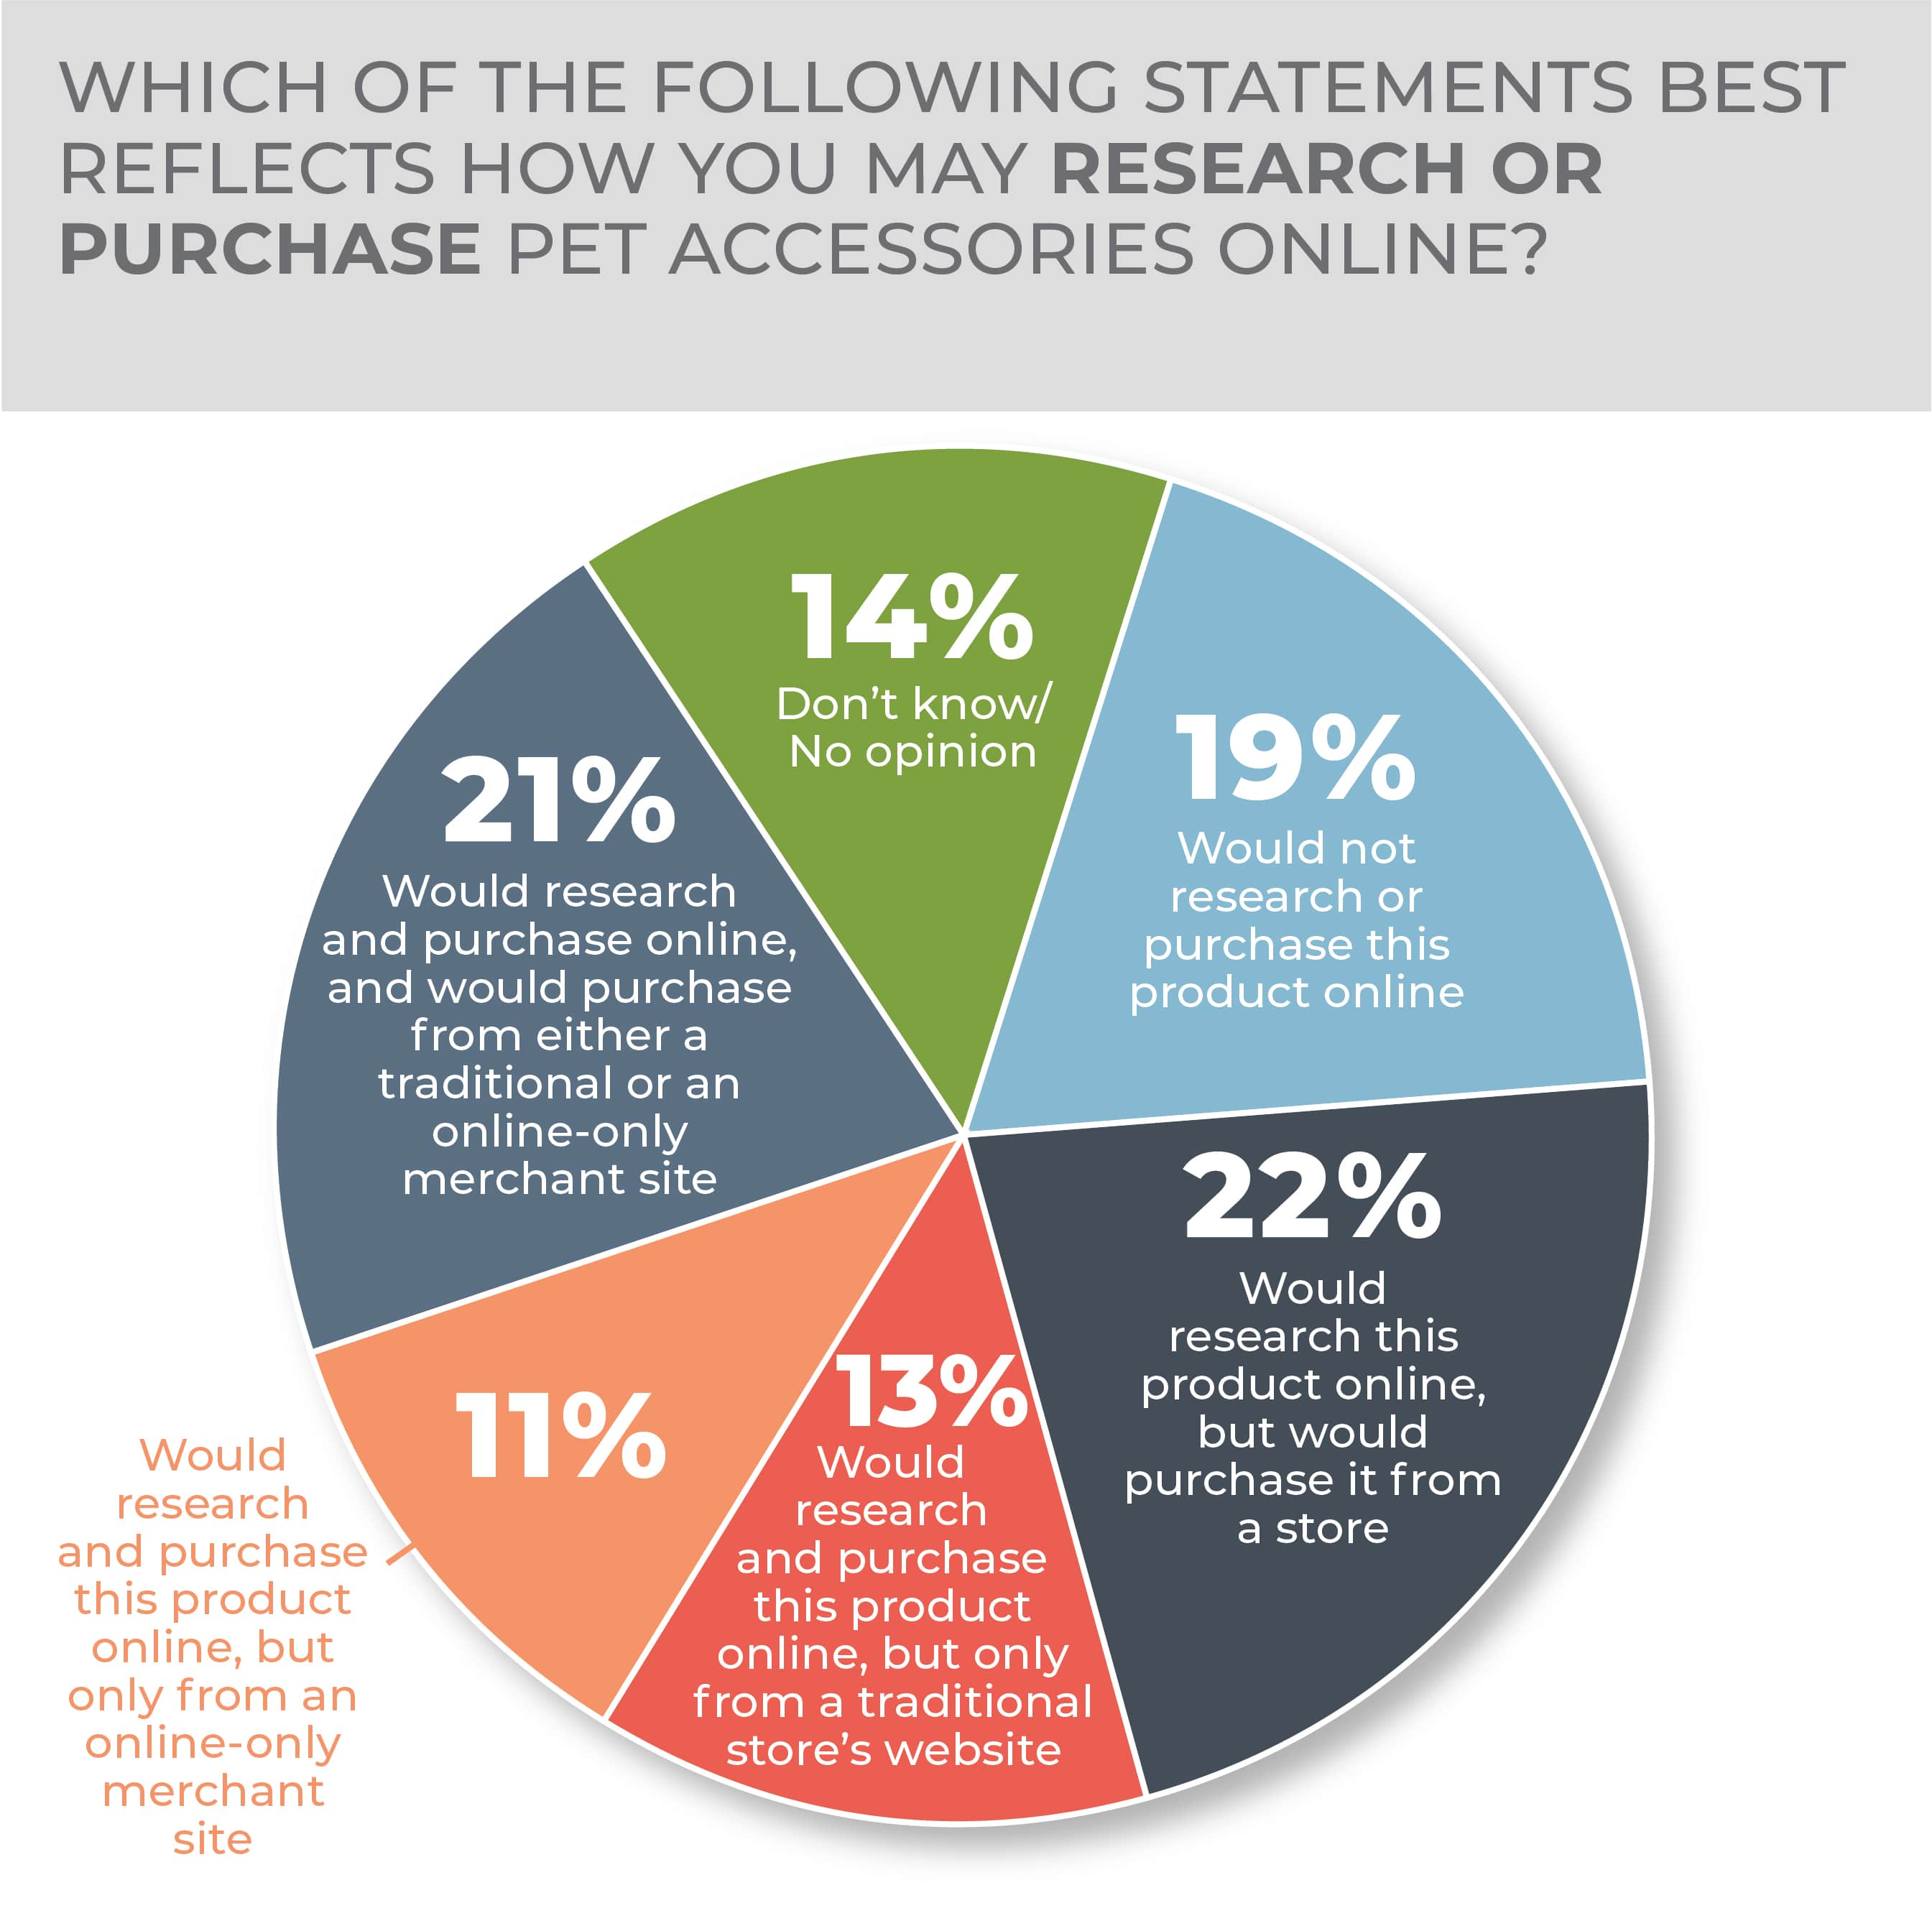
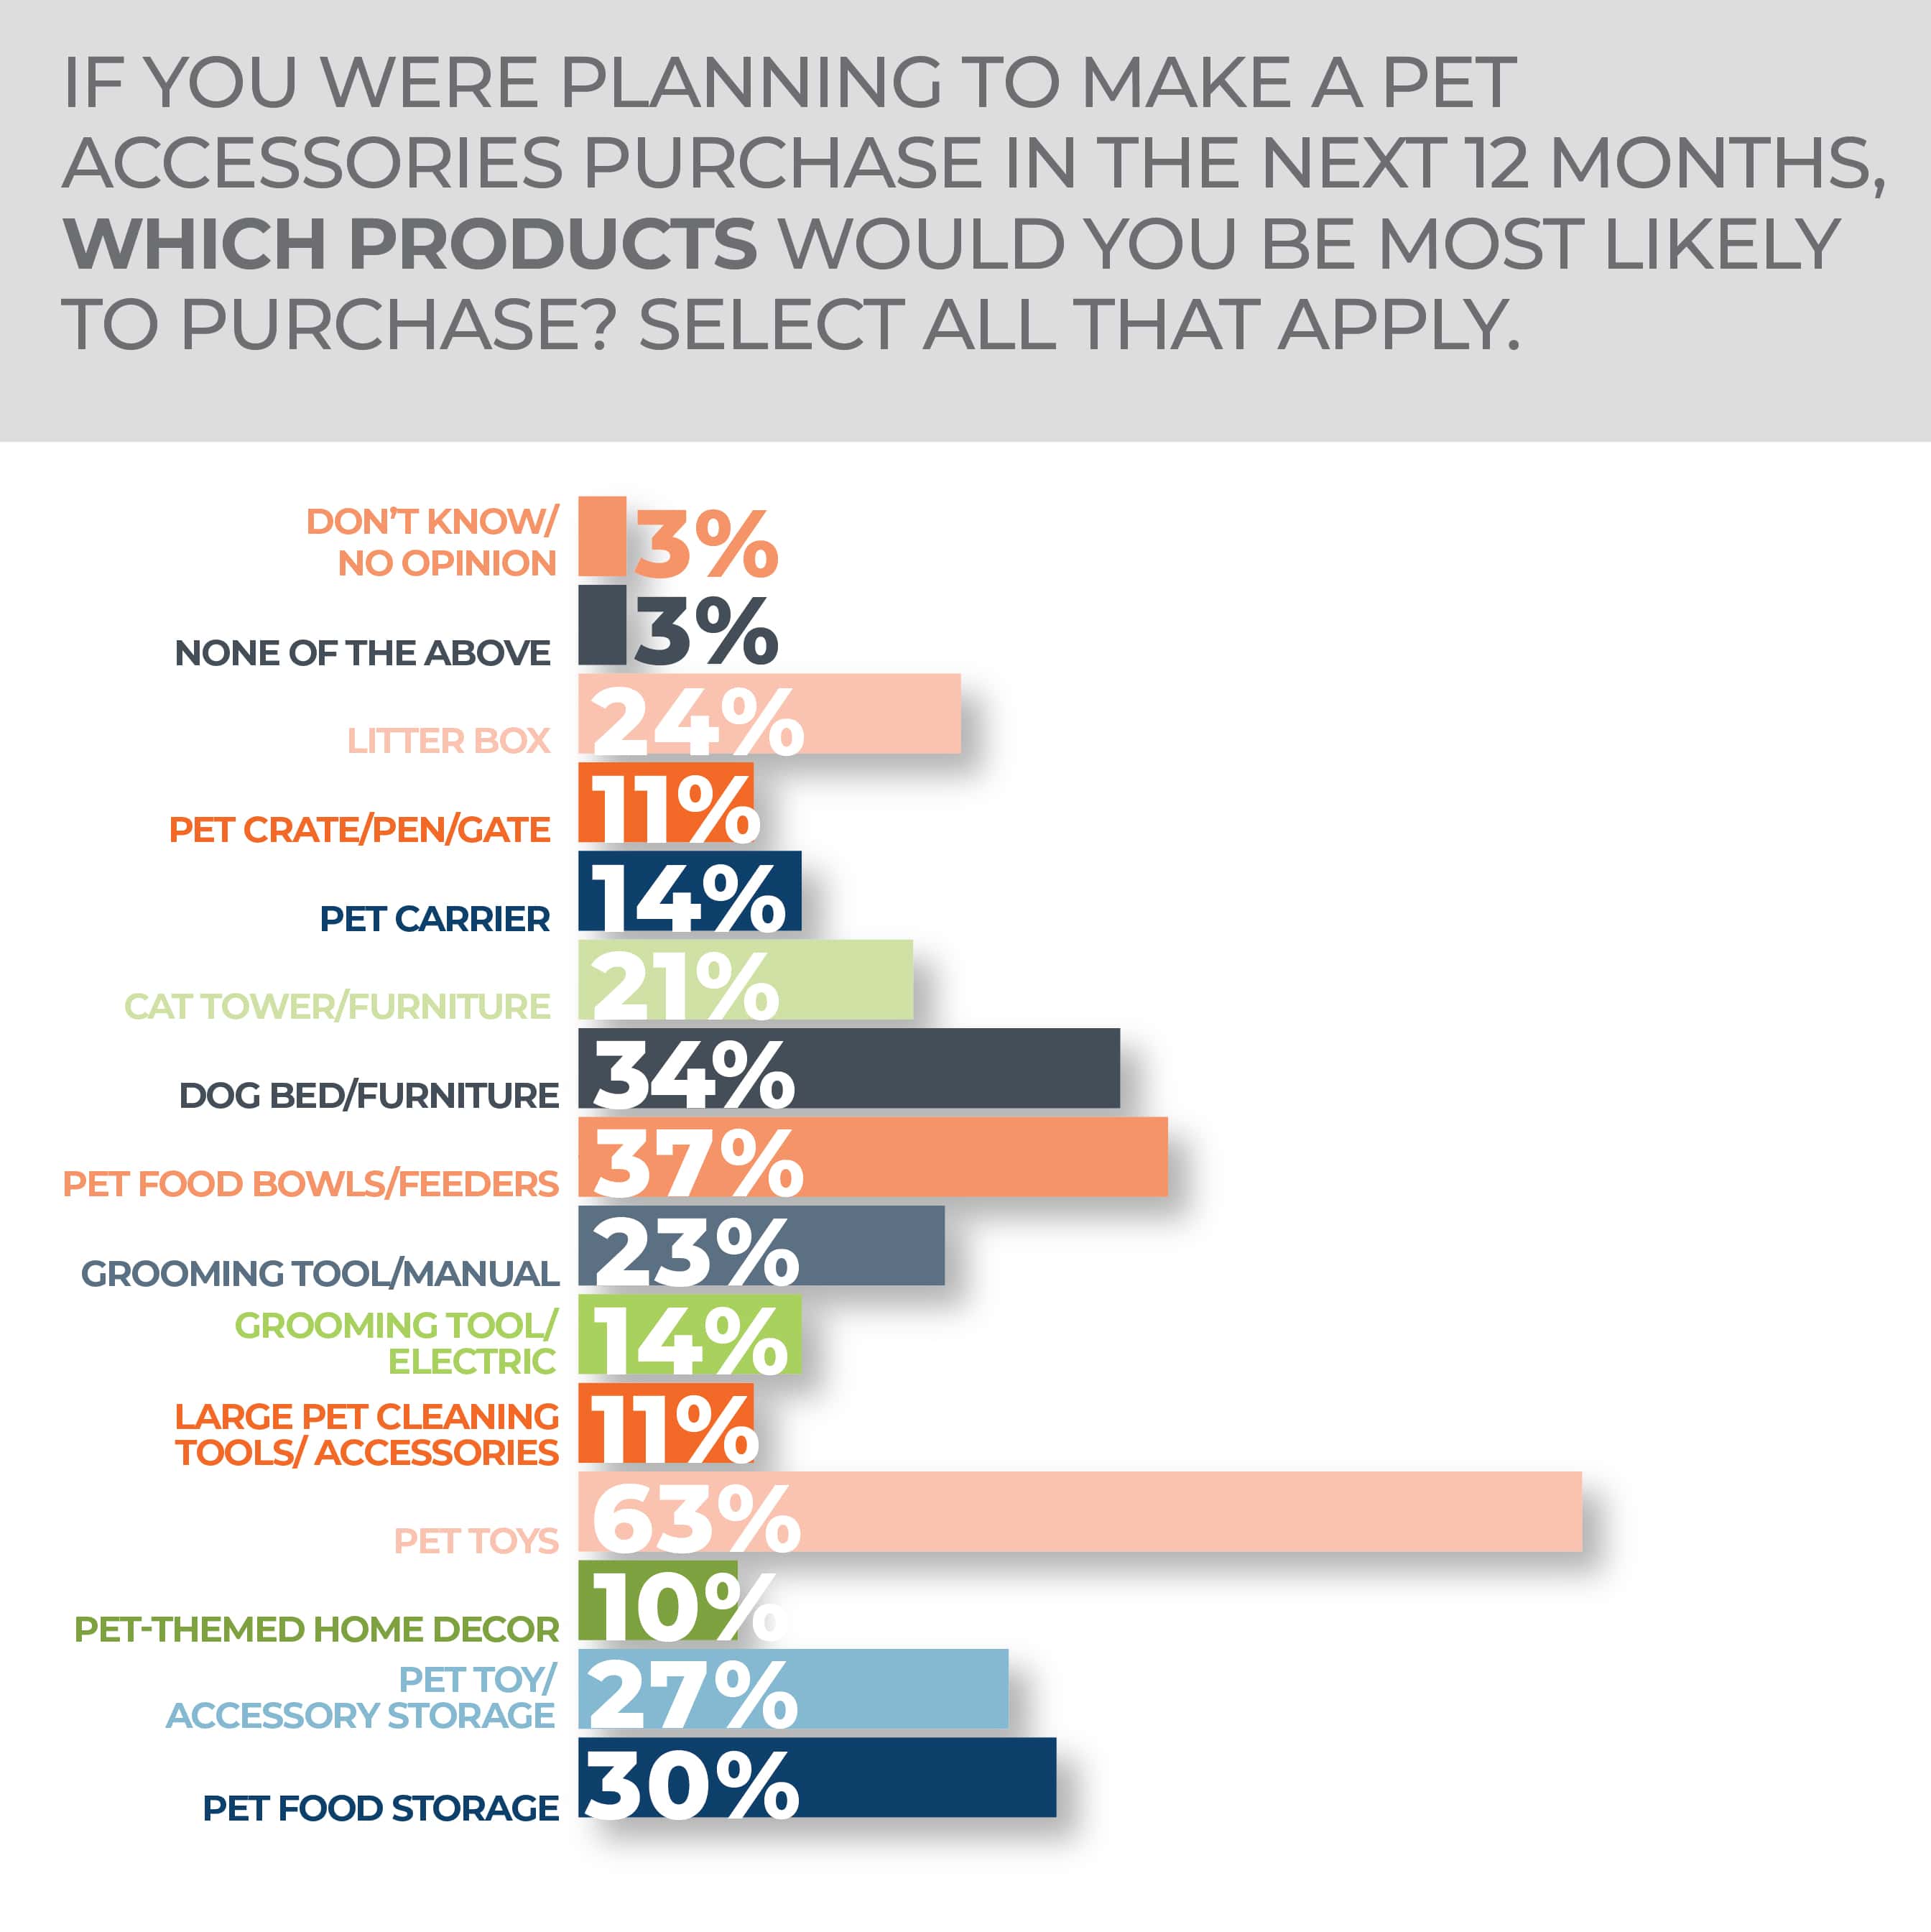

 Bakeware
 Cleaning Tools
 Cookware
 Cutlery
 Dinnerware
 Drinkware
 Flatware
 Floor Care Electrics
 Glassware
 Home Environment
 Kitchen Electrics
 Kitchen Textiles
 Kitchen Tools & Gadgets
 Outdoor Living
 Personal Care & Wellness
 Pet Accessories
 Storage & Organization
 Travel